TRANSPORTATION RESEARCH BOARD. Straight to Recording for All: Methods to Measure Walkability: From Qualitative to Quantitative
|
|
|
- Neil Wilson
- 6 years ago
- Views:
Transcription
1 TRANSPORTATION RESEARCH BOARD Straight to Recording for All: Methods to Measure Walkability: From Qualitative to Quantitative

2 Methods to Measure Walkability: From Qualitative to Quantitative Organized by ANF10 Standing Committee on Pedestrians


3 Measuring Walkability
 Patrick Singleton, Portland")
4 Today s Webinar Defining and Applying Walkability to Decision Making: Predicting Equity, Health & Economic Benefits of Land Use & Transportation Investments Lawrence Frank, Urban Design 4 Health Using Embodied Videos of Walking Interviews in Walkability Assessment Geoffrey Battista and Kevin Manaugh, McGill University The Pedestrian Index of the Environment (PIE) Patrick Singleton, Portland State University

5 DEFINING AND APPLYING WALKABILITY TO DECISION MAKING: PREDICTING EQUITY, HEALTH & ECONOMIC BENEFITS OF LAND USE & TRANSPORTATION INVESTMENTS Presentation for TRB Washington D.C. Dr. Lawrence Frank, AICP, PhD President, UD4H Eric Fox, MScP GIS Manager, UD4H CIVL 583: Transportation Planning & Analysis July 27, 2017
6 Unique background and depth of experience in the modeling of health and built environment relationships UD4H and collaborators have led over $25 million in research linking transportation and land use development actions with health outcomes Among most published scholars on health and built environment globally Key Focus Areas: o o o URBAN DESIGN 4 HEALTH (UD4H) Tool & Evidence Development Objective Measuring & Surveying Education, Outreach & Policy Development 2
7 CORE EXPERTISE Measuring spatial phenomena including walkability, transit level of service, regional accessibility and pedestrian environments Developing predictive models of travel patterns for nonmotorized, transit, private vehicle based demand Providing guidance for project-level programming and prioritization of active transport investments 3

8 The Hidden Health Costs of Transportation Frank et al 2010 American Public Health Association

9 Quality of Life Environmental Quality Air Quality and Greenspace Human Behavior Travel Patterns and Physical Activity Built Environment Transportation Investments and Land Use 5

10 CONCEPTUAL FRAMEWORK 6

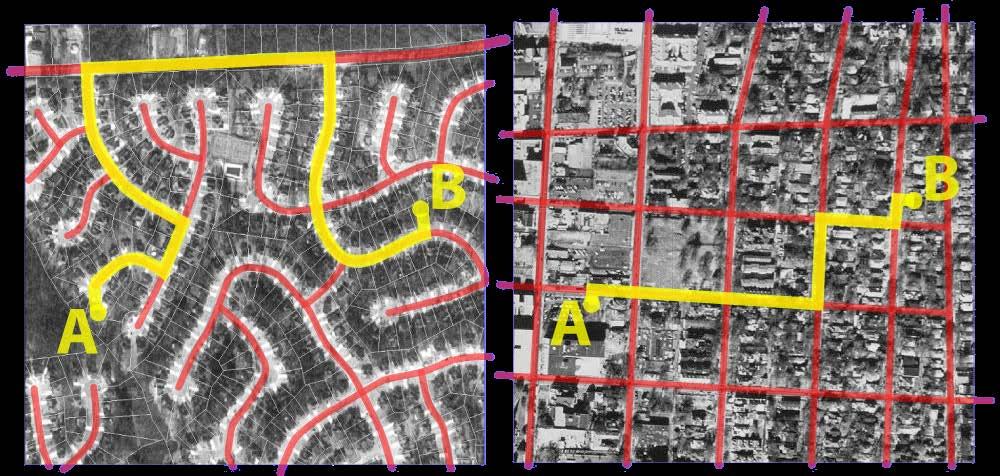
11 Proximity. 2 KM 1 KM Connectivity


12 Built Environment Data Sources Assessors / Parcel data Residential density, land use mix, retail FAR Food Environment Food Stores Restaurants Transport Roads, trails, bicycle facilities, sidewalks BUILT ENVIRONMENT MEASURES Green Space Tree canopy Parks Ministry of Education Schools Transit Agencies Transit stops Travel Time Census Demographic covariates

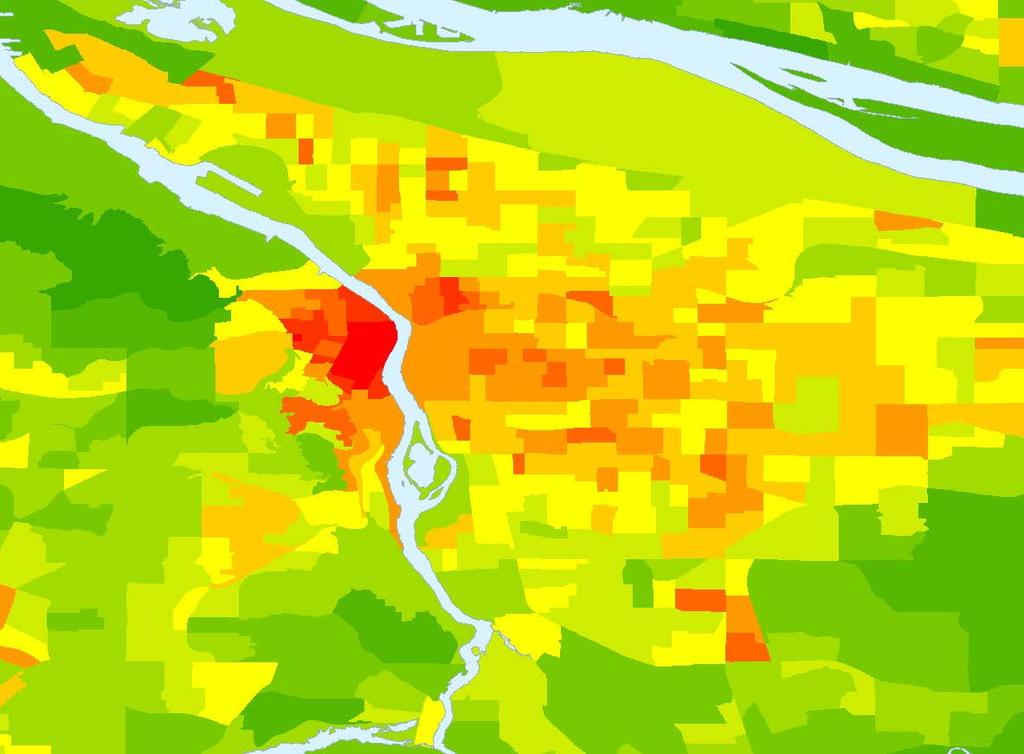
13 2011 Vancouver Walkability

14 Local Walkability How
15 Scenario planning overview SCENARIO PLANNING OVERVIEW Scenario planning is a method for analyzing and comparing the impacts of various land use and transportation alternatives Typical impacts considered include financial costs, transportation accessibility & housing availability More recently health impacts are being added Results are used to inform decision-making about infrastructure investments, master planning, development proposals, etc. 11
16 GENESIS OF TOOL DEVELOPMENT 2005: INDEX: Livable Community Initiative: Atlanta (SMARTRAQ) 2007: I-PLACE3S: King County, added health module 2011: UrbanFootprint: Vision California 2012: CommunityViz: San Diego, & Toronto, Ontario & Surrey, BC added health module 2015: California Public Health Assessment Module (CPHAM) for Urban Footprint : National Public Health Assessment Model (NPHAM) supported by National Environment Database (NED) 12
 data from")

17 SAN DIEGO COUNTY San Diego Healthy Works Application Palomar Gateway Development Data Sources: Health Outcomes: California Health Interview Survey (CHIS) data from for San Diego County (n = 18,044 adults, 1,368 teens, 2,715 children) Travel Behavior: SANDAG Household Travel Survey (n = 5,974 adults, 1,589 children & teens) 13


18 SAN DIEGO


19 CASE STUDY: PALOMAR GATEWAY 15
20 PALOMAR GATEWAY: BUILT ENVIRONMENT CHANGES Variable Base Scenario Change Scenario Units Single Family DU housing units Multi-Family DU housing units Total Population people Residential Area acres Net Residential Density units/acre Retail Floorspace square feet Retail Area acres Retail FAR Office Floorspace square feet Office Area acres Office FAR Civic and Education Floorspace square feet Recreation and Entertainment Floorspace square feet Park Area acres Number of Schools 0 0 Number of Transit Stops 3 3 Number of Grocery Stores 1 2 Total Road Centerline Miles miles Total Sidewalk Miles miles Sidewalk Coverage 53% 66% Total Bike Miles miles 16
21 PALOMAR GATEWAY RESULTS SUMMARY All adult health metrics improved in the change scenario, including 68% increase minutes of daily transportation walking 15.4% reduction in prevalence of high blood pressure 9.6 % reduction in prevalence of type II diabetes Child/teen results were mixed Physical activity predicted to increase for children/teens Obesity prevalence for teens predicted to increase Asthma prevalence for children/teens predicted to increase Collision risk factor increased 17


22 CALIFORNIA PUBLIC HEALTH ASSESSMENT MODULE (CPHAM) Funder: California Strategic Growth Council Key Elements: Quantitative statistical models of built environment & health Outcomes include BMI, likelihood of being obese, likelihood of having high blood pressure/heart disease/type 2 diabetes Integrated into Calthorpe s UrbanFootprint 18
 C-PHAM STUDY REGION")
23 30 counties across five California regions: San Francisco Bay Area Sacramento San Diego County San Joaquin Valley Southern California (including Los Angeles) C-PHAM STUDY REGION 19
 from UrbanFootprint California Household Travel Survey (CHTS) California Health Interview Survey (CHIS) 5 MPO regions Fine spatial scale analysis and predictions 1-km buffers")
24 CALIFORNIA PUBLIC HEALTH ASSESSMENT MODULE (CPHAM) Key Elements continued: Data from parcel level and address-level large, representative surveys Parcel level built environment data (density, connectivity, etc) from UrbanFootprint California Household Travel Survey (CHTS) California Health Interview Survey (CHIS) 5 MPO regions Fine spatial scale analysis and predictions 1-km buffers around 150x150 grid cells 20
 High Blood Pressure (%) Heart Disease (%) Diabetes - Type 2 (%)")
25 CALIFORNIA PUBLIC HEALTH ASSESSMENT MODULE (CPHAM) Key Elements continued: Outcomes: Recreation Physical Activity - Minutes Daily Walking - Minutes Daily Biking - Minutes Daily Auto - Minutes Daily Obese Population (%) High Blood Pressure (%) Heart Disease (%) Diabetes - Type 2 (%) 21
26 Large sample sizes STRENGTH OF APPROACH 53,733 California Household Travel Survey participants 40,617 California Health Interview Survey participants Cohort-specific model development 4 age groups (seniors, adults, teens, children) For adults, three HH income groups (<$50k, $50-100k, >$100k) California-specific evidence base CHIS and CHTS data were collected from a representative cross-section of Californians Variability in built environment characteristics 30-county study area covers a broad range of built environments and travel behaviors across California 22
27 Applying Evidence to the Los Angeles Long Range Plan Adults: Ages Base Year 2012 Net Change: ( ) Recreation Physical Activity - Minutes Daily 13 min + 9% Walking - Minutes Daily 23 min + 10% Biking - Minutes Daily 3 min + 12% Auto - Minutes Daily 55 min - 6% Obese Population (%) 21.5% - 3% Poor Health Population (%) 24.1% - 13% High Blood Pressure (%) 19.6% - 1% Heart Disease (%) 4.3% 0% Diabetes - Type 2 (%) 5.6% - 11% Source: California Public Health & Activity Model Scenario Planning for Southern California Association of Governments 23

 6.1% - 1.")
28 C-PHAM IN SCAG PREDICTIONS Adults: Ages Recreation Physical Activity - Minutes Daily 2040 Trend Adopted Plan 14.6 min +.4% Walking - Minutes Daily 12.1 min + 33% Biking - Minutes Daily 1.6 min + 26% Auto - Minutes Daily 64.8 min - 4.4% Obese Population (%) 26.3% - 1.3% High Blood Pressure (%) 21.5% - 1.2% Heart Disease (%) 4.4% - 1.0% Diabetes - Type 2 (%) 6.1% - 1.0% Source: California Public Health & Activity Model Scenario Planning for Southern California Association of Governments 24
29 National Environmental Database (NED) & National Public Health Assessment Model (N-PHAM)


30 Goal: Develop a nationally consistent database of built, natural, and social environmental indicators Funder: Robert Wood Johnson Foundation Key Elements: NATIONAL ENVIRONMENTAL DATABASE (NED) Built, natural, and social environment Developed at block group geography National coverage 26
31 From 30+ national & region-specific databases Government Agencies Universities Private Sector NED DATABASE Contains over 200 variables Leveraging existing variables, developing new variables 27
32 DATABASE DEVELOPMENT Types of Variables Existing nationwide variables (e.g. SLD, EnviroAtlas) Composite measures Variable weighting Region-specific new variables at smaller spatial scale Frequent updates of variables at regular intervals where available 28


33 NATIONAL PUBLIC HEALTH ASSESSMENT MODEL (N-PHAM) Goal: Develop a nationally applicable health impact tool that empower communities and developers to quantify localized health impacts of alternative land use and transportation investment scenarios Funder: U.S. Environmental Protection Agency Key Elements: Statistical regression models of built, natural, and social environment effects on health Direct connection with modeled land use, walkability and health outcomes Block group level analysis and model predictions Models developed from California statewide travel and health surveys 29

 Planners and")


34 PAIRING DATA & TOOLS National Database (NED) National Tool (N-PHAM) Planners and public health officials can measure and optimize health impacts of transport and land use investment 30


 Urban")

35 N-PHAM CONNECTS WITH EXISTING TOOLS Connects to scenario planning software via end user API and software-specific plug-in Fully integrated with: Envision Tomorrow (Fregonese Associates) Urban Footprint (Calthorpe Analytics) CommunityViz (City Explained, Inc., formerly Placeways) 31
36 NPHAM PHASE 1 - OUTCOMES Physical Activity: Transport walking, transport biking, recreational PA Sedentary time: Auto travel General health: Prevalence of poor selfreported general health Obesity-related: Average BMI, obesity prevalence, overweight prevalence Mental health: Moderate to serious psychological distress prevalence Diabetes and cardiovascular disease planned in Phase II 32

37 CONTACT QUESTIONS INFORMATION Dr. Larry D. Frank: Mr. Eric Fox: @UD4H_INC Visit our website: CIVL 583: Transportation Planning & Analysis

38 Using Embodied Videos of Walking Interviews in Walkability Assessment Geoffrey Battista Ph.D. Candidate McGill Kevin Manaugh Assistant Professor McGill
 Socioeconomic factors (Manaugh and El-Geneidy, 2011) Built Environment and Health Research Group at Columbia University (https://behcolumbia.files.wordpress.")
39 Walkability: Measuring Physical Space What is walkability? Generalizable instruments Geospatial measures Audit-based measures Shortcomings to date Locals perceptions (Hajna et al., 2013) Socioeconomic factors (Manaugh and El-Geneidy, 2011) Built Environment and Health Research Group at Columbia University (

40 Context Matters The Uncertain Geographic Context Problem (Kwan 2012) How do complex areal attributes (e.g., land use mix) impact individual outcomes? How can we balance generalizable processes and their particularities, across space and among individuals, to better understand the relationship between context and outcomes? We propose that assessment treats the pedestrian as integral to the geographic context of walkability.


 Walking interviews (Anderson, 2004; Evans")

41 Toward Socializing Walkability Rethinking walkable space (Lefebvre, 1974/1991; Massey, 2005) Physical and social distances Complex and everchanging Ways of understanding Embodiment and reflection (Middleton, 2010; Spinney, 2006; 2011) Walking interviews (Anderson, 2004; Evans and Jones, 2011) Spinney, 2011 Evans and Jones, 2012
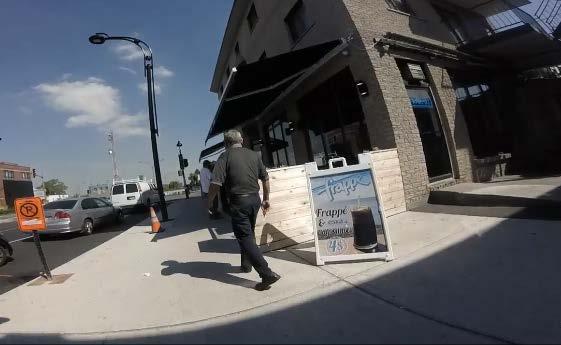
42 Our Approach Sedentary interview (1hr) 1. Start with personal history and neighborhood selection 2. Discuss routines and preferred amenities, e.g., shopping 3. Use amenities to discuss nearby streets, e.g., traffic, crime, and aesthetics 4. Flexibly pursue emerging themes Walking interview (1hr) 1. Mount GoPro camera and begin participant-led tour 2. Prompt participant re: physical features, events, their feelings 3. Stop at key locations to discuss in greater depth, relating to previous statements 4. Debrief and solicit ideas for improving walking


43 Generating new insights Sample: 5 pilot-testing cases, followed by 30 residents of one neighbourhood Our approach illuminates: Features in conventional tools Amenities and paths unique to locals Informal behavior by participants and others (and its impact on walking) Local knowledge of crime and traffic Top: I don t know why they don t redraw the lines. Does that mean they don t want it to be a crossing path anymore? (Elena) Bottom: Dodging a cyclist on the sidewalk
44 Cars turning very quickly from highway Friend mugged outside temple Pedestrian countdown very short, causing participant to run Halfway house Poor intersection design promotes jaywalking Mafia firebombing Aggressive panhandler hangs out Ogilvy is a sketchy street KEY 4 daycares, no crosswalks Unsafe from traffic Unsafe from crime

45 Cars turning very quickly from highway Taking a closer look

46


47 KEY KEY amenity food ephemeral amenity cafe/bar - old man

48 Alleyway: Shortcut or amenity?
49 Implications for Practice Complement existing walkability measures Compare local and technical knowledge Examine difference among different groups, e.g., people with disabilities, low-income Use multimedia as compelling evidence As a stand-alone approach Gauge local needs at low cost, e.g., for cash-strapped advocacy groups Engage the community; people love to talk about themselves Tailor walkability audits and performance measures to local context
50 Methodological Insights A versatile, collaborative approach Reflect on physical and social spaces shaping walking behavior Inform design of pedestrian interventions beyond built solutions, e.g., law enforcement, social inclusion policies Relatively low-cost (camera, interviewing manual, compensation) Acknowledging limitations Researcher should be familiar with walkability audits and interviewing Difficult to compare trajectories and assessments* * We address this by grounding interviews in a qualitative GIS. See Battista, G.A. and K. Manaugh (2017). Illuminating Spaces in the Classroom using Qualitative GIS. Journal of Geography in Higher Education.


51 Thank you! Contact Geoffrey A. Battista Ph.D. Kevin Manaugh Assistant Acknowledgements We thank all participants for their unique insights, and Dr. Sarah Turner of McGill University for her methodological contributions. Funding was provided by: Social Sciences and Humanities Research Council of Canada
52 The Pedestrian Index of the Environment (PIE) Patrick A. Singleton Portland State University Maseeh College of Engineering & Computer Science Department of Civil & Environmental Engineering
 Robert Schneider")

53 Acknowledgements Kelly Clifton (Portland State University) Robert Schneider (University of Wisconsin Milwaukee) Portland State University Jaime Orrego Joseph Totten Christopher Muhs 2

54 Outline Walkability Pedestrian Index of the Environment (PIE) Transferable PIE Comparing between & within regions Conclusions & future work Adapted from: 3


55 Why walkability? Pedestrian planning, infrastructure Physical activity, health & safety Mode shifts, emissions Property values, neighborhood vitality 4
56 Walkability measures Pedestrian Environment Factor (PEF) 1 Walkability Index 2 Walk Opportunities Index 3 Walk Score 4 Pedestrian Index of the Environment (PIE) 5 1. Parsons Brinckerhoff Quade and Douglas, Cambridge Systematics, & Calthorpe Associates, LUTRAQ Volume 4A Frank, Schmid, Sallis, Chapman, & Saelens, Kuzmyak, Baber, & Savory, Singleton, Schneider, Muhs, & Clifton,
57 Original objectives Metro: Portland s metropolitan planning organization (MPO) Improving representation of the pedestrian environment in travel demand models Four-step travel demand forecasting process Finer spatial resolution Research-based measures of the built environment Behavioral sensitivity 1. Generation 2. Distribution 3. Mode choice 4. Assignment 6
 = (6 dimensions) weighted by")

58 What is PIE? The Pedestrian Index of the Environment (PIE) = (6 dimensions) weighted by association with walking People & job density Transit access Block size Sidewalk extent Urban living infrastructure Comfortable facilities ULI = Urban Living Infrastructure: pedestrian-friendly shopping and service destinations used in daily life. 7

59


60 PIE s unique contributions Calibrated to walking behavior Grid cells: pedestrian analysis zones (PAZs) Fine-grained built environment data Adapted from: 9

61 New objectives Transferability and forecasting of the PIE for modeling and planning applications Retain unique aspects: small scale, behavioral Use nationally-available built environment data Evaluate transfer to different regions and urban contexts Examine issues & needs when forecasting PIE 10
62 PIE 2.0 EPA s Smart Location Database (SLD) Census block groups Population density Transit frequency density Employment density (retail + entertainment) Intersection density (pedestrian-oriented) 11
63
64 Variations between regions 40% Seattle Portland San Francisco Los Angeles San Diego Walk trip mode share 30% 20% 10% 0% Population density (people/acre) 13
65 Variations within regions 40% Low density High density Walk trip mode share 30% 20% 10% R² = 0.61 R² = % Population density (people/acre) 14


66 Challenges Data availability Behaviorally-relevant measures of the built environment Small spatial scale of walk trips Variations in behavioral relationships Between or among regions Within regions: non-linear? 15
67 Conclusions Increasing behavioral and environmental data Calibrated walkability measures for Behaviors Utilitarian/recreational walking, public activity Applications Travel demand, residential location, health, safety Networks, connectivity, accessibility Future work: Spatial scale Forecasting 16
68 Thank you! Learn more Pedestrian Modeling Workshop Transportation & Communities Summit September 12, 2017 Portland, OR Questions? Patrick A. Singleton PhD Candidate Portland State University 17
INTEGRATING HEALTH INTO SCENARIO PLANNING
 INTEGRATING HEALTH INTO SCENARIO PLANNING Dr. Lawrence Frank, President UD4H, Inc. Seattle, Washington Professor in Population and Public Health and Urban Planning University of British Columbia Outline
Webinar: Development of a Pedestrian Demand Estimation Tool
 Portland State University PDXScholar TREC Webinar Series Transportation Research and Education Center (TREC) 2-18-2016 Webinar: Development of a Pedestrian Demand Estimation Tool Kelly Clifton Portland
A Framework For Integrating Pedestrians into Travel Demand Models
 A Framework For Integrating Pedestrians into Travel Demand Models Kelly J. Clifton Intersections Seminar University of Toronto September 22, 2017 Portland, Oregon, USA Region Population~ 2.4 M Urban Growth
Peel Health Initiatives Health and Urban Form
 Region of Peel Public Health Peel Health Initiatives Health and Urban Form alpha Conference June 9, 2008 Gayle Bursey Director, Chronic Disease and Injury Prevention Declaration No part of the information
Summary Report: Built Environment, Health and Obesity
 Research and education Built Environment Edmonton Project Summary Report: Built Environment, Health and Obesity Introduction In 2007 the Canadian Institutes of Health Research and the Heart and Stroke
Sandra Nutter, MPH James Sallis, PhD Gregory J Norman, PhD Sherry Ryan, PhD Kevin Patrick, MD, MS
 Objectively Measured Environmental Correlates of Adolescent Physical Activity Sandra Nutter, MPH James Sallis, PhD Gregory J Norman, PhD Sherry Ryan, PhD Kevin Patrick, MD, MS San Diego State University
Presentation Summary Why Use GIS for Ped Planning? What Tools are Most Useful? How Can They be Applied? Pedestrian GIS Tools What are they good for?
 1 2 Pedestrian GIS Tools What are they good for? Pro Walk / Pro Bike 2006 Presentation Summary Why Use GIS for Ped Planning? What Tools are Most Useful? How Can They be Applied? Matt Haynes Fehr & Peers
Pedestrian Demand Modeling: Evaluating Pedestrian Risk Exposures
 Pedestrian Demand Modeling: Evaluating Pedestrian Risk Exposures Kelly J. Clifton National Center for Smart Growth University of Maryland May 19, 2008 Study Team University of Maryland National Center
Focus on New Baseline Conditions, Indicators and Analytic Approaches
 Focus on New Baseline Conditions, Indicators and Analytic Approaches Lindsey Realmuto, MPH Health Program Planner San Francisco Department of Public Health Overview HIA Assessment Tools HDMT and Baseline
Kevin Manaugh Department of Geography McGill School of Environment
 Kevin Manaugh Department of Geography McGill School of Environment Outline Why do people use active modes? Physical (Built environment) Factors Psychological Factors Empirical Work Neighbourhood Walkability
Perryville TOD and Greenway Plan
 Perryville TOD and Greenway Plan Greenway Glossary Pathway: A bicycle and pedestrian path separated from motorized vehicular traffic by an open space, barrier or curb. Multi-use paths may be within the
Complete Streets 101: The Basics
 Complete Streets 101: The Basics Michigan Municipal League - Capital Conference March 21, 2017 Chip Smith, AICP - Senior Planner - Wade Trim Inc. and City Council member City of Ann Arbor 2017 MML Capital
Public Health in the Public Realm: Influencing Street Design with Health in Mind Dr. David McKeown Medical Officer of Health
 Public Health in the Public Realm: Influencing Street Design with Health in Mind Dr. David McKeown Medical Officer of Health Complete Streets Forum April 23, 2010 Common Goals of Public Health and Complete
Health Impact Analysis for Integrated Regional Land Use and Transportation Plan
 Health Impact Analysis for Integrated Regional Land Use and Transportation Plan Hsi-Hwa Hu, Guoxiong Huang, Frank Wen, Simon Choi (Southern California Association of Governments) Margaret Shih (Los Angeles
WALKNBIKE DRAFT PLAN NASHVILLE, TENNESSEE EXECUTIVE SUMMARY NASHVILLE, TENNESSEE
 NASHVILLE, TENNESSEE EXECUTIVE SUMMARY Executive Summary A world-class multi-modal transportation system is essential to a vibrant city and better quality of life. -Mayor Barry The WalknBike plan aims
WALK Friendly Communities: Creating Vibrant, Inclusive Places for People
 WALK Friendly Communities: Creating Vibrant, Inclusive Places for People Walkers are the indicator species for vibrant communities ~ Dr. Rodney Tolley, Director, Walk21 Imagine yourself walking safely
Prioritizing Transportation Policy and Funding for Active Transportation, Safety, Equity and Health
 Mayor Karl Dean, Chairman Prioritizing Transportation Policy and Funding for Active Transportation, Safety, Equity and Health Leslie A. Meehan, AICP Planning and Implementing the Active Community Webinar
Traffic Safety Barriers to Walking and Bicycling Analysis of CA Add-On Responses to the 2009 NHTS
 Traffic Safety Barriers to Walking and Bicycling Analysis of CA Add-On Responses to the 2009 NHTS NHTS Users Conference June 2011 Robert Schneider, Swati Pande, & John Bigham, University of California
Carbonless Footprints: Health and Environmental benefits of Active Transportation
 Carbonless Footprints: Health and Environmental benefits of Active Transportation Dr. Lawrence Frank, Professor and Bombardier Chair in Sustainable Transportation - University of British Columbia Health
What s Health Got to Do With It? Health and Land Use Planning
 What s Health Got to Do With It? Health and Land Use Planning CANDACE RUTT, PH.D. EXECUTIVE DIRECTOR APRIL 13 TH, 2016 Planning and Public Health Planning + Public Health Healthy Communities Healthier
Memorandum. Drive alone
 Memorandum To: Cc: From: Kimberly Kerr, Assistant Chief Administrative Officer Natalie Porter, PE, TE Shawna Purvines Claudia Wade, PE Michael Schmitt, AICP CTP, PTP Re: Technical Memorandum #2: Model
How Policy Drives Mode Choice in Children s Transportation to School
 How Policy Drives Mode Choice in Children s Transportation to School Physical Activity through Active Transportation Ruth L. Steiner 2011 Technical Conference and Exhibit Lake Buena Vista, FL April 3-6,
RESOLUTION NO ?? A RESOLUTION OF THE CITY OF NEPTUNE BEACH ADOPTING A COMPLETE STREETS POLICY
 RESOLUTION NO. 2018-?? A RESOLUTION OF THE CITY OF NEPTUNE BEACH ADOPTING A COMPLETE STREETS POLICY WHEREAS, safe, convenient, and accessible transportation for all users is a priority of the City of Neptune
2014 peterborough city and county. active. transportation. & health. indicators primer
 2014 city and county active transportation & health indicators primer executive summary Walking, cycling and transit are good for our personal health, our local economies, and the environment. Understanding
Transit-Driven Complete Streets
 Questions: Type questions into the box at bottom of webinar panel. Panelists for today s webinar: Nimotalai Azeez, Program Associate with the National Complete Streets Coalition Rich Weaver, Director of
TR NEWS. Public Health and Transportation. Innovation, Intervention, and Improvements NUMBER 299 SEPTEMBER OCTOBER 2015
 TR NEWS NUMBER 299 SEPTEMBER OCTOBER 2015 Public Health and Transportation Innovation, Intervention, and Improvements Public Health and Transportation Measuring the Health Benefits of Walking and Bicycling
Public Works AGENDA ITEM D-2 STAFF REPORT
 AGENDA ITEM D-2 Public Works STAFF REPORT Transportation Master Plan Oversight and Outreach Committee Meeting Date: 10/30/2017 Staff Report Number: 17-001-TMP Regular Business: Provide feedback on Performance
GRAHAM PEDESTRIAN TRANSPORTATION PLAN
 GRAHAM PEDESTRIAN TRANSPORTATION PLAN Chapter 1 I 1.1 Scope and Purpose n March of 2005, the City of Graham contracted with Greenways Incorporated (GWI) to create a Pedestrian Transportation Plan. The
Use this guide to learn more about walkability and how you can make your community safer to walk
 Walkability Guide Do You Enjoy Walking In Your Community? Use this guide to learn more about walkability and how you can make your community safer to walk 2 About This Guide Circulate San Diego believes
City of Baton Rouge and Parish of East Baton Rouge
 City of Baton Rouge and Parish of East Baton Rouge An Analysis of Neighborhood Walkability Louisiana Remote Sensing and GIS Workshop April 22-25, 2013 Cajundome Convention Center Lafayette, Louisiana April
Dr. Lawrence Frank, Professor, University of British Columbia & President, Urban Design 4 Health, Inc.
 Dr. Lawrence Frank, Professor, University of British Columbia & President, Urban Design 4 Health, Inc. On 350 calories one apple tart or a special slice of Ray's Pizza a cyclist can travel 10 miles, a
ADOT Statewide Bicycle and Pedestrian Program Summary of Phase IV Activities APPENDIX B PEDESTRIAN DEMAND INDEX
 ADOT Statewide Bicycle and Pedestrian Program Summary of Activities APPENDIX B PEDESTRIAN DEMAND INDEX May 24, 2009 Pedestrian Demand Index for State Highway Facilities Revised: May 29, 2007 Introduction
Perceptions of the Physical Environment Surrounding Schools & Physical Activity among Low-income, Urban, African American Adolescent Girls
 Perceptions of the Physical Environment Surrounding Schools & Physical Activity among Low-income, Urban, African American Adolescent Girls Erin Hager, PhD Candice Gormley, BS Laura Latta, MHS M. Reese
Pathways to a Healthy Decatur
 CHAPTER 1 Pathways to a Healthy Decatur Health is a holistic sense of spiritual, mental, and physical well-being and the absence of illness and disease - a compilation of definitions of health by community
Bike Share Social Equity and Inclusion Target Neighborhoods
 Bike Share Social Equity and Inclusion Target Neighborhoods Target Neighborhoods West End/Visitation Park/Academy/Hamilton Heights Wellsgoodfellow/Kingsway West The Ville/Greater Ville Kingsway East/Fountain
The Walkability Indicator. The Walkability Indicator: A Case Study of the City of Boulder, CO. College of Architecture and Planning
 1 : A Case Study of the City of Boulder, CO College of Architecture and Planning University of Colorado Author Note: Daryoosh Ardalan, Urban Regional Planning, College of Architecture and Planning, University
The best indicator of an individual s and expanding access to parks and open space.
 Health & Wellness Create a Safe and Healthy Built Environment Artist s rendering, 2014 Health is important to Loveland residents, and stakeholders see the many strong connections between quality of life,
Pedestrian Project List and Prioritization
 To: Kyle Wagenschutz, City of Memphis CC: From: Anne Conlon and John Cock, Alta Planning + Design Date: December, 2014 Re: Project List Development (Task 3.1-3.2) and Project List Prioritization (Task
The Impact of Placemaking Attributes on Home Prices in the Midwest United States
 The Impact of Placemaking Attributes on Home Prices in the Midwest United States 2 0 1 3 C O N S T R U C T E D E N V I R O N M E N T C O N F E R E N C E M A R Y B E T H G R A E B E R T M I C H I G A N
BUILDING THE CASE FOR TRAVEL OPTIONS IN WASHING TON COUNTY. Image: Steve Morgan. Image: Steve Morgan
 BUILDING THE CASE FOR TRAVEL OPTIONS IN WASHING TON COUNTY Image: Steve Morgan Image: Steve Morgan Image: TriMet Image: TriMet WHAT ARE TRAVEL OPTIONS PROGRAMS? Travel options programs encourage residents,
Rerouting Mode Choice Models: How Including Realistic Route Options Can Help Us Understand Decisions to Walk or Bike
 Portland State University PDXScholar TREC Friday Seminar Series Transportation Research and Education Center (TREC) 4-1-2016 Rerouting Mode Choice Models: How Including Realistic Route Options Can Help
Catalyst for Change:
 Catalyst for Change: Toronto Examples Linking Health and Transportation Presented at Walk 21 Conference Vancouver 2011 Monica Campbell, Director Healthy Public Policy Toronto Public Health 1 About Toronto
Built Environment and Older Adults: Supporting Smooth Transitions Across the Life- Span. Dr. Lawrence Frank, Professor and Bombardier UBC
 Built Environment and Older Adults: Supporting Smooth Transitions Across the Life- Span Dr. Lawrence Frank, Professor and Bombardier Chair @ UBC The Hidden Health Costs of Transportation - Frank et al
Public Consultation Centre For. Transportation Master Plan Update. Information Package
 Public Consultation Centre For Transportation Master Plan Update Information Package Date Location Hours Tuesday, September 12, 2017 Wednesday, September 13, 2017 Tuesday, September 19, 2017 Cambridge
Identifying and Prioritizing Biking and Walking Needs
 Identifying and Prioritizing Biking and Walking Needs The 2012 Utah Bicycle and Pedestrian Barriers Survey TRB Planning Applications Conference May 6, 2013 RSG, Inc Chloe Ritter Elizabeth Greene James
Methodology for Linking Greenways and Trails with Public Transportation in Florida
 Methodology for Linking Greenways and Trails with Public Transportation in Florida Sara Hendricks, Senior Research Associate Center for Urban Transportation Research, University of South Florida CUTR Webcast,
Active Community Design: Why Here? Why Now?
 Active Community Design: Why Here? Why Now? Chris Holm Development Review Coordinator 20 April, 2015 Sacramento, California Our environment has changed North Natomas We ve rapidly urbanize our open space
Creating Complete Streets to Accommodate All Users
 Creating Complete Streets to Accommodate All Users Peter Lagerwey, Toole Design Group plagerwey@tooledesign.com Brian Dougherty, Seattle DOT brian.dougherty@seattle.gov International Conference on Urban
GIS Based Non-Motorized Transportation Planning APA Ohio Statewide Planning Conference. GIS Assisted Non-Motorized Transportation Planning
 The Purpose of GIS Assisted Network GIS Assisted Non-Motorized Transportation 2011 APA Ohio Statewide Conference Friday, 10:45 AM to Noon Focus on near-term projects wwwgreenwaycollabcom The purpose of
Roadway Bicycle Compatibility, Livability, and Environmental Justice Performance Measures
 Roadway Bicycle Compatibility, Livability, and Environmental Justice Performance Measures Conference on Performance Measures for Transportation and Livable Communities September 7-8, 2011, Austin, Texas
Cascade Bicycle Club Strategic Plan
 The Greater Context Bicycling has become fundamentally important as large-scale currents of change threaten the health, economy and livability of communities throughout the United States and the world
I-105 Corridor Sustainability Study (CSS)
") I-105 Corridor Sustainability Study (CSS) Metro Streets and Freeways Subcommittee March 21, 2019 Gary Hamrick Cambridge Systematics, Inc. I-105 CSS Project History & Background Funded by Caltrans Sustainable
I-105 Corridor Sustainability Study (CSS) Metro Streets and Freeways Subcommittee March 21, 2019 Gary Hamrick Cambridge Systematics, Inc. I-105 CSS Project History & Background Funded by Caltrans Sustainable
Exhibit 1 PLANNING COMMISSION AGENDA ITEM
 Exhibit 1 PLANNING COMMISSION AGENDA ITEM Project Name: Grand Junction Circulation Plan Grand Junction Complete Streets Policy Applicant: City of Grand Junction Representative: David Thornton Address:
Eastern PA Trail Summit October 1, 2018
 Eastern PA Trail Summit October 1, 2018 WHO WE ARE + WHY + WE RE * HERE * * * * * * Session Goals: Discuss how to coordinate planning and design in small, urbanized towns Consider how to develop alternative
Bicycle and Pedestrian Planning in a Historically Car-Centric Culture: A Focus on Connectivity, Safety, & Accessibility
 Bicycle and Pedestrian Planning in a Historically Car-Centric Culture: A Focus on Connectivity, Safety, & Accessibility Kate Horton and Zylavian Watley Transportation Planners Memphis MPO Date: October
California Public Health Assessment Model (C-PHAM):
:") Summary Report: California Public Health Assessment Model (C-PHAM): Methods, Data & UrbanFootprint Application Prepared for: Technical Advisory Committee Strategic Growth Council & Office of Policy Research
Summary Report: California Public Health Assessment Model (C-PHAM): Methods, Data & UrbanFootprint Application Prepared for: Technical Advisory Committee Strategic Growth Council & Office of Policy Research
Bicycle and Pedestrian Connectivity Study Phase 2
 Connectivity Study Phase 2 Process PROCESS OUTCOMES Phase Prepared By STEP I Public Participation and Outreach 1. RTP Outreach activities, and development of the Bike and Ped Task Force Phase 1 2011 OCPC
GIS Based Data Collection / Network Planning On a City Scale. Healthy Communities Active Transportation Workshop, Cleveland, Ohio May 10, 2011
 The Purpose of GIS Based Network Planning GIS Based Data Collection / Network Planning Healthy Communities Active Transportation Conference Tuesday, May 10, 2011 10:00 AM Norman Cox, LLA, ASLA. Ann Arbor,
City of Novi Non-Motorized Master Plan 2011 Executive Summary
 City of Novi Non-Motorized Master Plan 2011 Executive Summary Prepared by: February 28, 2011 Why Plan? Encouraging healthy, active lifestyles through pathway and sidewalk connectivity has been a focus
Bike Planner Overview
 Bike Planner Overview A Web-based Sketch Planning Tool for Los Angeles County presented by William E. Walter, GISP April 12, 2017 GIS-T Transportation leadership you can trust. Bike Planner Overview Guiding
1. Slide Summary: This course covers methods and best practices used by professional planners, engineers, and consultants/researchers This course
 1 1. Slide Summary: This course covers methods and best practices used by professional planners, engineers, and consultants/researchers This course does not focus on advocacy; rather, it introduces current
DRAFT for a State Policy for Healthy Spaces and Places
 DRAFT for a State Policy for Healthy Spaces and Places 1 DRAFT State Policy for Healthy spaces and Places 1. Purpose To encourage the use and development of land that builds healthy communities through
Active Travel and Exposure to Air Pollution: Implications for Transportation and Land Use Planning
 Active Travel and Exposure to Air Pollution: Implications for Transportation and Land Use Planning Steve Hankey School of Public and International Affairs, Virginia Tech, 140 Otey Street, Blacksburg, VA
The Florida Bicycle and Pedestrian Partnership Council
 The Florida Bicycle and Pedestrian Partnership Council Input to the Update of the Florida Transportation Plan March 2015 This document presents input from the Florida Bicycle and Pedestrian Advisory Council
About the Active Transportation Alliance
 About the Active Transportation Alliance Chicagoland s voice for better biking, walking and transit Founded 1985 7,000 members, ~33 full time staff Serve Chicago metro region 1 More Cars, More Driving
Bicycle and Pedestrian Connectivity Study. Old Colony Planning Council
 Bicycle and Pedestrian Connectivity Study Old Colony Planning Council Outline Why consider bike/peds in road designs? Why are measures needed? Connecting Land Use with Transportation Evaluation Tools:
Incorporating Health in Regional Transportation Planning
 Mayor Karl Dean, Chairman Incorporating Health in Regional Transportation Planning Leslie A. Meehan, AICP Center TRT Intervention Webinar January 29, 2013 Objectives for Today Background About the Nashville
CHAPTER 3: Vision Statement and Goals
 Davidson Walks & Rolls: Active Transportation Master Plan CHAPTER 3 Contents: Overview Vision Statement Measurable Goals Public Outreach CHAPTER 3: Vision Statement and Goals Overview The vision statement
Getting Involved in Transportation Planning
 Photo courtesy of xxx Getting Involved in Transportation Planning An Overview for Public Health Advocates 2 Why should public health professionals be involved in transportation planning? Because the way
Walkable Communities and Adolescent Weight
 Walkable Communities and Adolescent Weight Sandy Slater, PhD Assistant Professor, University of Illinois at Chicago, School of Public Health Research Scientist, UIC Institute for Health Research and Policy
OC Healthy Communities Forum. The proportion of the population that live within a half mile of a major transit access point.
 OC Healthy Communities Forum Transit Access The proportion of the population that live within a half mile of a major transit access point. Use of public transit can result in decreased greenhouse gas emissions
PEDESTRIAN ACTION PLAN
 ATTACHMENT 2 CITY OF SANTA MONICA PEDESTRIAN ACTION PLAN CITY OF SANTA MONICA PEDESTRIAN ACTION PLAN This page intentionally left blank EXECUTIVE SUMMARY CHAPTER 1 EXECUTIVE SUMMARY Setting the Stage
COMPLETE STREETS POLICY Exhibit A to Ordinance
 CITY OF WENATCHEE COMPLETE STREETS POLICY Exhibit A to Ordinance 2016-24 Prepared and Reviewed By: City of Wenatchee Community & Economic Development Department City of Wenatchee Public Works Department
EXECUTIVE SUMMARY November 2016
 EXECUTIVE SUMMARY November 2016 Purpose The New Jersey Bicycle and Pedestrian Master Plan presents a vision, goals, and strategies to achieve a transportation system in which walking and bicycling are
Transportation and Health Tool
 Working together to evolve the Transportation and Health Tool APHA Webinar March 22, 2016 Ann Steedly, PE Overview THT Development Context Development of Indicators Strategies, Interventions & Policies
Motorized Transportation Trips, Employer Sponsored Transit Program and Physical Activity
 Motorized Transportation Trips, Employer Sponsored Transit Program and Physical Activity Ugo Lachapelle Msc. Lawrence D. Frank, PhD Active Living Research Washington, DC April 12, 2008 Outline Background:
4 Ridership Growth Study
 Clause 4 in Report No. 15 of Committee of the Whole was adopted, without amendment, by the Council of The Regional Municipality of York at its meeting held on November 16, 2017. 4 Ridership Growth Study
Proposed. City of Grand Junction Complete Streets Policy. Exhibit 10
 Proposed City of Grand Junction Complete Streets Policy Exhibit 10 1 City of Grand Junction Complete Streets Policy Vision: The Complete Streets Vision is to develop a safe, efficient, and reliable travel
Transportation Master Plan Advisory Task Force
 Transportation Master Plan Advisory Task Force Network Alternatives & Phasing Strategy February 2016 BACKGROUND Table of Contents BACKGROUND Purpose & Introduction 2 Linking the TMP to Key Council Approved
San Mateo County Comprehensive Bicycle and Pedestrian Plan Open House
 San Mateo County Comprehensive Bicycle and Pedestrian Plan Open House October 28, 2010 Presented to San Mateo County residents and interested parties by Lauren Ledbetter, Alta Planning + Design Matt Haynes,
University of Victoria Campus Cycling Plan Terms of Reference. 1.0 Project Description
 University of Victoria Campus Cycling Plan Terms of Reference 1.0 Project Description The Campus Cycling Plan, a first for the University, will provide a comprehensive and coordinated approach to support
Building Health into Communities: A Smart Solution to Public Health Challenges Juan Pablo Reynoso
 1 Building Health into Communities: A Smart Solution to Public Health Challenges Juan Pablo Reynoso I. Introduction Over the past few decades, the United States has seen a dramatic rise in the prevalence
A Holistic Approach to Community Connectivity. 50 th International Making Cities Livable Conference Portland, OR June 2013
 A Holistic Approach to Community Connectivity 50 th International Making Cities Livable Conference Portland, OR June 2013 Founded 2008 About GP RED Research Education Advocacy Focus on Health, Recreation
Cultivating Senior Advocacy for Healthy & Walkable Neighborhoods. Jaime Fearer, AICP Planning & Policy Manager
 Cultivating Senior Advocacy for Healthy & Walkable Neighborhoods Jaime Fearer, AICP Planning & Policy Manager www.californiawalks.org @CaliforniaWalks Presenter Disclosures Jaime Fearer The following personal
Access BART: TOD and Improved Connections. October 29, 2008
 Access BART: TOD and Improved Connections October 29, 2008 1 Access BART Study Goals Evaluate at the system-level land use and access scenarios to optimize ridership Identify station clusters that provide
7 Complete Streets & Roadway Aesthetics
 7 Complete Streets & Roadway Aesthetics 7.1 OVERVIEW Our streets lay the foundation for how we interface with travel needs, physical exercise, social exchanges and access to goods and services. They are
Public Transportation and Bicycle & Pedestrian Stakeholder Webinar. April 11, :30 PM
 Public Transportation and Bicycle & Pedestrian Stakeholder Webinar April 11, 2013 1:30 PM Public Transportation and Bicycle & Pedestrian Webinar April 11, 2013 1:30 PM MULTIMODAL TRANSPORTATION PLAN Vision,
May 12, 2016 Metro Potential Ballot Measure Issue Brief: Local Return
 Summary: Local return is an important revenue source for cities to maintain their local transportation infrastructure. Most cities use their local return to operate small bus systems and repave streets,
Goals, Objectives, and Policies
 Goals, Objectives, and Policies ADVISORY GROUP INPUT PUBLIC INPUT SNS PREVIOUS STUDIES RBPP Goals Vision Statement Southern Nevada will develop a safe, connected, and convenient walking and bicycling system
Kevin Proft NRS 509 Final Project: Written Overview & Annotated Bibliography GIS Applications in Active Transportation Planning
 Kevin Proft NRS 509 Final Project: Written Overview & Annotated Bibliography 12.13.16 GIS Applications in Active Transportation Planning Geographic Information Systems (GIS) play an important role in developing
Capital and Strategic Planning Committee. Item III - B. April 12, WMATA s Transit-Oriented Development Objectives
 Capital and Strategic Planning Committee Item III - B April 12, 2018 WMATA s Transit-Oriented Development Objectives Page 24 of 76 Washington Metropolitan Area Transit Authority Board Action/Information
Incorporating Health in Regional Transportation Planning
 Mayor Karl Dean, Chairman Incorporating Health in Regional Transportation Planning Leslie A. Meehan, AICP Center TRT Intervention Webinar January 29, 2013 Objectives for Today Background About the Nashville
Rolling Out Measures of Non-Motorized Accessibility: What Can We Now Say? Kevin J. Krizek University of Colorado
 Rolling Out Measures of Non-Motorized Accessibility: What Can We Now Say? Kevin J. Krizek University of Colorado www.kevinjkrizek.org Acknowledgements Mike Iacono Ahmed El-Geneidy Chen-Fu Liao Outline
Spatial Patterns / relationships. Model / Predict
 Human Environment Spatial Patterns / relationships Model / Predict 2 3 4 5 6 Comparing Neighborhoods with high Quality of Life & health Overlap matrix NPUs with high NH & NQoL SEC High QoL High Health
Plant City Walk-Bike Plan
 Plant City Walk-Bike Plan Plant City Commute Mode Share 2.2% 1.4% 2.9% Drove alone 10.2% Carpooled Public transportation (0.1%) Walked Used a Bike (0.4%) 82.9% Taxicab, motorcycle, or other means Worked
Travel Behavior of Baby Boomers in Suburban Age Restricted Communities
 Travel Behavior of Baby Boomers in Suburban Age Restricted Communities TRB Conference Impact of Changing Demographics on the Transportation System 27 October 2008 P. Christopher Zegras Frank Hebbert Eran
INNER LOOP EAST. AIA Rochester Annual Meeting November 13, 2013 TRANSFORMATION PROJECT. Bret Garwood, NBD Erik Frisch, DES
 INNER LOOP EAST TRANSFORMATION PROJECT AIA Rochester Annual Meeting November 13, 2013 Bret Garwood, NBD Erik Frisch, DES Why? We are building a city that encourages walking, biking and enjoying the outdoor
Guidelines for Providing Access to Public Transportation Stations APPENDIX C TRANSIT STATION ACCESS PLANNING TOOL INSTRUCTIONS
 APPENDIX C TRANSIT STATION ACCESS PLANNING TOOL INSTRUCTIONS Transit Station Access Planning Tool Instructions Page C-1 Revised Final Report September 2011 TRANSIT STATION ACCESS PLANNING TOOL INSTRUCTIONS
Approaches. Livable Neighborhood Design. Examples. Traditional neighborhood development. CE 594 University of Wisconsin- Milwaukee
 Approaches Livable Neighborhood Design CE 594 University of Wisconsin- Milwaukee Traditional neighborhood design (TND), new urbanism, transit friendly design, transit oriented development and walkable
5. Pedestrian System. Accomplishments Over the Past Five Years
 5. Pedestrian System Accomplishments Over the Past Five Years The Alamo Area Metropolitan Planning Organization (MPO) and its partner agencies recognize the importance of improving pedestrian mobility.