Regional Transportation Authority (RTA) Technical Management Committee
|
|
|
- Gwenda Cory Shepherd
- 6 years ago
- Views:
Transcription
1
2 Regional Transportation Authority (RTA) Technical Management Committee 12:00 p.m., Dec. 1, 2014 Pursuant to A.R.S , notice is hereby given to the public and to the Committee members that the Technical Management Committee (TMC) of the Regional Transportation Authority will have a meeting at the above stated time and location. This meeting is open to the public. The following is an agenda of the matters to be considered, discussed and acted upon. AGENDA 1. Call to Order 2. Approval of May 12, 2014, TMC Meeting Minutes 3. RTA Board Report The RTA Board is comprised of the elected officials of the Cities of Tucson and South Tucson; the Towns of Marana, Oro Valley, and Sahuarita, the Pascua Yaqui Tribe, the Tohono O odham Nation, Pima County and the governor-appointed Pima County representative of the Arizona State Transportation Board. This report will update the TMC members on discussions and actions taken by the RTA Board since the last TMC meeting. 4. RTA Executive Committee Meeting Report The RTA Executive Committee is made up of the RTA Board Chairman, Vice Chair, 2 nd Vice Chair, Preceding Chairman and Executive Director. The Executive Committee met on October 17 to review the planning steps associated with a potential renewal of the RTA Plan and Taxing Authority. 5. RTA TMC Bylaws The RTA TMC has never developed and adopted bylaws. Staff recommends the development of draft bylaws. Action: It is recommended that the TMC direct its policy subcommittee to develop bylaws for consideration by the TMC.
3 6. Broadway Boulevard, Euclid Avenue to Country Club Road Staff will provide a briefing on the Broadway Boulevard project, including expenditures to date and schedule as well as review recent direction from the Tucson City Council with respect to project design. The City of Tucson Mayor and Council have also approved a funding request to continue design of the project, which has been forwarded to the RTA for consideration. Action: The TMC will be asked to make a recommendation to the RTA Board, and possibly identify a TMC member as a liaison between TMC and the Design team. 7. Prequalification of Bidders The Arizona Department of Transportation (ADOT) has a long standing program for the prequalification of bidders on state highway projects. ADOT also now requires that local governments using federal project funds administered by ADOT also prequalify bidders on their federalized projects. The TMC will discuss options for utilizing this practice and hear updates from member agencies. 8. RTA Transit Services Staff will provide a briefing on the status of RTA funded transit services, including the cost of services to date and projected costs. 9. Call to the Audience Speakers are limited to a three-minute oral presentation and may submit written comments of any length for the Committee s files. Those wishing to address the Committee should complete a Citizen Information Card prior to the meeting being called to order, which will specify the topic to be addressed. The Committee will not discuss or take action on a matter raised during a call to the audience that is not already on the agenda. 10. Future Agenda Items Committee members and staff will suggest items for future TMC meetings. 11. Adjournment Two Briefing Packets containing material related to the Meeting are available for public review the day before and the day of the Meeting during office hours at: 1 E. Broadway Blvd. Ste. 401, Tucson, Arizona (520) The Briefing Packets are also available for public review at the Meeting. The Meeting Room is accessible to persons with disabilities. In compliance with the Americans with Disabilities Act (ADA), those requiring special assistance, such as large-type face print, sign language or other reasonable accommodations, may request those through the administrative offices at: 1 E. Broadway Blvd. Ste. 401, Tucson, Arizona (520) , at least twenty-four hours before the meeting. Si necesita ayuda con traducción, llame por favor al y comuníquese con Nathan Barrett.
4 177 N. Church Avenue, Suite 405, Tucson AZ Phone: (520) Fax: (520) RTAmobility.com Regional Transportation Authority Technical Management Committee Minutes of May 12, 2014, Meeting Committee Members Present Bob Iannarino, PSOMAS Chuck Huckelberry, Pima County, Chair Daryl Cole, City of Tucson Frank Thomson, Thomson Associates Jim Schoen, Kittelson & Associates John Bernal, Pima County Jose Rodriguez, Town of Oro Valley Keith Brann, Town of Marana Marcelino Flores, Pascua Yaqui Tribe Roger Caldwell, Retired, UA Sheila Bowen, Town of Sahuarita William Carroll, Engineering and Environmental Consultants Inc. Staff Cherie Campbell Farhad Moghimi Jeff Hildebrand Jeremy Papuga Jim DeGrood Rob Samuelsen Rosie Soto Sheila Storm Public/Agencies/Others Greg Clark, Jeff Stine, EPS Group Inc. Jonathan Crowe, Pima County Michael Farley, Manager of Valencia/Kolb Properties Mitch Stallard, Priscilla Cornelio, Pima County Ryan Anderson, City of Tucson 1. Call to Order and Introductions The meeting was called to order by Chuck Huckelberry at 12:00 p.m. 2. Approval of Jan. 16, 2014, TMC Meeting Minutes Motion was made by Jim Schoen to approve the minutes of Jan. 16, 2014, seconded by Daryl Cole and were- approved unanimously. 3. Announcements Jim DeGrood announced that the next RTA Board meeting is scheduled for May 22. Revenue service for the Modern Streetcar will start on July 25. Festivities are planned for the Streetcar ribbon-cutting along with 3 free service days on the Sun Link for the first weekend of service. Jim DeGrood stated that there s a request to move the Valencia Road, Wilmot to Kolb discussion to the end of the agenda.
5 4. RTA Board Report Farhad Moghimi reported that the RTA Board met last month and items discussed were regarding another round of bonding. Board members questioned how high of a range could be anticipated. The range is between $125 million and $175 million. More information will be provided later on the agenda. At the next Board meeting, staff is hoping to get approval to proceed and sell the bonds by June or July. Chuck Huckelberry stated that Item 5 will be moved to the end of the agenda. 5. Valencia Road, Wilmot Road to Kolb Road Chuck Huckelberry asked Vice Chair, Daryl Cole to cover item 5 to prevent potential legal issues between Pima County and Mr. Farley. Mike Farley addressed the TMC regarding the Valencia/Kolb alignment. Mike referred to the 2- page handout he provided which contains financial information on Options 1 and 2. Jim DeGrood gave a Valencia Road, Wilmot to Kolb presentation. Items reviewed: What has happened since the last time we met? Valencia Road Alignment Alternatives Comparison of Alignment Alternatives Valencia Kolb Intersection Flyover Alternative Summary Recommendation/Direction If you would like a copy of the presentation, please contact Rosie Soto at or RSoto@PAGregion.com. Group discussion included questions regarding the proposed number of lanes on Valencia Road, communication with property owners on the west side of the road, Neighborhood Advisory Committee meetings, ideas about a future grade separation and concern was expressed regarding steering away from what is in the ballot. 6. RTA Financial Update Jim DeGrood gave an RTA Financial Update presentation. Items reviewed: RTA Monthly Transaction Privilege Tax (TPT) Receipts Monthly Revenue Trends (YoY) RTA Fund Balance Series 2014 Bond Activities Fiscal Year 2015 Proposed Budget (000 s) If you would like a copy of the presentation, please contact Rosie Soto at or RSoto@PAGregion.com. Group discussion included questions about the percentage of decline arising from the government shut-down and the 1-year enhanced subsidy of $800,000 for the operation of the Streetcar. 7. Transit Update
6 Jeremy Papuga gave a Transit Update presentation. Items reviewed: Overview of COA Components Route Change Recommendations Overview of Immediate Changes TWG Review of Proposed Changes Working Group Concerns Next Steps If you would like a copy of the presentation, please contact Rosie Soto at or RSoto@PAGregion.com. Group discussion included questions regarding how the $2.4 million total savings of the system is calculated; and, if route mileage is decreased/removed, how will the special needs service area be impacted. 8. Call to the Audience Greg Clark addressed the TMC regarding RTA Project #17, Broadway widening and the City of Tucson Citizens Task Force. The interest of the greater public needs to be looked at not just a couple of neighborhoods. 9. Future Agenda Items None. 10. Adjournment The meeting adjourned at 1:05 p.m.
7
8
9
10
11
12
13
14


15 Broadway Project Update Presentation RTA CART Committee November 4, 2014

16 COUNTRY CLUB ROAD EUCLID AVENUE HIGHLAND AVENUE CAMPBELL AVENUE TUCSON BOULEVARD Broadway Boulevard Project Area
17 Parameters re: Broadway March 2012 M&C requests hold on acquisitions/demos June 14, 2012 RTA Board discusses No Diminishment of Functionality in relationship to modifications June 19, 2012 M&C empowered CTF to use creative design Sept. 19, 2012 M&C directed CTF to use U.S. EPA s Guide to Sustainable Transportation Perf. Measures Dec. 18, 2012 M&C strongly encourages staff to communicate to CTF and community that alternatives to the scope will be reviewed and can be built Oct. 10, 2013 Pima Co. emphasizes the 1997 Bond project funding is for a 6- or 8- lane project; supports position that less than 6- or status quo will not be funded


18 Broadway Citizens Task Force
19 Citizens Task Force Majority- Supported Recommendations of 13 CTF members support progressing the Preferred 6-Lane including Transit Alignment 2. The Preferred 6-Lane Including Transit Alignment and project design should support transit improvements on Broadway 3. Develop recommendations to address issues that have surfaced, particularly to encourage economic vitality and sense of place
20 Quote from Majority Report, Page 2. Any of our 6-lane configurations will result in exceedingly similar potential for acquisitions. Therefore [at this point] the Citizens Task Force is focusing less on the roadway width and more on innovative solutions, such as those that accommodate our local transit priority, bike and pedestrian safety, and economic vitality. The roadway width will flex throughout the project area as is reasonable. As design of the 6-Lane Including Transit Alignment progresses, every opportunity should be taken to achieve all of the following, to the extent possible: avoid impacting historic buildings or parking ensure adequate space to support all modes safely preserve enough dirt for future mass transit.


21 Protected Bike Lane at Bus Stop Concept At Curb No Bus Pullout With Bus Pullout


22 Protected Bike Lane at Bus Stop Concept At Curb No Bus Pullout


23 Mayor & Council Action on Oct. 9, 2014

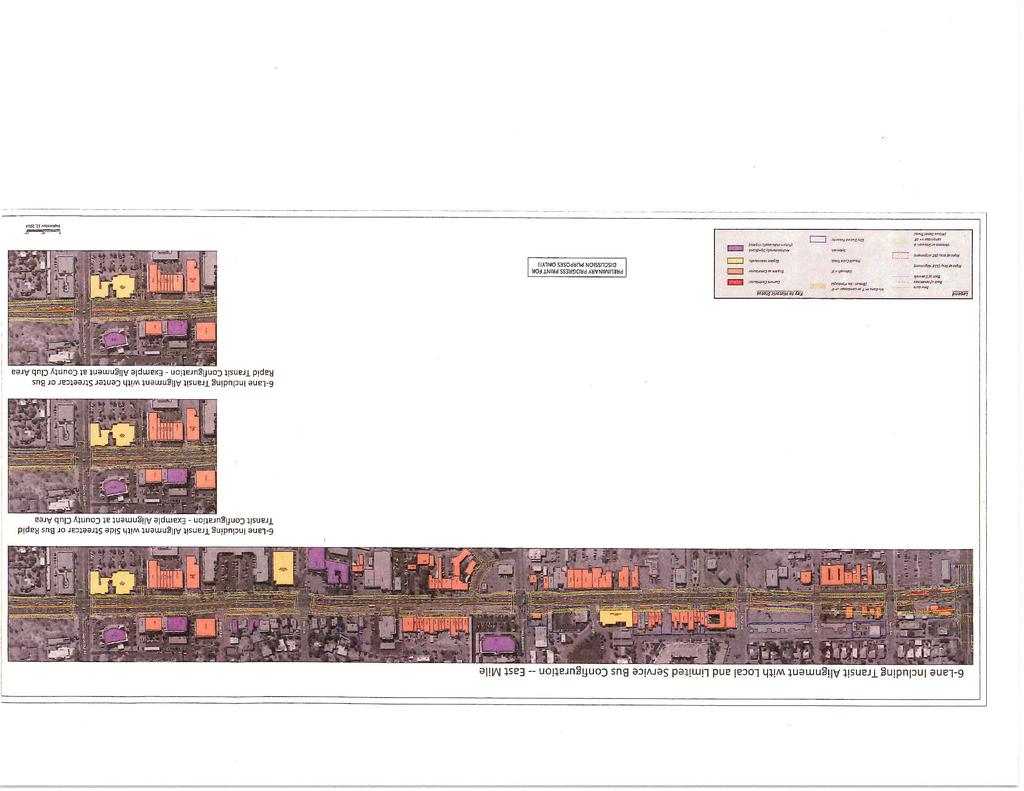
24 6-Lane Including Transit General Alignment INSERT IMAGES

25 Next Steps Funding approvals to complete design and begin some real estate planning tasks Technical design process underway: More Technical Advisory Committee involvement Engineering, hydrology, utilities, real estate considerations will augment design work Conceptual Alignment to be refined, using CTF and TAC recommendations and technical information Task Force meetings convened at important strategic design milestones
26 Thank you for the opportunity to provide you with this update! Broadway: Euclid to Country Club Web: Info Line: RTA Plan
27
28

29
30
31
32

33
34
35
36
37
38
39
40
41
42
43
44
45
46
47
48
49
50
51
52
53
54
55

56 October 30, 2014 Jim DeGrood, Transportation Services Director Regional Transportation Authority CITY OF TUCSON DEPARTMENT OF TRANSPORTATION Dear Jim: Based on Mr. Poorten s request, please find below information about the Broadway Project expenditures to date, categorized by major expense category. Expense Summary July 2006-Present As of October 22, 2014, the City of Tucson has spent $7,329,714, in the following categories for the Regional Transportation Authority (RTA) Plan Project #17 Broadway: Euclid to Country Club: Project Expense Category Total Amount Project Management (Staff) $ 432,069 Planning, Design & Engineering (Consultants, meeting costs, materials, etc.) 2,738,469 Right-of-Way* (Acquisition, Property Management, Utilities, Environmental Costs) 4,165,536 Total $ 7,329,714 *This amount does not include acquisition expenses for an additional 21 taxpayer parcels that the City purchased prior to the RTA Project #17 budget was created, totaling approximately $4,121,523. These expenses pre-date the cost-sharing commitments for the RTA Project #17 budget. The Regional Transportation Authority (RTA) Plan Project #17 Broadway: Euclid to Country Club has the following budget: Funding Agency/Source Total Amount % RTA / Roadway Element $ 42,125, % City of Tucson / Development Impact Fees 3,000, % Pima County/ 1997 Transportation Bonds 25,000, % Pima Assoc. of Governments/ Regional Funds 1,222, % Total $71,347, % Please let me know if I can be of further assistance. Sincerely, Jennifer Toothaker Burdick Project Manager

57
58

59
60

61

62
63

64
65

66
67
68
69 SUMMARY OF THE TRAFFIC ANALYSIS BROADWAY CORRIDOR, EUCLID AVENUE TO COUNTRY CLUB ROAD AUGUST 30, 2012 Overview In the lead up to the task of determining a general corridor development approach for Broadway, a considerable amount of technical data has been gathered and developed to help inform the process. This includes information regarding existing land use and urban form, surveys of historic and architectural resources, topographic mapping, and traffic information. This information will be presented to the CTF and the public over the next several months. This document summarizes the traffic information presented at the August 30th CTF meeting. Please note that the work reported here is an ongoing effort and will be refined and extended during the DCR process as the need arises. The traffic study prepared for this project provides initial information regarding how various roadway configurations can be expected to function over the design life of this project. The study is presented in the document "Final Traffic Engineering Study, Broadway Corridor Study Euclid Avenue to Country Club Road" by Kittelson & Associates, December That study addresses the full range of transportation modes applicable to Broadway -- pedestrian, bicycle, and transit as well as general arterial traffic. Kittelson's study focused on two typical roadway cross sections. The first is referred to here as the eight-lane section which entails six general purpose lanes (three each direction) and two multiuse lanes dedicated to transit and right turning vehicles. The second section, referred to as the six-lane section, has only the six general purpose lanes. With the six-lane section, separate right turn lanes and bus pull through or pullouts would be needed at major intersections. Separate bikes lanes would be provided with both sections though with the eight-lane section bikes may share the multiuse lanes as currently the case from Columbus eastward. Current regional planning calls for the eight-lane section. That section is also specified in the voter-approved RTA plan. Questions have been raised as to the need for eight lanes however, and Kittelson has included an evaluation of the operational effects of eliminating the multiuse lanes. That evaluation required "micro simulation" modeling, a more sophisticated analysis than normally applied to arterial roadway development. Generally, Kittelson found that both the six-lane and eight-lane sections will operate satisfactorily through the year They also found that the effect of eliminating the multiuse lanes on general arterial traffic is nearly negligible in terms of average delay per vehicle, average number of stops per vehicle, and average speed. The greatest impact was a 6% increase in eastbound travel time during the afternoon peak hour. A greater impact would be felt by transit however for which the level of service would be reduced by 6% to 15% depending on the metric being used. Kittelson points out that beyond simply traffic operation, several other issues also need to be considered. One is safety, particularly the increased frequency of rear-end crashes associated with right turning vehicles slowing in the outer travel lane. Another is the safe and convenient access to businesses needed for a thriving commercial corridor. And with the multiuse lanes, the conflict between bicycles and right-turning vehicles crossing the bike lane is reduced. The broader question of to what extent the corridor development should be designed to accommodate short and long-term transit is also a consideration, perhaps an overriding one. Broadway has been identified as one of two regional high capacity transit corridors. It is well suited for transit given the major activity centers is serves -- downtown Tucson, the University of Arizona, El Con Mall, Williams Center, and Park Mall. Sun Tran Route 8, which extends along Broadway from downtown as far eastward as Harrison Road, has in excess of 10,000 riders per weekday, by far the greatest in the region. PAG is currently developing for bus rapid transit (BRT) plan for Broadway. 1 of 15
70 Kittelson more recently performed a follow-up analysis of a four-lane section. That analysis, as with those noted above, was based on PAG's projected year 2040 volumes which are being used for this project (the "project volumes"). The four lane scenario falls well short of achieving an acceptable level of service. A second analysis, using volumes based on lower projected growth, also failed but not to the same degree. The remainder of this document discusses these and other topics in more detail. Its purpose is to help clarify and explain the content of the traffic report, and to make its information accessible to participants in the upcoming discussion of how the corridor should look and function for the future. Updated Traffic Study Kittelson's report cited above is an update of the original report they prepared in The updated report incorporated these changes: (1) 2040 PAG traffic projections were used instead of the 2030 values originally used. The 2040 values weren't available at the time of the initial study; (2) More recent traffic counts were used to reflect existing conditions. For Broadway, that means 2010 actual counts were used instead of the 2008 counts used before; (3) The micro-simulation analysis of the operational implications of eliminating the multiuse lanes was added. Figure 1 compares the PAG existing and projected traffic volumes used by the two reports. As noted in the following section, the values used for traffic analysis here are adjusted to better reflect conditions in the immediate area. The operational analysis of the six and eight-lane sections is described in a separate section later. Figure 1-- Comparison of current and projected PAG ADT's between the 2009 to 2012 traffic reports Broadway Blvd From Original From Updated Change in Change in ADT 2009 Report 2011 Report "Existing ADT" from 2030 to 2040 Existing Base 2030 Existing Base 2040 Annual Annual ADT Year ADT ADT Year ADT Change Rate Change Rate West of Euclid 30, ,000 35, ,000 5, % -2, % Euclid to Highland 30, ,000 34, ,000 4, % 6, % Highland to Campbell 30, ,400 34, ,000 4, % 1, % Campbell to Tucson Blvd 37, ,000 40, ,000 2, % 13, % Tucson Blvd to Country Club 37, ,700 40, ,000 2, % -2, % East of Country Club 41, ,800 41, , , % Euclid Avenue North of Broadway 30, ,800 24, ,000-6, % 5, % South of Broadway 22, ,100 18, ,000-4, % 2, % Highland Ave North of Broadway 5, ,400 5, , , % South of Broadway n/a n/a n/a 7, n/a Campbell Ave North of Broadway 40, ,700 45, ,000 4, % 5, % South of Broadway 41, ,900 34, ,000-7, % 18, % Tucson Blvd North of Broadway 12, ,700 12, , % South of Broadway 11, ,400 11, , % Country Club Road North of Broadway 22, ,400 20, ,000-2, % -5, % South of Broadway 16, ,200 17, , % -3, % Notes: 1. ADT -- Average Daily Traffic is traffic volume in vehicles per day. Values shown are from PAG regional modeling. 2. Existing ADT is based on traffic counts taken in the "Base Year" indicated. 2 of 15
71 Historic Cross Town Traffic Volumes PAG maintains annual records of average daily traffic counts on the roadway network. Figure 2 indicates historic volumes on three major east-west arterials. The data indicate that volumes on Broadway have dropped somewhat from the historic highs of around 45,000 vehicles per day, coinciding with the current recession. It is reasonable to assume that volumes will again increase as economic conditions improve. Figure 2 -- Historic Volumes on East-West Arterials Daily Traffic Counts (x103) Broadway Blvd. Speedway Blvd. 22nd St Year 3 of 15
72 Projected Traffic Volumes Projected traffic volumes for existing conditions and 2040 are shown in Figure 3. Existing ADT (average daily trips) and the PAG 2040 projections are as noted in Figure 1. For the "Project Volumes" used here, the PAG volumes have been adjusted based on a more detailed assessment of probable development, volumes on adjacent segments, and the volumes the various cross streets are able to deliver to the intersection. This information is summarized in Figure 3. The "Low Growth Rate" volumes used for the four-lane evaluation mentioned above are also shown. They assume the growth in traffic volume to be only two-thirds of that predicted by PAG. Figure 3 indicates a rate of growth in project volumes for Broadway ranging from 0.4% to 1.3%, and the lower growth rate volumes from 0.2% to 1.7%. It is noted that the rate of increase between 2008 and 2010 based on actual counts increased from 3.6% to 8.3%. Figure 3 -- Summary of Peak Hour Volumes and Growth Rates Broadway Blvd PAG Projections Project Volumes Low Growth Rate Projected Projected Projected Existing 2040 Growth 2040 Growth 2040 Growth ADT ADT Change Rate ADT Change Rate ADT Change Rate West of Euclid 35,000 33,000-2, % 39,000 4, % 37,000 2, % Euclid to Highland 34,000 41,000 7, % 41,000 7, % 37,500 3, % Highland to Campbell 34,000 46,000 12, % 46,000 12, % 40,000 6, % Campbell to Tucson Blvd 40,000 56,000 16, % 56,000 16, % 48,000 8, % Tucson Blvd to Country Club 40,000 46,000 6, % 47,000 7, % 43,500 3, % Euclid Avenue Highland Ave Campbell Ave Tucson Blvd Country Club Road East of Country Club 41,000 53,000 12, % 53,000 12, % 47,000 6, % North of Broadway 24,000 46,000 22, % 36,000 12, % 30,000 6, % South of Broadway 18,000 44,000 26, % 29,000 11, % 23,500 5, % North of Broadway 5,000 17,000 12, % 9,000 4, % 7,000 2, % South of Broadway 7,000 n/a n/a n/a 10,000 3, % 8,500 1, % North of Broadway 45,000 55,000 10, % 54,000 9, % 49,500 4, % South of Broadway 34,000 70,000 36, % 56,000 22, % 45,000 11, % North of Broadway 12,000 12, % 15,000 3, % 13,500 1, % South of Broadway 11,000 12,000 1, % 14,000 3, % 12,500 1, % North of Broadway 20,000 26,000 6, % 31,000 11, % 25,500 5, % South of Broadway 17,000 22,000 5, % 25,000 8, % 21,000 4, % Notes: "Growth Rate" based on equal annual increments over a 30-year period except for the change in current ADT where the difference in base years is taken to be the period. 4 of 15
73 Level of Service Traffic engineers use "Level of Service" or "LOS" to measure the operational effectiveness of various transportation modes. LOS is rated by the letters "A" through "F" with "A" being the best and "F" the worst. Figure 4 describing level of service for classic vehicular travel provides a sense of how this concept works. Figure 4 -- Description of Level of Service for General Traffic Flow LOS A General Character of Operation Traffic flows freely with vehicles moving at or above the posted speed limit. Drivers are easily able to change lanes. Typical Vehicle Spacing AASHTO Description 27 car lengths Free flow B C D E Traffic flows reasonably freely at or above the speed limit but the ability to change lanes is slightly restricted. Traffic operates at or near free-flow conditions though the ability to change lanes is noticeably restricted and requires greater attention. Drivers are generally comfortable, and the posted speed is maintained. The roadway operates near but safely below capacity. This is the targeted LOS for some urban and most rural highways. Traffic operates at decreasing free-flow levels. Speeds decrease as the traffic volume slightly increases. The ability to maneuver in traffic stream is much more limited and driver comfort levels decrease. This LOS is a common design standard for urban streets during peak hours, and the typical standard applied by the City of Tucson. Traffic volume exceeds the capacity of the roadway and flow becomes irregular. Speeds rarely reach the posted limit and vary rapidly as there are virtually no usable gaps to maneuver within the traffic stream. Any disruption to traffic flow, such as merging ramp traffic or lane changes, will create a shock wave affecting traffic upstream. LOS E is a common standard in larger urban areas where some roadway congestion is inevitable. 16 car lengths Reasonably free flow 11 car lengths Stable flow 8 car lengths Approaching unstable flow 6 car lengths Unstable flow F Traffic flow breaks down. Frequent slowing and stopping occurs. This is essentially a traffic jam with vehicles able to move only in lockstep with those in front of them. n/a Forced or breakdown flow Different transportation elements have different ways of defining level of service. For signalized intersections, LOS is defined in terms of average delay as indicated in Figure 5. For urban arterials such as Broadway, signalized intersections generally control the flow of traffic and the roadway operation. For this project, Kittelson determined LOS for each approach and movement as well as the overall operation of each intersection. Other criteria apply for unsignalized intersections though those are also based on average delay. Level of service for general arterial traffic is measured by the average speed including the effects of delay at signalized intersections, pedestrian crossings, side streets, and driveways. That definition is also provided in Figure 5. Levels of service are also defined for pedestrians, bicyclists, and transit users are determined utilizing a scoring methodology that considers such parameters as user comfort, access to the facility, and perception of the facility. For instance, bicycle LOS considers bike lane width, number of driveways and side streets, speed of traffic, presence of parked cars, and other factors. For traffic flow, LOS D is the target of performance commonly used by transportation agencies including the City of Tucson. LOS E is also accepted by some transportation agencies in more mixed use urbanized parts of their communities and in transit corridors. The City will accept LOS E if LOS D cannot be reasonably attained. Ion any case, LOS E can be considered the threshold of acceptable performance. 5 of 15 Figure 5 -- LOS Definitions for Vehicular Traffic Signalized Intersections Arterial Traffic Average Average Delay Speed LOS (Sec) LOS (mph) A <= 10 A > 30 B > B > C > C > D > D > E > E >10-14 F > 80 F < =10
74 Existing Traffic Operation Kittelson evaluated the levels of service for the signalized intersections based on detailed traffic counts taken in 2010 during the morning (AM) and evening (PM) peak travel periods. The LOS was determined based on the delay definitions just described. The resulting levels of service as well as the delays in seconds (shown in parenthesis) are providing in Figure 6. These levels of service apply to the "overall intersection" as they are based on the average delay of all heciles entering during the hour in question. All signalized intersections currently operate at LOS D or better. The LOS of particular movements, eastbound left turns for example, can be much greater as discussed below. Figure 6 -- Existing Intersection Operation Figure 7 -- Current Pedestrian Volumes AM Peak PM Peak LOS (Delay) LOS (Delay) Euclid Avenue D (45) C (32) Highland Avenue B (11) A (8) Campbell Avenue D (48) D (45) Tucson Boulevard C (21) C (24) Country Club Road C (34) D (42) The overall operation of Broadway was also determined. Average travel speed between Euclid Avenue and Country Club Road in the peak direction of travel was measured at approximately 25 mph during both the morning and evening periods. While this travel speed reflects LOS B operations, it does not account for the additional delay created by the four signalized pedestrian crossings which are randomly activated. Not only do these signalized crossings create significant delay and queuing, particularly during peak traffic periods, but they also disrupt traffic progression through the signalized intersections which are coordinated to optimize traffic flow. Existing Pedestrian Activity Pedestrian counts were taken at the four existing signalized pedestrian crossing at Park, Cheerry, Norris, and Plumer, and at the currently unsignalized crossting at Treat. The signalized crossings are pedestrian-activated installations known as HAWKS. Figure 7 shows both the number of pedestrians crossing and the number of signal activations. Peak pedestrian hours do not correspond to peak hours for traffic. Hourly volumes for both are shown in Figure 7 along with the peak hour of pedestrian crossings. The current HAWK crossings are "single phase" where both directions of Broadway traffic are crossed under a single activation. That halts traffic in both directions for an extended period to allow pedestrians to cross the entire roadway. Kittelson recommends that the new crossings be two-phase, that is the crossing of each direction will be done independently under separate activations. Two-phased crossing can be incorporated into the general signal phasing scheme, improving the overall level of service. Existing Bicycle Activity 2011 Pedestrian Volumes (Signal Activations) During Peak Traffic Hours on Broadway Peak Pedestrian Location AM PM Crossing Activity Park Ave (HAWK) 22 (18) 11 (9) 41 (15); 9:15-10:15 AM Cherry Ave (HAWK) 19 (11) 14 (12) 21 (9); 7:45-8:45 Norris Ave (HAWK) 3 (3) 6 (5) 15 (9); 3:15-4:15 PM Plumer Ave (HAWK) 17 (12) 14 (13) 27 (12); 3:15-4:15 PM Treat (marked crosswalk) 1 (NA) 1 (NA) 6 (NA); 9:45-10:45 Fewer than 10 bicycles on Broadway Boulevard were counted during the PM peak period (4:00-6:00 pm) at Norris Avenue. That is a reflection of the poor bicycle environment that currently exists. Existing Bicycle Activity Fewer than 10 bicycles on Broadway Boulevard were counted during the PM peak period (4:00-6:00 pm) at Norris Avenue. That is a reflection of the poor bicycle environment that currently exists. 6 of 15
75 Existing Transit Transit service along Broadway on the other hand is a major component of travel within the existing corridor. Sun Tran Route 8, which serves Broadway, carried 3.1 million passengers in the twelve months ending June 30, That is the busiest route in Tucson and 67% greater than the second busiest, Route 16 serving 12th Avenue and Oracle Road. It far exceeds ridership of other east-west corridors, being twice that of Speedway Boulevard and four times that of Grant Road. Had all of the Sun Tran passengers on Broadway instead driven individually to their destinations, over 49 million more vehicle-miles would have been driven on Broadway or roadways. Transit is clearly an important part of the Broadway transportation picture. Existing Multimodal Level of Service Figure 8 shows the existing levels of service determined for transit, bikes and pedestrians. The poor score for bicycle is attributable to the volume of traffic in the adjacent travel lanes and the frequency of driveways and side streets. There are approximately 100 driveways and side streets each side of Broadway over the two-mile project length. Figure 8 -- Existing Multimodal LOS Transit Bicycle Pedestrian Score LOS A E C Crash History Crash data for the 3-year period from January 1, 2008 to December 31, 2010 is summarized in Figure 9. During this 3- year period a total 434 crashes occurred along this section of Broadway Boulevard. No fatalities occurred during this period. The roadway segment between Campbell Avenue and Tucson Boulevard experienced the highest number of crashes. Rear-end crashes tend to be the most common on roadways with a high number of driveways and side streets, and at intersections that are congested. Figure 9 -- Summary of Crash Data Signalized Intersections Euclid Highland Campbell Tucson Country Avenue Avenue Avenue Boulevard Club Road Total Angle 5 7% 1 8% 12 12% 2 4% 5 7% Rear-End 16 24% 3 25% 41 41% 17 33% 24 34% Turning 13 19% 3 25% 20 20% 10 20% 11 16% Other 33 49% 5 42% 28 28% 22 43% 30 43% Roadway Segments Euclid to Highland to Campbell to Tucson Tucson Blvd to Highland (0.5 mi) Campbell (0.4 mi) Blvd (0.5 mi) Country Club (0.5 mi) Total Angle 1 4% 1 4% 3 5% 0 0% Rear-End 8 30% 9 35% 33 56% 15 71% Turning 4 15% 9 35% 11 19% 0 0% Other 14 52% 7 27% 12 20% 6 29% 7 of 15
76 Projected Lane Requirements Using the Project Volumes of Figure 3, Kittelson determined recommended lane configurations at each intersection. A target level of service D was used in accordance with City standards and well-established industry practice. The recommended number of lanes for through, left turn, and right turn movements are provided in Figure 10. Also shown is the existing number of each movement for comparison. Values shown in red indicate an increase over existing conditions. Key findings are as follows: -- The most obvious change is the addition of third travel lanes in both directions of Broadway. -- Double lefts are called for in all directions at the major intersections -- Euclid, Campbell, and Country Club. -- Exclusive right turn lanes are needed in the westbound direction at Campbell, the eastbound and westbound directions at Tucson Boulevard, and in all directions at Country Club. Exclusive right turn lanes on Broadway would be automatically addressed with the eightlane section but would be provided as separate lanes if not. Except for the alternate Country Club intersection, the recommended lane configuration achieves overall intersection levels of service of D or better. Two configurations have been evaluated for the Country Club intersection. The "recommended" configuration includes double left and exclusive right turn lanes in each direction described above. It is anticipated that the proximity of sensitive structures (notably Broadway Village and Chase Bank) will make providing this recommendation difficult. An "alternate" configuration, consisting of single left turn lanes each direction and an exclusive right lane in only the westbound direction, has also been analyzed to provide some sense of the operational effects of providing a lesser configuration. It can be seen in Figure 10 that the alternate configuration would drop the overall intersection LOS from C for both AM and PM peak hours to D and E respectively. While LOS E is not desirable, it may be considered acceptable in light of the implications of the wider section. These lane configurations are shown schematically in Attachment A. Both the sixlane and eight lane sections are indicated with the multiuse lanes being dashed. Other information depicted in Attachment A is described later. Figure 10. Existing and Recommended Lane Configurations Existing 2040 TH or AM/PM TH or AM/PM Intersection LT TH/RT RT LOS LT TH/RT RT LOS Euclid Ave Park Ave Highland Ave Cherry Ave Campbell Ave Norris Ave Plumer Ave Tucson Blvd Treat Ave Country Club Country Club Alt EB,WB D / C C / C SB,NB EB,WB 1 2 1,0 B / A A / A SB,NB EB,WB B / A B / A SB,NB EB,WB B / B A / A SB,NB EB,WB 1 2 1,0 D / D D / D SB,NB EB,WB A / C A / A SB,NB EB,WB B / B A / A SB,NB EB,WB C / C B / C SB,NB EB,WB B / C A / B SB,NB EB,WB 1 3,2 0,1 C / D C / C SB,NB 1 2 0, EB,WB 1 3,2 0, ,1 D / E SB,NB 1 2 0, of 15
77 Signalized Intersection Analysis The five intersections to be signalized are at Euclid Avenue, Highland Avenue, Campbell Avenue, Tucson Boulevard, and Country Club Road. A narrower "alternate" Country Club intersection was also included in this analysis in anticipation of difficulty in fitting the wider roadway section between Chase Bank and Broadway Village without seriously impacting one or the other. That information will be useful in evaluating alternative configurations for the Country Club intersection in a later study. The delay for various movements at each intersection was determined using procedures documented in the Transportation Research Board's Highway Capacity Manual 2010 (HCM2010). Since delay is a function of the number and types of lanes, a trial-and-error approach is needed to determine a lane configuration that achieves the target level of service. The target level of service D has been used to determine lane requirements with the understanding that LOS E may be permissible in certain conditions. Kittelson used the software package Synchro to perform the calculations. Evaluations for six and four-lane configurations were performed using the standard project volumes. As discussed above, the four-lane configuration was also evaluated using the low growth projections. Morning (AM) and afternoon (PM) peak hour volumes were both evaluated. The delays determined along with corresponding levels of service (seconds per vehicle) for each movement are tabulated in Attachment B. Also shown are the average delay of the "overall intersection" (that is the average delay of all vehicles entering the intersection) and of the "worst movement"--that is the greatest delay among the individual movements. Overall intersection delay is the normal design standard. Worst movements are shown here to indicate the degree to which the delay for particular movements will exceed that of the overall intersection. That information is used to determine the storage lengths needed for exclusive right and left turn lanes. These results are tabulated in Figure 11 for morning (AM) and afternoon (PM) peak hours. Values with LOS E and F are shown in blue and red respectively. It can be seen that the six-lane section generally will perform as intended, operating at LOS D or better for overall intersection performance. The only exception is the alternative Country Club intersection which will drop to LOS E during the peak afternoon hour. The southbound left turn movements at Campbell will equal or exceed the LOS F criterion during both the morning and afternoon peak hours. Figure 11. Summary of AM and PM Peak Hour "Overall Intersection" and" Worst Movement" Levels of Service 9 of 15 Six Lane Section, Project Traffic Volumes Intersection Overall Worst Movement AM PM AM PM Euclid Ave C(34) C(32) D(46) SB LT D(46) WB LT Highland Ave B(13) A(9) D(48) SB LT D(38) SB LT Campbell Ave D(46) D(54) F(115) SB LT F(104) SB LT Tucson Blvd B(18) C(22) D(47) NB TH D(52) NB LT County Club C(23) C(30) D(38) SB LT E(70) SB LT County Club Alt D(42) E(74) D(53) WB TH F(221) WB LT Four Lane Section, Project Traffic Volumes Euclid Ave Intersection Overall Worst Movement AM PM AM PM F(126) WB E(64) D(42) TH E(63) EB TH Highland Ave B(17) B(12) E(61) SB LT D(44) SB LT F(254) WB Campbell Ave F(93) F(104) TH F(253) EB TH Tucson Blvd D(41) E(56) E(59) WB TH F(95) EB TH County Club C(35) E(69) E(61) WB TH F(138) EB TH County Club Alt D(41) F(106) F(150) EB LT F(389) EB LT Four Lane Section, Reduced Traffic Volumes Intersection Overall Worst Movement AM PM AM PM Euclid Ave D(45) D(37) F(83) WB TH D(54) WB LT Highland Ave B(14) B(11) D(48) NB LT D(45) SB LT F(200) WB Campbell Ave E(70) F(93) TH F(244) EB TH Tucson Blvd C(26) D(46) D(50) NB TH E(76) EB TH County Club C(28) E(64) D(40) WB TH F(132) EB TH County Club Alt C(32) F(92) F(122) EB LT F(374) EB LT
78 The four-lane section using project volumes does not fair as well. All of the intersections except Highland would exceed the LOS E threshold during either the morning or afternoon peak hours. The Campbell Avenue intersection would experience LOS F during both peak hours. The average delay for eastbound traffic at Campbell would exceed four minutes. Applying the lower growth projected volumes to the four-lane section improves the situation though significant delays would still be experienced. It would be difficult to technically justify the use of the lower volumes even if they did result in the roadway operating acceptably. The results are also plotted as bar graphs in Attachment B to better visualize the results. The lowest horizontal gridline corresponds to LOS E (55 second delay) threshold, the lowest acceptable level of service for arterial roadways discussed previously. Each successive gridline is a multiple of that threshold. Two clusters for each intersection bundle the six-lane section, the four-lane section, and the four-lane section with lower growth traffic volumes for easy visual comparison. The clusters to the left represent overall intersection operation while that to the right reflects the worst movement. Those plots are also summarized here in Figure 12 for convenience. 10 of 15
79 Figure 12. Summary of Intersection Operation over the Project Length AM Peak Lane 4-Lane 4-Lane Low Growth Average Delay (seconds) LOS "E" 55 0 Euclid Ave Highland Ave Campbell Ave Tucson Blvd Country Club County Club Alt PM Peak Lane 4-Lane 4-Lane Low Growth Average Delay (seconds) LOS "E" 55 0 Euclid Ave Highland Ave Campbell Ave Tucson Blvd Country Club County Club Alt Notes: 1. Lowest grid line (average delay of 55 seconds) reflects Level of Service (LOS) "E", the lowest acceptable threshold of intersection operation. Each subsequent grid line is a multiple of LOS E. 2. For each intersection, the grouping of bars on the left side reflects the overall intersection performance which is the normal standard for design. That to the right represents the "worst movement" indicating the delay that could be experienced with 11 of 15
80 Other Measures of Operational Effectiveness The ability of the roadway to handle a particular volume of traffic can also be measured in other ways such as the time required to traverse a particular reach of roadway or particularly average speed, a measure that drivers can better relate to. The Synchro analysis also provides that information which is tabulated in Figure 13. Bar graphs are provided to help illustrate the results. The LOS shown here is that for overall travel through the corridor. It does not correspond directly to intersection LOS described earlier but does take into account the delay experienced at intersections along the way. It should be noted that these values overstate the actual performance as Synchro does not take into account the effects of buses stopped in travel lanes to board and discharge passenger, the slowing of vehicles turning into commercial property, or the effect of HAWKs. Figure Other Traffic Operational Comparisons Travel Time Speed Arterial LOS Broadway Blvd AM PM AM PM AM PM Existing EB B B WB B B 6-Lane EB C C WB C C 4-Lane EB D F WB E D 4-Lane EB C E Low Growth WB E C Notes: 1. Travel time is average time in minutes to drive between Euclid and Country Club. 2. Speed is average speed of trip between Euclid and Country Club Road in mph. Figure 13a -- Eastbound Comparison Figure 13b -- Westbound Comparison Average Speed (mph) AM Existing 6-Lane 4-Lane 4-Lane Low Growth PM Average Speed (mph) AM Existing 6-Lane 4-Lane 4-Lane Low Growth PM It can be seen that the arterial LOS results are similar to those determined for the signalized intersections. Acceptable operation is found for the 6-lane configuration in all cases. For the four-lane configuration, peak hour levels of service are LOS E or F in the dominant direction of traffic with corresponding average speeds on the order of ten miles per hour. 12 of 15
81 Turn Lane Storage Requirements Sufficient turn lane storage is needed to allow turning vehicles to pull out of the travel lanes for the signalized intersections to function as intended. The traffic report has determined the necessary lengths of right and left turn lanes which are summarized here in Figure 14 for reference. It can be seen that the single left turn lanes at Country Club Road for the alternate configuration would be much longer than if double lefts are provided. Figure Recommended Turn Lane Storage Requirements at Signalized Intersections Eastbound Westbound Northbound Southbound Turn Lanes Turn Lanes Turn Lanes Turn Lanes Intersection Left Right Left Right Left Right Left Right Euclid Avenue 170' x 2 110' 150' x 2 290' 110' x 2 210' 140' 350' Highland Avenue 110' 110' 110' 110' 140' ' -- Campbell Avenue 160' x 2 110' 130' x 2 200' 130' x 2 200' 220' x 2 200' Tucson Boulevard 110' 110' 110' 110' 170' 110' 170' 130' Country Club Road 140' x 2 110' 130' x 2 220' 110' x 2 150' 160' x 2 130' Country Club Road Alt 300' ' 150' 200' 110' 400' 110' Bus Stops Bus stops will be handled differently depending on the choice between six and eight lanes. With the eight-lane section, the buses would simply stop in the multiuse lanes to board and discharge passengers. With the six-lane section, bus pullouts would be provided where possible to allow buses to leave the travel lane to board and discharge. Pullouts would not typically be provided at non-signalized intersections due to the difficulty for buses to merge back into arterial traffic without the shelter of a red light. Attachment A shows where bus stops currently exist and how they would likely be handled with and without the multiuse lanes. The pullouts shown for the six-lane section indicate where additional right-of-way would be needed. Access Management The City of Tucson's Transportation Access Management Guidelines specified 660' as the minimum spacing between full access median openings for an arterial roadway. This guideline along with a review of existing cross street traffic demand, network connectivity, and potential future development has been used to develop the scheme of median openings shown. The recommended opening locations are also shown in the drawings of Attachment A. The opening at Warren Avenue would allow left turns off Broadway but would force only right turns off Warren. Operational Comparison of Six and Eight-Lane Sections The traffic study update also determined the impact on traffic and transit operations of using a standard six-lane section rather than the eight-lane section originally contemplated. The eight-lane section includes the same travel lanes as the six-lane section but includes also a multiuse lane in each direction for buses, right-turning vehicles, and potentially bikes. Synchro does not have the ability to account for dedicated bus lanes or the other factors that the presence of lack of multiuse lanes would impact. To evaluate the operational effects of the multiuse lanes, a sophisticated micro simulation modeling approach has been employed that explicitly incorporates the effects of pedestrian movement, driveway activity, HAWK pedestrian crossings, and bus service. VISSIM software was used for this purpose. Key elements of the VISSIM analysis include: -- Separate models were created to reflect the six and eight-lanes sections. -- The model limits extend from a point west of Cherry Avenue to a point east of Tucson Boulevard. That section is particularly active and considered best able to reflect operational differences since it includes two HAWK 13 of 15
82 crossings, heavy commercial activity including the Safeway shopping center, and the Campbell Avenue, Cherry Avenue, and Tucson Boulevard intersections. -- Peak 2040 PM hour projected volumes (4:00 PM to 5:00 PM) are used. Peak AM volumes have not been analyzed but would likely provide similar results in opposite directions. -- The models include one driveway per block in each direction to reflect the general ingress/egress activity associated with adjacent businesses. Twenty vehicles are assumed to enter and exit these driveways during the peak hour. -- Additional driveways were provided to represent the higher volumes at Sonic and Safeway. The driveway for Sonic has been assumed to have 40 vehicles per hour (both in and out). The separate driveway for Safeway was assumed to serve 160 vehicles in and 70 vehicles out. These values are based on traffic counts made for this study. -- The signal at Campbell was assumed to have a 90 second cycle, to be coordinated with adjacent installations, and given transit priority. -- HAWK pedestrian crossings were included at Cherry and Plumer Avenues. They are assumed to be two-stage crossings synchronized with the roadway signal system, with vehicles stopping on flashing red lights. Pedestrian volumes are based on actual counts taken for this study increased by 25% to reflect 2040 volumes. -- Multiuse lanes for the eight-lane section would be available only to transit vehicles, bikes, and right turning vehicles. The extent to which placing bikes in the multiuse lanes might diminish transit operation cannot be modeled in VISSIM and has not been explicitly determined. -- For the six-lane section, buses use a standard travel lane though bus pullouts are provided at signalized intersections for boarding and discharging passengers. At non-signalized intersections buses stop in the travel lane. For the eight-lane section they would stop in the multiuse lane. -- Regular bus service is assumed at 10-minute headways stopping at all stops. Express bus service or bus rapid transit is assumed to have 15 minute headways and stop only at Campbell. Dwell times of 30 seconds are assumed at Campbell and 15 seconds at other stops. Several measures of operational comparison are shown in Figure 15. It can be seen that not providing multiuse lanes would increase the average delay for transit about 10% while that of general arterial traffic would not be significantly affected. The total travel time would be increased in the 10% to 15% range in both cases. Figure Comparison of Eight and Six Lane Traffic Operations Arterial Traffic 8 Lanes 6 Lanes Change Percent Average Delay time (Seconds per Vehicle) % Average Number of Stops per Vehicle % Average Speed (Miles per Hour) % Average Eastbound Travel Time (seconds) % Average Westbound Travel Time (seconds) % Buses 8 Lanes 6 Lanes Change Percent Average Delay time (Seconds per Vehicle) % Average Number of Stops per Vehicle % Average Speed (Miles per Hour) % Average Eastbound Travel Time (seconds) % Average Westbound Travel Time (seconds) % Other traffic operational analyses are likely to be needed during the DCR process to evaluate alternative configurations for the Euclid, Campbell, and Country Club intersections. 14 of 15
Complete Street Analysis of a Road Diet: Orange Grove Boulevard, Pasadena, CA
 Complete Street Analysis of a Road Diet: Orange Grove Boulevard, Pasadena, CA Aaron Elias, Bill Cisco Abstract As part of evaluating the feasibility of a road diet on Orange Grove Boulevard in Pasadena,
Dr. M.L. King, Jr. Street North Complete Streets Resurfacing Opportunities HOUSING, LAND USE, AND TRANSPORTATION COMMITTEE MARCH 22, 2018
 Dr. M.L. King, Jr. Street North Complete Streets Resurfacing Opportunities HOUSING, LAND USE, AND TRANSPORTATION COMMITTEE MARCH 22, 2018 What s Happening The City plans to mill and resurface Dr. M.L.
DEPARTMENT OF ENVIRONMENTAL SERVICES. North Harrison Street (Lee Highway to Little Falls Road) Comparative Analysis. Prepared for:
 Comparative Analysis. Prepared for:") DEPARTMENT OF ENVIRONMENTAL SERVICES North Harrison Street (Lee Highway to Little Falls Road) Comparative Analysis Prepared for: Arlington County Department of Environmental Services 2100 Clarendon Boulevard,
DEPARTMENT OF ENVIRONMENTAL SERVICES North Harrison Street (Lee Highway to Little Falls Road) Comparative Analysis Prepared for: Arlington County Department of Environmental Services 2100 Clarendon Boulevard,
Traffic Impact Analysis Walton Acres at Riverwood Athletic Club Clayton, NC
 Traffic Impact Analysis Walton Acres at Riverwood Athletic Club Clayton, NC 1. TABLE OF CONTENTS INTRODUCTION...1 1.1. Site Location and Study Area...1 1.2. Proposed Land Use and Site Access...2 1.3.
5858 N COLLEGE, LLC N College Avenue Traffic Impact Study
 5858 N COLLEGE, LLC nue Traffic Impact Study August 22, 2016 Contents Traffic Impact Study Page Preparer Qualifications... 1 Introduction... 2 Existing Roadway Conditions... 5 Existing Traffic Conditions...
TRANSPORTATION ANALYSIS REPORT US Route 6 Huron, Erie County, Ohio
 TRANSPORTATION ANALYSIS REPORT US Route 6 Huron, Erie County, Ohio December 12, 2012 Prepared for: The City of Huron 417 Main Huron, OH 44839 Providing Practical Experience Technical Excellence and Client
Traffic Circulation Study for Neighborhood Southwest of Mockingbird Lane and Airline Road, Highland Park, Texas
 ARIZONA TEXAS NEW MEXICO OKLAHOMA February 13, 2015 Mr. Meran Dadgostar P.E., R.S. Town of Highland Park 4700 Drexel Dr. Highland Park, Texas 75205 Re: Traffic Circulation Study for Neighborhood Southwest
Figure 1: Vicinity Map of the Study Area
 ARIZONA TEXAS NEW MEXICO OKLAHOMA May 5, 2016 Mr. Anthony Beach, P.E. BSP Engineers 4800 Lakewood Drive, Suite 4 Waco, Texas 76710 Re: Intersection and Access Analysis along Business 190 in Copperas Cove
Traffic Impact Analysis Chatham County Grocery Chatham County, NC
 Chatham County Grocery Chatham County, NC TABLE OF CONTENTS 1. INTRODUCTION... 1 1.1. Location and Study Area... 1 1.2. Proposed Land Use and Access... 2 1.3. Adjacent Land Uses... 2 1.4. Existing ways...
Chapter 4 Traffic Analysis
 Chapter 4 Traffic Analysis PURPOSE The traffic analysis component of the K-68 Corridor Management Plan incorporates information on the existing transportation network, such as traffic volumes and intersection
TRAFFIC IMPACT ANALYSIS
 TRAFFIC IMPACT ANALYSIS FOR THE CHAMPAIGN UNIT#4 SCHOOL DISTRICT PROPOSED HIGH SCHOOL (SPALDING PARK SITE) IN THE CITY OF CHAMPAIGN Final Report Champaign Urbana Urbanized Area Transportation Study 6/24/2014
M-58 HIGHWAY ACCESS MANAGEMENT STUDY Mullen Road to Bel-Ray Boulevard. Prepared for CITY OF BELTON. May 2016
 M-58 HIGHWAY ACCESS MANAGEMENT STUDY Prepared for CITY OF BELTON By May 2016 Introduction Missouri State Highway 58 (M-58 Highway) is a major commercial corridor in the City of Belton. As development has
ENHANCED PARKWAY STUDY: PHASE 2 CONTINUOUS FLOW INTERSECTIONS. Final Report
 Preparedby: ENHANCED PARKWAY STUDY: PHASE 2 CONTINUOUS FLOW INTERSECTIONS Final Report Prepared for Maricopa County Department of Transportation Prepared by TABLE OF CONTENTS Page EXECUTIVE SUMMARY ES-1
Existing Conditions. Date: April 16 th, Dan Holderness; Coralville City Engineer Scott Larson; Coralville Assistant City Engineer
 Date: April 16 th, 2015 To: From: Re: Dan Holderness; Coralville City Engineer Scott Larson; Coralville Assistant City Engineer Darian Nagle-Gamm, Traffic Engineering Planner Highway 6 (2 nd Street) /
Purpose and Need. Chapter Introduction. 2.2 Project Purpose and Need Project Purpose Project Need
 Chapter 2 Purpose and Need 2.1 Introduction The El Camino Real Bus Rapid Transit (BRT) Project (Project) would make transit and other transportation improvements along a 17.6-mile segment of the El Camino
Waterford Lakes Small Area Study
 Waterford Lakes Small Area Study Existing Traffic Conditions PREPARED FOR: ORANGE COUNTY PUBLIC WORKS DEPARTMENT TRAFFIC ENGINEERING DIVISION ORLANDO, FLORIDA PREPARED WITH: INWOOD CONSULTING ENGINEERS
RM 620 FEASIBILITY STUDY
 RM 620 FEASIBILITY STUDY Sections 5 & 6 December 7, 2015 STUDY PROCESS Study Purpose and Goals The RM 620 Feasibility Study was launched by the Texas Department of Transportation (TxDOT) to analyze transportation
Glenn Avenue Corridor Traffic Operational Evaluation
 Glenn Avenue Corridor Traffic Operational Evaluation PREPARED FOR: THE CITY OF AUBURN PREPARED BY: DECEMBER 2007 Glenn Avenue Corridor Study--Auburn, Alabama TABLE OF CONTENTS Introduction... 1 Background
MEMORANDUM. Charlotte Fleetwood, Transportation Planner
 MEMORANDUM Date: Updated August 22, 2017 To: Organization: Charlotte Fleetwood, Transportation Planner Boston Transportation Department From: Jason DeGray, P.E., PTOE, Regional Director of Engineering
Traffic Impact Study. Westlake Elementary School Westlake, Ohio. TMS Engineers, Inc. June 5, 2017
 TMS Engineers, Inc. Traffic Impact Study Westlake Elementary School Westlake, Ohio June 5, 2017 Prepared for: Westlake City Schools - Board of Education 27200 Hilliard Boulevard Westlake, OH 44145 TRAFFIC
Public Involvement Meeting Tuesday, June 13, Albany Shaker Road Corridor Study
 Public Involvement Meeting Tuesday, June 13, 2017 Albany Shaker Road Corridor Study Agenda / Meeting Outline 1. Introduce the project 2. Complete Streets 3. Share/confirm our findings 4. Your Opinion 5.
1609 E. FRANKLIN STREET HOTEL TRAFFIC IMPACT STUDY EXECUTIVE SUMMARY
 1609 E. FRANKLIN STREET HOTEL TRAFFIC IMPACT STUDY EXECUTIVE SUMMARY Prepared for: The Town of Chapel Hill Public Works Department Traffic Engineering Division Prepared by: HNTB North Carolina, PC 343
INDUSTRIAL BUILDING 3009 HAWTHORNE ROAD CITY OF OTTAWA TRANSPORTATION OVERVIEW REVISED. Prepared for: Canada Inc.
 INDUSTRIAL BUILDING 3009 HAWTHORNE ROAD CITY OF OTTAWA TRANSPORTATION OVERVIEW REVISED Prepared for: 7849648 Canada Inc. Octiober 1, 2015 114-598 Overview_2.doc D. J. Halpenny & Associates Ltd. Consulting
Transit Working Group
 Transit Working Group 11:00 a.m. Tuesday, March 8, 2016 Pima Association of Governments 1 E. Broadway Blvd., Suite 401 4 th Floor Santa Rita Conference Room AGENDA 1. Call to Order, Introductions, and
MoPac South: Impact on Cesar Chavez Street and the Downtown Network
 MoPac South: Impact on Cesar Chavez Street and the Downtown Network Prepared by: The University of Texas at Austin Center for Transportation Research Prepared for: Central Texas Regional Mobility Authority
Traffic Study North Shore School District 112
 Traffic Study North Shore School District 112 Proposed Expansion of Northwood Junior High School Prepared By: May 1, 2015 1. Introduction Kenig, Lindgren, O Hara, Aboona, Inc. (KLOA, Inc.) has been retained
5.0 Roadway System Plan
 Southwest Boise Transportation Study Page 16 5.0 Roadway System Plan The Roadway System Plan outlines roadway improvements in the Initial Study Area. It forecasts future deficiencies on the arterial system,
University Hill Transportation Study Technical Memorandum Alternatives Modeling and Analysis May 2007
 Technical Memorandum May 2007 Syracuse Metropolitan Transportation Council Edwards and Kelcey with Wallace Roberts and Todd Alta Planning and Design CONTENTS SECTION ONE- INTRODUCTION...1 SECTION TWO-
Chapter 3 BUS IMPROVEMENT CONCEPTS
 Chapter 3 BUS IMPROVEMENT CONCEPTS The purpose of this chapter is to describe potential bus improvement strategies and potential impacts or implications associated with BRT implementation within the existing
Lincoln Avenue Road Diet Trial
 Lincoln Avenue Road Diet Trial Data Collection Report June 1, 2015 Department of Transportation Table of Contents I. Introduction...... 3 II. Data Collection Methodology & Results...... 5 A. Traffic Volume
METHODOLOGY. Signalized Intersection Average Control Delay (sec/veh)
") Chapter 5 Traffic Analysis 5.1 SUMMARY US /West 6 th Street assumes a unique role in the Lawrence Douglas County transportation system. This principal arterial street currently conveys commuter traffic
Chapter 5 Traffic Analysis 5.1 SUMMARY US /West 6 th Street assumes a unique role in the Lawrence Douglas County transportation system. This principal arterial street currently conveys commuter traffic
Capital Region Council of Governments
 March 23, 2018 Capital Region Council of Governments PROJECT CONCEPT REPORT Realignment of Swamp and Northfield Road s approaches to Route 44 (Boston Turnpike) Town of Coventry SUMMARY: The Town of Coventry
ALLEY 24 TRAFFIC STUDY
 ALLEY 24 TRAFFIC STUDY in City of Frostburg, Maryland January 2013 3566 Teays Valley Road Hurricane, WV Office: (304) 397-5508 www.denniscorporation.com Alley 24 Traffic Study January 2013 Frostburg, Maryland
Operational Comparison of Transit Signal Priority Strategies
 Operational Comparison of Transit Signal Priority Strategies Revision Submitted on: November, 0 Author: Adriana Rodriguez, E.I Assistant Engineer Parsons Brinckerhoff 0 South Orange Avenue, Suite 00 Orlando,
CITY OF OAKLAND. 27th Street Bikeway Feasibility and Design. Final Report (v3) March 23, Kimley-Horn and Associates, Inc.
 March 23, Kimley-Horn and Associates, Inc.") CITY OF OAKLAND 27th Street Bikeway Feasibility and Design Final Report (v3) March 23, 2007 PREPARED BY: Kimley-Horn and Associates, Inc. Table of Contents 1. Introduction 3 2. 27 th Street/Bay Place Corridor
CITY OF OAKLAND 27th Street Bikeway Feasibility and Design Final Report (v3) March 23, 2007 PREPARED BY: Kimley-Horn and Associates, Inc. Table of Contents 1. Introduction 3 2. 27 th Street/Bay Place Corridor
Subject: Solberg Avenue / I-229 Grade Separation: Traffic Analysis
 MEMORANDUM Transportation Bill Troe, AICP Jason Carbee, AICP 12120 Shamrock Plaza Suite 300 Omaha, NE 68154 (402) 334-8181 (402) 334-1984 (Fax) To: Project File Date: Subject: Solberg Avenue / I-229 Grade
Highway 49, Highway 351 and Highway 91 Improvements Feasibility Study Craighead County
 Highway 49, Highway 351 and Highway 91 Improvements Feasibility Study Craighead County Executive Summary March 2015 Highway 49, Highway 351 and Highway 91 Improvements Feasibility Study Craighead County
INDUSTRIAL BUILDING 1660 COMSTOCK ROAD CITY OF OTTAWA TRANSPORTATION OVERVIEW. Prepared for:
 INDUSTRIAL BUILDING 1660 COMSTOCK ROAD CITY OF OTTAWA TRANSPORTATION OVERVIEW Prepared for: Simluc Contractors Limited 2550 Blackwell Street, Ottawa K1B 5R1 October 18, 2013 113-584 Overview_1.doc D. J.
Project Report. South Kirkwood Road Traffic Study. Meadows Place, TX October 9, 2015
 Meadows Place, TX October 9, 2015 Contents 1 Introduction... 1 2 Data Collection... 1 3 Existing Roadway Network... 2 4 Traffic Volume Development... 2 5 Warrant Analysis... 3 6 Traffic Control Alternative
Donahue Drive Corridor Traffic Operational Evaluation
 Donahue Drive Corridor Traffic Operational Evaluation PREPARED FOR: THE CITY OF AUBURN PREPARED BY: JANUARY 2007 Donahue Drive Corridor Study--Auburn, Alabama TABLE OF CONTENTS Introduction... 1 Background
Arterial Transitway Corridors Study. Ave
 Arterial Transitway Corridors Study Ave January 2012 Arterial Transitway Corridors Study Overview Corridor Features and Demographics 11 study corridors, 95 route miles 86,000 daily rides and half of existing
Welcome! San Jose Avenue Open House August 25, 2015
 Welcome! San Jose Avenue Open House August 25, 2015 Vision Zero The City and County of San Francisco adopted Vision Zero San Francisco Vision Zero High Injury Network as a policy in 2014, committing an
J Street and Folsom Boulevard Lane Conversion Project (T ) Before and After Traffic Evaluation
 Before and After Traffic Evaluation") J Street and Folsom Boulevard Lane Conversion Project (T15125400) Before and After Traffic Evaluation Prepared by Transportation Division June 2014 Executive Summary On February 12, 2013, the City of Sacramento
J Street and Folsom Boulevard Lane Conversion Project (T15125400) Before and After Traffic Evaluation Prepared by Transportation Division June 2014 Executive Summary On February 12, 2013, the City of Sacramento
3 TRAFFIC CONTROL SIGNAL TIMING AND SYNCHRONIZATION
 Report No. 8 of the Transportation Services Committee Regional Council Meeting of October 20, 2011 3 TRAFFIC CONTROL SIGNAL TIMING AND SYNCHRONIZATION The Transportation Services Committee recommends:
Bay to Bay Boulevard Complete Streets Project
 Bay to Bay Boulevard Complete Streets Project Dale Mabry Highway to Bayshore Boulevard February 08, 2018 Photo Source: Tampa Bay Times Alessandra Da Pra Meeting Format Introduction Resurfacing Information
3.9 - Transportation and Traffic
 Transportation and Traffic 3.9 - Transportation and Traffic This section describes the potential transportation and traffic effects of project implementation on the project site and its surrounding area.
Final Report. Evaluation of Flashing Yellow Right Turn Arrow at Silverbell Rd and Cortaro Rd. FHWA Experimentation #4-329(E)
") Final Report Evaluation of Flashing Yellow Right Turn Arrow at Silverbell Rd and Cortaro Rd FHWA Experimentation #4-329(E) Marana, Arizona January 2009 Submitted To: Submitted By: FINAL REPORT EVALUATION
Final Report Evaluation of Flashing Yellow Right Turn Arrow at Silverbell Rd and Cortaro Rd FHWA Experimentation #4-329(E) Marana, Arizona January 2009 Submitted To: Submitted By: FINAL REPORT EVALUATION
Evaluation of M-99 (Broad Street) Road Diet and Intersection Operational Investigation
 Road Diet and Intersection Operational Investigation") Evaluation of M-99 (Broad Street) Road Diet and Intersection Operational Investigation City of Hillsdale, Hillsdale County, Michigan June 16, 2016 Final Report Prepared for City of Hillsdale 97 North Broad
Evaluation of M-99 (Broad Street) Road Diet and Intersection Operational Investigation City of Hillsdale, Hillsdale County, Michigan June 16, 2016 Final Report Prepared for City of Hillsdale 97 North Broad
Omaha s Complete Streets Policy
 Omaha s Complete Streets Policy (Adopted August 2015) VISION To create great places and enhance our quality of life, the City of Omaha will provide safe, accessible streets for all users. Complete Streets
7.0 FREEWAYS CONGESTION HOT SPOT PROBLEM & IMPROVEMENT PROJECT ANALYSIS & DEFINITION
 7.0 FREEWAYS CONGESTION HOT SPOT PROBLEM & IMPROVEMENT PROJECT ANALYSIS & DEFINITION 7.1 INTRODUCTION & METHODOLOGY FEASIBILITY REPORT Congestion hot spot problem locations have been assessed using the
Los Altos Hills Town Council - June 18, 2015 Palo Alto City Council June 22, AGENDA ITEM #2.B Presentation
 Los Altos Hills Town Council - June 18, 2015 Palo Alto City Council June 22, 2015 AGENDA ITEM #2.B Presentation Previous Presentations Los Altos Hills Town Council in May 2014 and February 2015 Palo Alto
REPORT CONCURRENCE. City Manager. The General Manager concurs with the recommendation of this report.
 COUNCIL REPORT Report No. ENG 08-018 Executive Committee Date: May 0, 018 File No: 5400-1 To: From: Subject: Mayor and Council Purvez Irani, Senior Transportation Engineer Bluejay Street Road Improvements
OFFICE/RETAIL DEVELOPMENT 1625 BANK STREET OTTAWA, ONTARIO TRANSPORTATION BRIEF. Prepared for: Canada Inc.
 OFFICE/RETAIL DEVELOPMENT 1625 BANK STREET OTTAWA, ONTARIO TRANSPORTATION BRIEF Prepared for: 9402209 Canada Inc. December 15, 2015 115-625 Report_2.doc D. J. Halpenny & Associates Ltd. Consulting Transportation
Traffic Study of Fuller Street, Cady Street, West Street and West Avenue. Final Report
 Traffic Study of Fuller Street, Cady Street, West Street and West Avenue Final Report July 2005 Prepared for: Town of Ludlow Prepared by: Pioneer Valley Planning Commission 26 Central Street West Springfield,
HARRISON STREET/OAKLAND AVENUE COMMUNITY TRANSPORTATION PLAN
 HARRISON STREET/OAKLAND AVENUE Community Workshop #4: Draft Plan Review December 3, 2009 D E S I G N, C O M M U N I T Y & E N V I R O N M E N T INTRODUCTIONS Key Project Staff: Alisa Shen, Project Manager,
Traffic Impact Study WestBranch Residential Development Davidson, NC March 2016
 Traffic Impact Study WestBranch Residential Development Davidson, NC March 216 TRAFFIC IMPACT STUDY FOR THE WestBranch Residential Development LOCATED IN DAVIDSON, NC Prepared For: Lennar Carolinas, LLC
CITY OF SPOKANE VALLEY Request for Council Action
 CITY OF SPOKANE VALLEY Request for Council Action Meeting Date: December 16, 2014 Department Director Approval: Check all that apply: consent old business new business public hearing information admin.
Multimodal Analysis in the 2010 Highway Capacity Manual
 Multimodal Analysis in the 2010 Highway Capacity Manual It s not just cars anymore! Jamie Parks, AICP HCAT Conference May 9-10, 2011 Multimodal LOS in the 2010 HCM History and background Overview of methods
Walmart (Store # ) 60 th Street North and Marion Road Sioux Falls, South Dakota
 60 th Street North and Marion Road Sioux Falls, South Dakota") Walmart (Store #4865-00) 60 th Street North and Marion Road Sioux Falls, South Dakota Prepared for: Wal-Mart Stores, Inc. Bentonville, Arkansas Prepared by: Kimley-Horn and Associates, Inc. ã2013 Kimley-Horn
Walmart (Store #4865-00) 60 th Street North and Marion Road Sioux Falls, South Dakota Prepared for: Wal-Mart Stores, Inc. Bentonville, Arkansas Prepared by: Kimley-Horn and Associates, Inc. ã2013 Kimley-Horn
BETHEL ROAD AND SEDGWICK ROAD CORRIDOR STUDY
 DRAFT PLAN City Council Meeting August 14, 2017 STUDY AREA Sedgwick Corridor State Route 160, principal arterial with Class 3 access management designation, commuter and freight route, connection to SR
WELCOME. Stakeholder Involvement Group Meeting #2 Round Lake Public Works October 24, 2018
 WELCOME Stakeholder Involvement Group Meeting #2 Round Lake Public Works October 24, 2018 MEETING AGENDA 1. Welcome and Introductions 2. Study Progress Update 3. Problem Statement 4. Technical Analysis
Scottsdale Road/Rural Road Alternatives Analysis (AA) Study. Arizona ITE/IMSA Spring Conference March 7, 2012
 Study. Arizona ITE/IMSA Spring Conference March 7, 2012") Scottsdale Road/Rural Road Alternatives Analysis (AA) Study Arizona ITE/IMSA Spring Conference March 7, 2012 Study Location and Duration Primary Study Corridor (major focus of effort) Rural Road and Scottsdale
Scottsdale Road/Rural Road Alternatives Analysis (AA) Study Arizona ITE/IMSA Spring Conference March 7, 2012 Study Location and Duration Primary Study Corridor (major focus of effort) Rural Road and Scottsdale
David DiPierro, John Amberson. Steering Committee Meeting #4 Overview
 IBI GROUP 18401 Von Karman Avenue Suite 110 Irvine CA 92612 USA tel 949 833 5588 fax 949 833 5511 ibigroup.com Memorandum To/Attention Steering Committee Members Date February 17, 2016 From IBI Group Project
FRONT RANGE CROSSINGS TRAFFIC IMPACT STUDY
 FRONT RANGE CROSSINGS TRAFFIC IMPACT STUDY Prepared for: City of Thornton And Colorado Department of Transportation Prepared by: 11 Blake Street, Suite 2 Denver, Colorado 822 Contact: Brian Bern, PE, PTOE
Route 7 Corridor Study
 Route 7 Corridor Study Executive Summary Study Area The following report analyzes a segment of the Virginia State Route 7 corridor. The corridor study area, spanning over 5 miles in length, is a multi
MEDICAL/OFFICE BUILDING 1637 BANK STREET OTTAWA, ONTARIO TRANSPORTATION OVERVIEW. Prepared for:
 MEDICAL/OFFICE BUILDING 1637 BANK STREET OTTAWA, ONTARIO TRANSPORTATION OVERVIEW Prepared for: 2434984 Ontario Inc. 13-5510 Canotek Road Ottawa, Ontario K1J 9J5 June 4, 2015 115-613 Report_2.doc D. J.
MEETING FACILITY 2901 GIBFORD DRIVE CITY OF OTTAWA TRANSPORTATION BRIEF. Prepared for: Holiday Inn Express 2881 Gibford Drive Ottawa, ON K1V 2L9
 MEETING FACILITY 2901 GIBFORD DRIVE CITY OF OTTAWA TRANSPORTATION BRIEF Prepared for: Holiday Inn Express 2881 Gibford Drive Ottawa, ON K1V 2L9 December 18, 2012 112-566 Brief_1.doc D. J. Halpenny & Associates
PINESTONE TRAFFIC IMPACT STUDY Travelers Rest, South Carolina
 PINESTONE TRAFFIC IMPACT STUDY Travelers Rest, South Carolina Prepared for Longbranch Development Prepared by January 13, 219 ii Table of Contents Subject Page Signature Page... i Table of Contents...
Monterey Road Complete Streets
 Monterey Road Complete Streets Complete Street Objectives Improve livability and economic vitality Enhance pedestrian environment Accommodate bicyclists safely Reduce noise and air pollution Create attractive,
TABLE OF CONTENTS TABLE OF CONTENTS... I APPENDICES... III LIST OF EXHIBITS... V LIST OF TABLES... VII LIST OF ABBREVIATED TERMS...
 TABLE OF CONTENTS TABLE OF CONTENTS... I APPENDICES... III LIST OF EXHIBITS... V LIST OF TABLES... VII LIST OF ABBREVIATED TERMS... IX 1 INTRODUCTION... 1 1.1 Project Overview... 1 1.2 Analysis Scenarios...
THIS PAGE LEFT BLANK INTENTIONALLY
 GA SR 25 Spur at Canal Road Transportation Impact Analysis PREPARED FOR GLYNN COUNTY, GEORGIA 1725 Reynolds Street, Suite 300 Brunswick, Georgia 31520 PREPARED BY 217 Arrowhead Boulevard Suite 26 Jonesboro,
4. ENVIRONMENTAL IMPACT ANALYSIS 9. TRANSPORTATION AND TRAFFIC
 4. ENVIRONMENTAL IMPACT ANALYSIS 9. TRANSPORTATION AND TRAFFIC 4.9.1 INTRODUCTION The following section addresses the Proposed Project s impact on transportation and traffic based on the Traffic Study
List of Attachments. Location Map... Site Plan... City of Lake Elsinore Circulation Element... City of Lake Elsinore Roadway Cross-Sections...
 List of Attachments Exhibits Location Map... Site Plan... City of Lake Elsinore Circulation Element... City of Lake Elsinore Roadway Cross-Sections... Existing Lane Geometry and Traffic Controls... Existing
FINAL DESIGN TRAFFIC TECHNICAL MEMORANDUM
 FINAL DESIGN TRAFFIC TECHNICAL MEMORANDUM July 2014 FINAL (SR 43) Project Development and Environment Study From State Road 60 (Adamo Drive) to I-4 (SR 400) Hillsborough County, Florida Work Program Item
Shockoe Bottom Preliminary Traffic and Parking Analysis
 Shockoe Bottom Preliminary Traffic and Parking Analysis Richmond, Virginia August 14, 2013 Prepared For City of Richmond Department of Public Works Prepared By 1001 Boulders Pkwy Suite 300, Richmond, VA
Main-McVay Transit Study: Phase 2 Options Definition and High Level Constraints Evaluation
 Main-McVay Transit Study: Phase 2 Options Definition and High Level Constraints Evaluation APRIL 2016 A collaborative study between: For Additional Information or to Comment If you would like additional
WELCOME Mission-Geneva Transportation Study
 WELCOME Mission-Geneva Transportation Study Study Process and Schedule 2005 2006 Oct Nov Dec Jan Feb Mar Apr May Jun Jul Aug Sept Oct Task 2 Develop Outreach Plan Task 3 Document Existing Conditions/ Prioritize
Grant Avenue Streetscape
 REPORT TYPE GOES HERE Grant Avenue Streetscape PREPARED FOR City of Manassas 9027 Center Street Manassas, VA 20110 PREPARED BY 8300 Boone Boulevard Suite 700 Vienna, Virginia 22182 571.389.8121 July 31,
Appendix B: Forecasting and Traffic Operations Analysis Framework Document
 Existing Conditions Report - Appendix Appendix B: Forecasting and Traffic Operations Analysis Framework Document This document defines the methodology and assumptions that will be used in the traffic forecasting
DUNBOW ROAD FUNCTIONAL PLANNING
 DUNBOW ROAD FUNCTIONAL PLANNING Final Report August 3, 216 #31, 316 5th Avenue NE Calgary, AB T2A 6K4 Phone: 43.273.91 Fax: 43.273.344 wattconsultinggroup.com Dunbow Road Functional Planning Final Report
Highway 111 Corridor Study
 Highway 111 Corridor Study June, 2009 LINCOLN CO. HWY 111 CORRIDOR STUDY Draft Study Tea, South Dakota Prepared for City of Tea Sioux Falls Metropolitan Planning Organization Prepared by HDR Engineering,
Truck Climbing Lane Traffic Justification Report
 ROUTE 7 (HARRY BYRD HIGHWAY) WESTBOUND FROM WEST MARKET STREET TO ROUTE 9 (CHARLES TOWN PIKE) Truck Climbing Lane Traffic Justification Report Project No. 6007-053-133, P 101 Ι UPC No. 58599 Prepared by:
Intersection Traffic Control Feasibility Study
 Intersection Traffic Control Feasibility Study CSAH 9 at CSAH 60 (185th Avenue) Prepared For: Dakota County Transportation Department Western Service Center 14955 Galaxie Avenue, 3rd Floor Apple Valley,
SCHOOL CROSSING PROTECTION CRITERIA
 CITY OF MADISON TRAFFIC ENGINEERING SCHOOL CROSSING PROTECTION CRITERIA January 2016 Adopted as Policy on August 31, 1976, by Common Council by Amended Resolution #29,540 Amended on September 14, 1976,
Traffic Impact Study Little Egypt Road Development Denver, North Carolina June 2017
 Traffic Impact Study Little Egypt Road Development Denver, North arolina June 2017 N. Little Egypt Road DQ\ QDQFLQJ VDOHV RU RWKHU SHUIRUPDQFH EDVHG FULWHULD Proposed Site Driveways Site Driveway 1 TRAFFI
Proposed Action, Purpose and Need Technical Memorandum
 Proposed Action, Purpose and Need Technical Memorandum MoPac (State Loop 1) Intersections, Austin District From North of Slaughter Lane to South of La Crosse Avenue CSJ: 3136-01-015 Travis County, Texas
Community Task Force March 14, 2018
 Community Task Force March 14, 2018 Welcome and Introductions Project Partners Regional Transportation District (RTD) City of Aurora Colorado Department of Transportation (CDOT) Denver Regional Council
Road Diets FDOT Process
 Florida Department of TRANSPORTATION Road Diets FDOT Process Humberto Castillero, PE, PTOE Roadway Design Office Purpose of Guide Develop a statewide lane elimination review process Balance state & local
Brian McHugh, Buckhead Community Improvement District. SUBJECT: Wieuca Road at Phipps Boulevard Intersection Improvements Project
 MEMO TO: FROM: Brian McHugh, Buckhead Community Improvement District Jagan Kaja, AICP, WSP Parsons Brinckerhoff SUBJECT: Wieuca Road at Phipps Boulevard Intersection Improvements Project DATE: October
Table of Contents FIGURES TABLES APPENDICES. Traffic Impact Study Hudson Street Parking Garage MC Project No.: A Table of Contents
 Traffic Impact Study Hudson Street Parking Garage MC Project No.: 151714A Table of Contents Table of Contents I. INTRODUCTION... 2 II. EXISTING CONDITIONS... 5 III. 215 EXISTING TRAFFIC CONDITIONS... 6
Henderson Avenue Mixed-Use Development
 Zoning Case: Z145-3 Traffic Impact Analysis Henderson Avenue Mixed-Use Development Dallas, TX October 26 th, 216 Kimley-Horn and Associates, Inc. Dallas, Texas Project #644827 Registered Firm F-928 Traffic
Transportation Impact Study for Abington Terrace
 Transportation Impact Study for Abington Terrace Abington Township, Montgomery County, PA Sandy A. Koza, P.E., PTOE PA PE License Number PE059911 Prepared by McMahon Associates, Inc. 425 Commerce Drive,
4.0 TRANSPORTATION SYSTEMS
 Transportation Systems 4.0 TRANSPORTATION SYSTEMS This chapter examines the impacts of the Central Corridor Extension on existing roadways and traffic operations and discusses the transit service, operations,
Community Advisory Committee
 Community Advisory Committee Meeting #1 November 19, 2014 Presentation Team Matt Fulda, Greater Bridgeport Regional Council Chris Granatini, P.E., Tighe & Bond Craig Yannes, P.E., PE PTOE, Tighe & Bond
TRAFFIC SIGNAL WARRANT STUDY
 TRAFFIC SIGNAL WARRANT STUDY 5 th STREET & ENCHANTED PINES DRIVE JANUARY 2013 TRAFFIC OPERATIONS ENGINEERING SERVICES/PUBLIC WORKS DEPARTMENT TABLE OF CONTENTS INTERSECTION LOCATION MAP ii INTRODUCTION
 TRAFFIC IMPACT STUDY CANYON HILLS PROJECT LOS ANGELES, CALIFORNIA INTRODUCTION This traffic analysis has been conducted to identify and evaluate the potential traffic impacts of the proposed Canyon Hills
Exhibit 1 PLANNING COMMISSION AGENDA ITEM
 Exhibit 1 PLANNING COMMISSION AGENDA ITEM Project Name: Grand Junction Circulation Plan Grand Junction Complete Streets Policy Applicant: City of Grand Junction Representative: David Thornton Address:
Regional Transportation Needs Within Southeastern Wisconsin
 Regional Transportation Needs Within Southeastern Wisconsin #118274 May 24, 2006 1 Introduction The Southeastern Wisconsin Regional Planning Commission (SEWRPC) is the official areawide planning agency
URBAN QUARRY HEADQUARTERS 2717 STEVENAGE DRIVE CITY OF OTTAWA TRANSPORTATION OVERVIEW. Prepared for: Urban Quarry 4123 Belgreen Drive, Ottawa K1G 3N2
 URBAN QUARRY HEADQUARTERS 2717 STEVENAGE DRIVE CITY OF OTTAWA TRANSPORTATION OVERVIEW Prepared for: Urban Quarry 4123 Belgreen Drive, Ottawa K1G 3N2 February 27, 2014 113-584 Overview_1.doc D. J. Halpenny
9 Leeming Drive Redevelopment Ottawa, ON Transportation Brief. Prepared By: Stantec Consulting Ltd.
 9 Leeming Drive Redevelopment Ottawa, ON Transportation Brief Prepared By: Stantec Consulting Ltd. TIA GUIDELINES CHECKLIST Report Context Municipal Address Comment: Section 1.1 Location relative to major