WAUGH CHAPEL ROAD-EXISTING CONDITIONS REPORT
|
|
|
- Shannon Newton
- 5 years ago
- Views:
Transcription


1 May 2018 TRANSPORTATION FACILITY PLANNING WAUGH CHAPEL ROAD-EXISTING CONDITIONS REPORT TRANSPORTATION FACILITY PLANNING WAUGH CHAPEL ROAD Waugh Chapel Road from Maytime Drive to New Market Lane Project Number H Contract No. H EXISTING CONDITIONS REPORT
2 Table of Contents Chapter 1 Project Background 1 Chapter 2 Traffic Data Collection 7 Chapter 3 Roadway Geometrics and Traffic Control Devices 17 Chapter 4 Traffic Operations Evaluation 22 Chapter 5 Multimodal Transportation 26 Chapter 6 Safety Analysis 29 Chapter 7 Findings and Next Steps 35 Chapter 8 Future No Build Conditions 36
3 Executive Summary Anne Arundel County initiated the Waugh Chapel Road Transportation Facility Planning study with the objective to fill in the gaps in the sidewalk and bicycle facilities that connect Waugh Chapel Shopping Center to the existing and planned neighborhoods to the west. The limits of the Waugh Chapel Road study corridor are from Maytime Drive to New Market Lane. The study will focus on a multimodal, context-sensitive approach to identify and recommend improvements to the existing corridor that strike a balance between future vehicular traffic volumes and pedestrian/bicyclists and to enhance safety and connectivity for all modes of transportation. This Existing Conditions Report represents the first step in the study process. Following acceptance of this report, the County will initiate Phase II of the study. During Phase II, the team will then work with the County and the community to develop evaluation metrics and begin to develop concepts for improvements to address deficiencies along the study corridor. The following summarizes the key findings of the existing conditions analysis for the Waugh Chapel Road study corridor: The signalized study intersections (Maytime Drive, Symphony Lane/Silver Way, and New Market Lane/Wigeon Way) along Waugh Chapel Road operate within adequate levels of service during peak hours. The two unsignalized intersections (Silver Way/Macmullen Drive and Summerfield Road) operate at LOS F during the AM and PM peak hours and LOS D and F during the Saturday peak hour. The failing level of service is due to the difficulty that the side street vehicles have in finding gaps to enter Waugh Chapel Road. Field observations reveal minimal queues at the unsignalized intersections. The roadway segments studied along Waugh Chapel Road operate at LOS D/E. The peak hour demand on Waugh Chapel Road is heavy for a two-lane facility. The segments east of Symphony Lane operate worse than the western segment, Maytime Drive to Symphony Lane, during the AM peak due to higher demand and truck traffic. During PM peak all segments operate at LOS E for both directions. Field observations did not reveal issues with level of service along Waugh Chapel Road. There was very little delay along the corridor during the peak periods, with the exception of an approximate 15-minute period between 7:50 and 8:05 AM in the eastbound direction at the intersection of Waugh Chapel Road and Symphony Lane. This delay is attributed to the traffic associated with the School of the Incarnation. Existing traffic volumes at the intersection of Silver Way/Macmullen Drive and Waugh Chapel Road do not warrant a traffic signal. Speeding in the corridor, based on the 85 th percentile speeds, in conjunction with roadway horizontal alignment may present potential risk to safety at the intersections as well as future proposed pedestrian and bicycle improvements. Reported crashes along the corridor are centered around the intersections and driveways. Excluding the crashes near MD 3, crashes at the intersection of New Market Lane/Wigeon Way represented over 35% of the crashes in the corridor and most of the rear-end and angle crashes. Most of the single vehicle crashes occurred between Maytime Drive and Silver Way/Macmullen Drive. Roadway horizontal curves and speeding are contributing factors. The lack of connected sidewalks on Waugh Chapel Road in the study area is a critical gap to address in this study as the roadway is transformed. Dedicated bicycle facilities or shared use paths are needed on Waugh Chapel Road to provide protection for bicyclists and connectivity for the bicycle network linking to the regional trail and transit system.
4 Chapter 1 Project Background INTRODUCTION Anne Arundel County initiated this study with the objective to fill in the gaps in the sidewalk and bicycle facilities that connect Waugh Chapel Shopping Center to the existing and planned neighborhoods to the west. This study will focus on a multimodal, context-sensitive approach to identify and recommend improvements to existing multimodal facilities that strike a balance between vehicular traffic and pedestrian/bicyclists and to enhance safety and connectivity for all modes of transportation. There also have been previous studies that have examined this area from land use, planning and transportation perspectives, including: Summerfield Traffic Impact Study, Anne Arundel County Pedestrian and Bicycle Master Plan Chapel Creek Village Traffic Impact Study, 2012 This report documents the existing transportation conditions in the study area. The chapters are structured to reflect each of the focus areas of the report. Data Collection Roadway Geometrics Traffic Operations Evaluation Multimodal Transportation Safety Assessment Findings and Conclusions STUDY AREA The study area is shown in Figure 1. The limits of the Waugh Chapel Road study corridor are from Maytime Drive to New Market Lane. This report documents existing conditions along the Waugh Chapel Road corridor to understand the needs and deficiencies for all roadway users as well as the benefits and effects of any proposed improvements on the transportation network. 1

5 Figure 1: Study Area STUDY INTERSECTIONS The study area includes the following five intersections: 1. Maytime Drive and Waugh Chapel Road 2. Silver Way/Symphony Lane and Waugh Chapel Road 3. Silver Way/Macmullen Drive and Waugh Chapel Road 4. Summerfield Road and Waugh Chapel Road 5. New Market Lane/Wigeon Way and Waugh Chapel Road Figure 2 illustrates the locations of the study intersections and their associated lane designations and intersection traffic control. Eastbound Waugh Chapel Road at Summerfield Road has one shared leftturn/through lane and a de facto right-turn lane that is currently marked as a shoulder. For traffic analysis, an effective right-turn lane is assumed for both eastbound and westbound Waugh Chapel Road at Summerfield Road. The New Market Lane/Waugh Chapel Road intersection runs actuateduncoordinated signal operations and the intersections of Maytime Drive and Symphony Lane/Silver Way with Waugh Chapel Road run coordinated signal operation. The other two intersections are stopcontrolled on the side streets. 2
6 TRANSPORTATION FACILITY PLANNING WAUGH CHAPEL ROAD-EXISTING CONDITIONS REPORT Figure 2. Study Intersection Lane Designation and Traffic Control 3


7 COMMUNITY AND DEVELOPMENT Waugh Chapel Road is in the Odenton Small Area Plan portion of Anne Arundel County. Figure 3 and Figure 4 show the types of land uses that are present. The areas located adjacent to Waugh Chapel Road are primarily residential, including low to medium density multifamily dwellings. Small commercial and retail areas are concentrated along the southeast portion of the corridor near the intersection with MD 3 (Crain Highway). Along with residential and commercial uses, there are portions of the surrounding area that are reserved for natural features and industrial uses. The Odenton MARC Train Station is located north of the project site, approximately a 30-minute walk from the western portion of the study area. Development actives in the corridor include expansion of Summerfield Village off Summerfield Road and Chapel Creek Village off Macmullen Drive, across from Silver Way. Two schools are located within or near the study area, Four Seasons Elementary School west of Maytime Drive and the School of the Incarnation off Symphony Lane. 4

8 TRANSPORTATION FACILITY PLANNING WAUGH CHAPEL ROAD-EXISTING CONDITIONS REPORT Figure 3. Existing Land Use 5

9 TRANSPORTATION FACILITY PLANNING WAUGH CHAPEL ROAD-EXISTING CONDITIONS REPORT Figure 4. Existing Land Use (Study Corridor) 6
10 Chapter 2 Traffic Data Collection The following is a summary of the data collected. Intersection turning movement count (TMC) data, including passenger vehicle, heavy vehicle, pedestrian, and bicycle counts 48-hour volume, speed and classification (VSC) data for roadway segments Historical volumes Roadway geometrics data Traffic and queuing observations INTERSECTION COUNTS AND VOLUME To conduct an analysis of existing conditions, traffic data was collected in November 2017 along the study corridor. TMCs were collected along Waugh Chapel Road between 6:30 and 8:30 am and between 4:30 and 6:30 pm on November 16, TMC data also was collected between 10:30 am and 12:30 pm on Saturday, November 18, A 12-hour intersection count was conducted for the intersection of Silver Way and Waugh Chapel Road. The overall AM and PM peak hours of the study area were determined by reviewing the individual intersection data. The network AM peak hour was determined to be 7:15 am to 8:15, the network PM peak hour was determined to be 5:30 pm to 6:30 pm, and the Saturday peak hour was determined to be 11:30 AM to 12:30 PM. Table 1 summarizes the weekday (AM and PM) and Saturday (midday) peak hours, heavy vehicle percentages, and peak hour factors for each intersection. Raw intersection count data is provided in Appendix A. In general, traffic counts were well balanced between intersections except for the segments between Silver Way/Macmullen Drive and Summerfield Road and between Summerfield Road and New Market Lane. The imbalance in volumes is attributable to the Waugh Chapel Concrete Plant and driveways to the shopping center and Waugh Chapel Center. Figure 5 and Figure 6 illustrate the existing peak hour traffic volume at the study intersections on a weekday and Saturday, respectively. Table 1. Existing Intersection Count Summary (Weekday and Saturday) ID Intersection Count Peak Hour Heavy Vehicle% AM/ PM AM/ PM Midday Midday Weekday (11/16/2017) Peak Hour Factor AM/ PM Midday 1 Waugh Chapel Road and Maytime Drive 7:15 AM 5:15 PM 1.36% 0.63% Waugh Chapel Road and Symphony Lane 7:15 AM 5:30 PM 0.96% 0.47% Waugh Chapel Road and Silver Way 7:15 AM 5:30 PM 1.22% 0.44% Waugh Chapel Road and Summerfield Road 7:15 AM 5:30 PM 4.46% 0.89% Waugh Chapel Road and New Market Lane 7:15 AM 5:30 PM 4.43% 0.64% Saturday (11/18/2017) 1 Waugh Chapel Road and Maytime Drive 11:30 AM % Waugh Chapel Road and Symphony Lane 11:30 AM % Waugh Chapel Road and Silver Way 11:30 AM % Waugh Chapel Road and Summerfield Road 11:30 AM % Waugh Chapel Road and New Market Lane 11:30 AM %

11 TRANSPORTATION FACILITY PLANNING WAUGH CHAPEL ROAD-EXISTING CONDITIONS REPORT Figure 5. Existing (2017) Weekday Peak Hour Volume 8
12 TRANSPORTATION FACILITY PLANNING WAUGH CHAPEL ROAD-EXISTING CONDITIONS REPORT Figure 6. Existing (2017) Saturday Peak Hour Volume 9
13 A summary of the weekday and Saturday peak hour volumes is provided below. Weekday peak hours The AM peak hour (7:15 AM to 8:15 AM) and PM peak hour (5:30 PM to 6:30 PM) are consistent throughout the study corridor except for a minor variation at Waugh Chapel Road and Maytime Drive for which the PM peak hour is (5:15 PM to 6:15 PM). During the PM peak period volumes are steady for a longer period, from 4 PM to 6:30 PM, while peak AM volumes concentrate within the 60-minute peak hour. The peak hour factors reflect this. Heavy vehicle percentage is higher in the AM peak hour than PM peak hour. Pedestrian and bicycle volumes are low at the study intersections during the AM and PM peak periods; however, pedestrian activities related to school occur after the AM peak period (6:30 to 8:30 AM), and therefore were not captured in the traffic count data. The highest pedestrian activities occurred at the intersection of Waugh Chapel Road and New Market Lane. There were 3 pedestrians counted during the PM peak period, and none of them were crossing the road during the PM peak hour of 5:30 to 6:30. There were no more than two bicyclists counted at any given intersection during the AM or PM peak period. Peak hour volumes are more directional in PM peak hour than in AM peak hour. The highest through volume on Waugh Chapel Road was 1,132, traveling westbound at the intersection with Summerfield Road during PM peak; the highest left turn volume from Waugh Chapel Road is the westbound left turn onto Symphony Lane, with a volume of 234 during the AM peak hour; the eastbound right-turn volumes onto New Market Lane are also significant, with 225 and 330 vehicles during AM and PM peak hour, respectively. The highest turning volumes from a side street onto Waugh Chapel Road are the left and right turns from New Market Lane with volumes of 401 and 254, respectively during the PM peak hour. Saturday peak hour The mid-day peak hour is from 11:30 AM to 12:30 PM. The heavy vehicle percentage is higher than the PM peak while lower than AM peak. The mid-day peak hour intersection volumes are comparable to AM peak hour volumes and lower than PM peak hour volumes. Pedestrian and bicycle volumes are low at the study intersections; the highest pedestrian activities occurred at the intersections of Waugh Chapel Road and Maytime Drive and Waugh Chapel Road and New Market Lane. These intersections both had two pedestrians counted during the Saturday midday period. There were no more than two bicyclists counted at any given intersection during the Saturday peak period. ROADWAY SEGMENT VOLUME SPEED AND CLASSIFICATION DATA 48-hour classification and speed data were collected from Wednesday to Thursday (November 15 to 16, 2017) on Waugh Chapel Road between Maytime Drive and Symphony Lane and between Silver Way and Summerfield Road. The average 24-hour volumes and 85 th -percentile speeds over the two days are shown in Figure 7. The directional 24-hour volumes on Waugh Chapel Road range from approximately 8,600 vehicles to 11,250 vehicles. Comparing to the peak hour volumes, the peak-to-daily ratio (k-factor) is approximately 0.1. The average 85 th -percentile speeds on Waugh Chapel Road over the two days are higher between Maytime Drive and Symphony Lane than west of Summerfield Road, potentially due to higher volumes and more truck traffic east of the concrete plant driveway. Figure 8 and Figure 9 show the average hourly volumes by time of day for the two segments. Raw classification and speed data is provided in Appendix A. 10

14 TRANSPORTATION FACILITY PLANNING WAUGH CHAPEL ROAD-EXISTING CONDITIONS REPORT Figure 7. Existing Average Daily Volumes and 85th Percentile Speed The following is a summary of the classification and speed data. PM peak period volumes are higher than AM peak period. The speeds are higher in the western segment, potentially due to lower volumes. The 85th percentile speeds at both segments in both directions exceed the posted speed limit of 35 mph. The percentage of traffic traveling between 50 to 55 mph was 5% of the 24-hour volume for the eastbound direction between Maytime Drive and Symphony Lane while such occurrence at the other segments was only 1% over a 24-hour period. 85th percentile speed for eastbound travel between Maytime Drive and Symphony Lane during the AM peak hour was comparable to that over the 24-hour period while for the other segments, the peak hour 85th percentile speeds were lower than the daily 85th-percentile speeds. It was noted that the 85th percentile speeds between Maytime Drive and Symphony Lane were significantly higher than the post speed limit of 35 mph. 11
15 1200 Waugh Chapel Road (Maytime Drive to Symphony Lane) 1000 Volume Time of Day Eastbound Westbound Figure 8. Existing Volume by Time of Day (Waugh Chapel Road, Maytime Drive to Symphony Lane) 1200 Waugh Chapel Road (Symphony Lane to New Market Lane) Volume :00 1:00 2:00 3:00 4:00 5:00 6:00 7:00 8:00 9:00 10:00 11:00 12:00 13:00 14:00 15:00 16:00 17:00 18:00 19:00 20:00 21:00 22:00 23:00 Time of Day Eastbound Westbound Figure 9. Existing Volume by Time of Day (Waugh Chapel Road, Symphony Lane to New Market Lane) 12
16 TRAVEL TIME DATA Travel time runs were collected on Wednesday, January 10, and Thursday, January 11, AM travel time runs were performed between 7:30 and 8:30 AM and PM travel time runs were performed between 5:15 and 6:15 PM. The field data contains 4 to 6 runs of data for each segment and time period. Table 2 shows the resulting averages of the travel times. In general, there was very little delay along the corridor with the exception of an approximate 15-minute period between 7:50 and 8:05 AM in the eastbound direction at the intersection of Waugh Chapel Road and Symphony Lane. This delay is attributed to the traffic associated with the School of the Incarnation. It should be noted that the community has voiced concerns to the County that westbound left-turn queues into the School of the Incarnation sometimes extend to Silver Way/Macmullen Drive. Although this was not observed in the field during AM peak period during any of the field visits, it likely occurs for short periods before school on days where there is an issue with the school drop off procedure at the School of the Incarnation. Table 2. Travel Time Summary Route Distance (miles) Travel Time [sec] Delay [sec] AM Peak Hour Field Travel Time Runs Stops Average Speed* [mph] Travel Time [sec] Delay [sec] PM Stops Average Speed* [mph] Eastbound Westbound *The estimation of average travel speed accounted for delay and stop time at the intersections. HISTORICAL TRAFFIC DATA To understand the changes in traffic volumes and patterns over time, annual average daily traffic (AADT) volumes were examined for 2010 through 2016 the most recent data available. AADTs are determined to provide an estimate of the daily bi-directional volumes at specific locations or along specific roadway corridors. AADT data was obtained from the Maryland State Highway Administration (MSHA) Statewide AADT Points website. A summary of the historical AADT volumes is provided in Table 3. The trend of the AADT from 2012 to 2016 is illustrated in Figure 9. Table 3: Historical AADT Data Road Annual Average Daily Traffic Volumes (vehicles per day) Waugh Chapel Road 18,441 18,522 17,500 17,541 17,492 17,953 18,870 Piney Orchard Parkway Crain Highway (Route 3) 25,152 24,750 24,551 24,602 24,850 25,501 25,992 63,191 64,042 67,100 62,251 62,062 65,490 66,731 13


17 Figure 10. Historical Average Daily Traffic Volumes The data shows that traffic volumes on Waugh Chapel Road remained steady until 2012 and The reconstruction of the MD 3/Waugh Chapel Road intersection may have contributed to the volume dip during that time. Traffic volumes began to show growth in 2015 and surpassed 2011 volumes in OBSERVATIONS OF TRAFFIC AND SAFETY OPERATIONS Field observations were conducted January 10-12, The field observations were focused on queue lengths and duration, traffic flow, and bicycle and pedestrian activities and facilities. Operational issues, driver behaviors, pedestrian activity, and unsafe activity (e.g. school drop-off or illegal parking) were documented. Information gathered during the field observations was used to validate outputs from traffic analysis software programs used to analyze existing conditions. Notable observations from the site visits are summarized below. Traffic Operations and Traffic Control Devices Operational issues along the corridor were at a minimum. Pavement markings along the corridor are inconsistent. There are many approaches that have no pavement marking arrows to designate lane use. The only way to decipher lane use is by the signs on the mast arm, if present. Lane use signing at intersections is not present at all intersections throughout the corridor. The merge area on westbound Waugh Chapel Road just to the west of the intersection with New Market Lane where the number of through lanes reduces from two lanes to one lane has only one merge arrow. This short merge area, just 450 feet past the intersection, can cause some operational issues along the corridor to drivers unfamiliar with the corridor. 14


18 Speed feedback signs appear to be effective in reducing speeds in the vicinity of the signs; however, drivers resume to higher speeds after passing the signs. School zone speed limit is the same as the posted speed limit. Safety Issues Speeding o The 85th percentile speeds as shown in Figure 7 show that most vehicles are traveling at speeds greater than 40 mph, including speeds of 45 mph or greater near Maytime Drive. The posted speed limit is 35 mph. This was confirmed when performing field observations. For the most part, while vehicles can traverse the entire corridor without stopping at a traffic signal, turning vehicles and stopping vehicles in queues contribute to the rear-end crashes along with speeding. o Westbound vehicles traveling the segment between Summerfield Road and Silver Way/Macmullen Drive often travelled faster than the posted speed limit along a curved horizontal alignment causing the speed feedback sign to flash. Parking o Four Seasons Elementary School is located just to the west of the intersection of Waugh Chapel Road and Maytime Drive. Just before school starts and right after school ends the wide shoulder west of Maytime Drive is used as a school pick up and drop off zone. As a result, there are young children and their parents walking in this area. Heavy Vehicles o During the times that Four Seasons Elementary School and the School of the Incarnation are starting and dismissing, there were school buses present dropping off and picking up students. o During AM peak and mid-day hours, the main source of heavy vehicle traffic observed along the corridor is due to the Waugh Chapel Concrete Plant. This Plant provides readymix concrete, sand, gravel, and other construction supplies throughout the east coast, contributing to a fair amount of truck traffic coming in and out of their driveway on Waugh Chapel Road located between Silver Way and Summerfield Road. Multimodal Activity Pedestrians and Bicyclists o During peak hour observations, there were only a few pedestrians along the corridor. The pedestrians that were observed walking from one end of the corridor to the other would use the pedestrian facilities that were present when available. However, when they were traversing segments that did not provide pedestrian facilities, they walked along the shoulder. Additionally, when there was no shoulder present, they would walk along the roadway. Similarly, there were very few bicyclists, and those riding along the corridor generally used the shoulders where available, and the travel lanes in areas with little-tono shoulders. 15
19 Transit o The County is now running a flex bus service between Crofton-Waugh Chapel-Odenton. Bus stops are at the same places along Waugh Chapel as the prior Regional Transportation Agency (RTA) stops, but residents can call to ask for deviation from the route. 16

20 Chapter 3 Roadway Geometrics and Traffic Control Devices Waugh Chapel Road is classified as a minor arterial and generally has one through lane in the east and westbound directions with exclusive turn lanes at some intersections along the corridor. Roadway geometric and traffic control device data was collected in early January Observations included the following: Travel lane width Sidewalk and shoulder width Horizontal curve measured by Ball Bank indicator for Waugh Chapel Road east and west of Silver Way/Macmullen Drive Sight distance measurements for the intersection of Silver Way/Macmullen Drive and Waugh Chapel Road Right-of-Way and Traffic Control Devices TRAVEL LANE, SHOULDER, AND SIDEWALK WIDTHS Travel lane, turn lane, and shoulder widths vary throughout the corridor. Through lanes generally measured 11 to 12 feet, while some turn lane widths were as narrow as 7.5 feet. The eastbound approach of Waugh Chapel Road at Maytime Drive has a 7.5 ft right turn lane onto Maytime Drive. Similarly, both the eastbound right turn lane at Symphony Lane and the westbound right turn lane at Silver Way/Macmullen Drive are 9.5 ft. These narrow turn lanes can become an operational issue if drivers slow down to turn but do not fully enter the turn lane, thus partially remaining in the through lanes to make turns. This could potentially cause through traffic delay and rear-end crashes. Locations with narrow shoulders or no shoulder were also prevalent along the corridor. The locations mentioned above with narrow turning lanes have no shoulder present. The narrow lanes replaced the shoulder on that side of the roadway for the length of the turn bay. Additionally, there are little to no shoulder present at the following locations: Eastbound Just east of Maytime Drive for approximately 25 feet East of Symphony Lane until the eastern terminus of the guardrail, approximately 550 feet (there is a sidewalk in this area) West of Main Chapel Way (where the curb and gutter section begins) Westbound Prior to the eastern-most entrance to the senior living center, in the open-section portion of the roadway Approaching Symphony Lane for a distance of approximately 180 feet Leaving Symphony Lane for a distance of approximately 370 feet 17


21 HORIZONTAL CURVE MEASUREMENT The Ball-Bank Indicator Method is based on field driving tests to record angular readings using a ballbank indicator and a speedometer. The simplicity of the construction and operation of this device has led to its acceptance as a guide to determine advisory speeds for changes in horizontal alignment. However, there are varied criteria for establishing the curve advisory speed based on ball-bank indicator readings. These varied criteria are shown in Table 3 below. Table 3. Ball-Bank Indicator Criteria Curve Speed (mph) Moyer & Berry 1940 AASHTO Chowdury & Warren 1991 BAI (99) MUTCD 2003 MdMUTCD 2011 ITE Truck The readings from the ball-bank tests in the field around the horizontal curve surrounding the intersection of Waugh Chapel Road and Silver Way/Macmullen Drive indicated a maximum of 5 traveling westbound and a maximum of 7 traveling eastbound. Both results were not high enough for a speed limit of 35 mph to be of concern. Therefore, the posted speed at this location appears to be appropriate with regard to horizontal curvature. SIGHT DISTANCE Figure 11 shows the results of sight-distance measurements at the intersection of Waugh Chapel Road with Silver Way/Macmullen Drive. The average of the daily 85 th percentile speed, 45 mph, and the values in Appendix J, Sight Distance at Intersection, of the Anne Arundel County Design Guidelines were used to determine sight-distance adequacy. As shown in Table A on Figure 11, sight distances for traffic turning left and right out of Macmullen Drive are not adequate. This could be partially due to landscaping planted along the south side of Waugh Chapel Road as part of the Chapel Creek Village residential development currently under construction. Table B on Figure 11 indicates that sight distances for cross traffic are appropriate for all vehicle types at Sliver Way. Passenger vehicles turning left and right out of Silver Way have adequate sight distance; however, singleunit and WB-50 trucks do not. 18
22 RIGHT-OF-WAY AND TRAFFIC CONTROL DEVICES Figure 12 illustrates general right of way along the corridor and includes an inventory of ground mounted signs and approximate guardrail locations. As previously mentioned, there is inconsistent use of Intersection Lane Control signs and arrow pavement markings along the corridor. Examples include: Macmullen Drive/Silver Way intersection o Westbound Waugh Chapel Road right turn lane not signed or marked o Eastbound Waugh Chapel Road left turn lane not signed or marked Symphony Lane/Silver Way intersection o Westbound Waugh Chapel Road left turn lane advance and intersection lane control signs and left turn arrow pavement markings o Eastbound Waugh Chapel Road advance intersection lane control sign indicating separate left, through, and right turn lanes and pavement marking arrows only for the right turn lane While neither intersection lane control signs nor turn arrow pavement markings are required by the MdMUTCD, inconsistency in signing and marking practices within a corridor can lead to driver confusion. Consistent use of signs and pavement markings will be addressed in the next phase of this study. 19

23 Figure 11. Sight Distance Analysis 20

24 Figure 12. Right-of-Way and Signage 21
25 Chapter 4 Traffic Operations Evaluation MEASURES OF EFFECTIVENESS Traffic analysis was performed using Synchro 9, a macroscopic analysis tool that uses Highway Capacity Manual (HCM) methodologies to calculate operational performance at signalized and unsignalized intersections. Highway Capacity Software (HCS) was used to analyze operational performance for the two mid-block segments where volume and speed data were collected. The following measures of effectiveness (MOE) were considered for this study: Movement/approach/overall intersection delay; Movement/approach/overall intersection Level of Service (LOS); and 95 th -percentile movement/approach queues, based on Synchro HCM outputs Roadway segment LOS The Highway Capacity Manual (HCM) defines LOS for signalized and unsignalized intersections as a function of average vehicle control delay. LOS may be calculated per movement or per approach for any intersection configuration, but overall intersection LOS is defined for signalized and all-way stopcontrolled intersections only. Overall intersection LOS is not reported for two-way stop-controlled intersections. Table 4 and Table 5 summarize the different LOS designations for both signalized and unsignalized intersections, respectively, based on vehicle delay. The existing conditions LOS, delay, and queuing analyses for the AM, PM, and Saturday peak hours are discussed in the following sections. Level of Service (LOS) Table 4: LOS and Delay Thresholds, Signalized Intersections Average Control Delay (seconds) General Description A 10 Free flow B Stable flow (slight delays) C Stable flow (acceptable delays) D Approaching unstable flow (tolerable delay, occasionally wait through more than one signal cycle before proceeding) E Unstable flow (intolerable delay) F 80 Forced flow (congested and queues fail to clear) Table 5: LOS and Delay Thresholds, Unsignalized Intersections Level of Service (LOS) A B C D E F Average Control Delay (seconds)

26 In addition to the LOS and delay MOEs, 95 th -percentile queues per movement also were evaluated. 95 th percentile queues are particularly useful for traffic operations evaluation, as they represent the maximum queue lengths that are anticipated for 95% of the time at each location while removing potential outliers that may skew the analysis results. TRAFFIC OPERATIONAL RESULTS Synchro Results The existing conditions overall intersection delay and LOS outputs are summarized in Table 6. The existing conditions delay and LOS by movement is provided in Synchro HCM reports in Appendix B. Table 6. Existing (2017) Peak Hour Intersection Delay and LOS ID Intersection Traffic Control Weekday AM Peak Hour Weekday PM Peak Hour Saturday Midday Peak Hour Delay LOS Delay LOS Delay LOS 1 2 Waugh Chapel Road/Maytime Drive Waugh Chapel Road/Symphony Lane Signalized 11.2 B 9.7 A 7.7 A Signalized 40.7 D 10.1 B 4.3 A 3 Waugh Chapel Road/Macmullen Drive Two-way Stop* 57.6 F F 55.1 F 4 Waugh Chapel Road/Summerfield Road Two-way Stop* 61.0 F F 27.8 D 5 Waugh Chapel Road/New Market Lane * Worst movement was reported for two-way stop controlled intersection. Signalized 13.7 B 23.3 C 26.2 C As shown in Table 6 and Appendix B, the signalized intersections currently operate at overall LOS C or better except for Waugh Chapel Road and Symphony Lane in AM. The eastbound through movement on Waugh Chapel Road at Symphony Lane operates at LOS F due to heavy opposing left-turn volumes. The rest of mainline through and turning movements on Waugh Chapel Road operate at acceptable LOS during AM and PM peak hours. Side streets experience more delays, particularly at New Market Lane/Wigeon Way, Silver Way/Macmullen Drive, and Symphony Lane, where side streets operate at LOS E/F. New Market Lane has large left-turn and right-turn volumes during PM peak hour. Turning traffic from Silver Way/Macmullen Road must wait a long time for a sufficient gap to turn, although the turning volumes from side streets are low. The delay on Waugh Chapel Road is primarily attributed to the signalized intersections. The intersection of Symphony Lane and Waugh Chapel Road is a major source of delay during AM peak hour because the heavy eastbound commuting trips (520 vph) 23
27 TRANSPORTATION FACILITY PLANNING WAUGH CHAPEL ROAD-EXISTING CONDITIONS REPORT are stopped by the westbound left-turn traffic (234 vph) into the School of the Incarnation and the Symphony Lane approach requires additional time to clear the queue of vehicles leaving the school. During the Saturday peak hour, the New Market Lane approach experiences high delay (LOS E) while Waugh Chapel Road operates at acceptable LOS. This is due to the higher number of vehicles exiting the shopping center throughout the day. The 95th percentile queue length for each movement at the intersections was reported from SimTraffic and compared with available storage for turn lanes and between adjacent intersections. During AM peak, the eastbound through traffic queue on Waugh Chapel Road at Symphony Lane extends close to the adjacent intersection at Maytime Drive and often blocks the eastbound right-turn lane. The northbound New Market Lane queue extends to the adjacent driveway in the shopping center during PM and Saturday peak hours. A few locations with notable 95th percentile queues are as follows: AM Peak Hour Eastbound through queue on Waugh Chapel Road at Maytime Drive measures at 150 feet Eastbound through queue on Waugh Chapel Road at Symphony Lane extends close to Maytime Drive (950 feet) Northbound right-turn queue from Symphony Lane to Waugh Chapel Road is at storage capacity PM Peak Hour Eastbound and westbound through queues on Waugh Chapel Road at Maytime Drive measure at 200 feet, blocking turn lanes occasionally Northbound left-turn queue extends beyond the adjacent driveway on New Market Lane Saturday Peak Hour Northbound left-turn queue extends beyond the adjacent driveway on New Market Lane The results of delay/los and 95th percentile queues by movement at each intersection are reported in Appendix B. 24
28 HCS Results HCS Two-Lane analysis methodology was used to evaluate the performance of the three segments of Waugh Chapel Road. The extents of these evaluation segments are listed below: Maytime Drive to Symphony Lane Symphony Lane to Silver Way/Macmullen Drive Silver Way/Macmullen Drive to Summerfield Road The existing conditions roadway segment LOS results are provided in Table 7. All three segments operate at LOS D/E. The peak hour demand on Waugh Chapel Road is heavy for a two-lane facility. The segments east of Symphony Lane operate worse than the western segment during the AM peak due to higher demand and truck traffic. During PM peak all segments operate at LOS E for both directions. Table 7: HCS Two-Lane Peak Hour LOS Results Peak Hour Direction Segment 1 Segment 2 Segment 3 Maytime Drive to Symphony Lane Symphony Lane to Silver Way/Macmullen Drive Silver Way/Macmullen Drive to Summerfield Road AM Eastbound D E E Westbound D D E PM Eastbound E E E Westbound E E E *Speed data from segment 1 and 3 was used to estimate the segment 2 speed for the HCS analysis. The HCS analysis worksheet is provided in Appendix C. SIGNAL WARRANT ANALYSIS A signal warrant analysis was performed for the intersection of Waugh Chapel Road at Silver Way/Macmullen Drive. All eight criteria were evaluated based on the traffic count and crash data collected and signalization is not currently warranted at this intersection. This is primarily because of the low volumes on the side streets. However, this may change when Chapel Creek Village is fully constructed and occupied. There are several rear-end crashes at the intersection, which may be attributable to the side street movements, although no crashes were reported that directly involved vehicles coming out of side streets. The number of crashes per year at this intersection from 2014 to 2016 does not meet the crash experience warrant. Pedestrian volumes are low and there are no observed school crossing activities at this intersection. The signal warrant analysis worksheet is provided in Appendix D. 25

29 Chapter 5 Multimodal Transportation This chapter describes the existing conditions of the study area related to the connectivity and conditions of pedestrian and bicycle facilities and public transportation. The information presented in this chapter is based on a combination of sources including previous studies, Geographic Information Systems (GIS) from Anne Arundel County, and visual observation in the field. The three main previous studies are the 2013 Anne Arundel Pedestrian and Bicycle Master Plan, the 2003 Anne Arundel County Pedestrian and Bicycle Master Plan, and the Summerfield Village Traffic Impact Study. The following sections provide details and maps pertaining to the various modes. PEDESTRIAN AND BICYCLE FACILITIES The 2013 Pedestrian and Bicycle Master Plan (PBMP), which was created as an update to the 2003 Pedestrian and Bicycle Master Plan, identifies improvement opportunities that increase the potential for safe trip-making by walking and bicycling. These opportunities include both infrastructure and noninfrastructure improvements that are sorted by a tier ranking system. The following summarizes conditions of bicycle and pedestrian facilities in the study area, as well as proposed improvements suggested in the 2013 Pedestrian and Bicycle Master Plan. Sidewalks Policy outlined in the 2013 PBMP stresses the importance of prioritizing sidewalk improvements to ensure that streets have sidewalks on at least one side of the street. As shown in Figure 13, sidewalks are isolated and disconnected on Waugh Chapel Road from Maytime Drive to Main Chapel Way. While the majority of the local street network in the communities outside the study area have connected sidewalks on either or both sides of the street, this represents a critical gap in the pedestrian network, which presents challenges to pedestrians who desire to walk to the Waugh Chapel Village shopping center. Major pedestrian attractors in the study area also include Four Seasons Elementary School near Maytime Drive and School of the Incarnation near Symphony Lane. Constructing sidewalk along the south side of Waugh Chapel Road from Maytime Drive to Summerfield Road was identified as a tier three project in the 2013 PBMP. Pedestrian and bicycle improvements on MD 3 from Waugh Chapel Road to Defense Highway also have been identified as a tier one project. Bicycle Facilities This section describes the facilities and condition of biking in the study area. Bicycle facilities in the study area consist of both roadway shoulder with shared lane marking for biking and travel lanes shared by bicycle and motor vehicle. The shared lane is observed at locations such as intersection approaches, where the shoulder becomes right-turn lane, and segments where shoulder is not available. Figure 13 shows the type of bicycle facilities in the study area. 26

30 The lack of dedicated, consistent, and continuous bicycle facilities presents challenges to the bicyclists in the study area. The biggest safety concerns are at locations where bicyclists must share the road with vehicular traffic. This occurs in the segment east of the Silver Way intersection as well as all intersection approaches. In addition, the roadway shoulder is truncated by choker islands (east of Silver Way and Waugh Chapel Road intersection) which could potentially force biking on the roadway. Constructing Waugh Chapel Road bicycle lanes from Piney Orchard Parkway to MD 3 was listed as a tier two project in the 2013 PBMP. Waugh Chapel Road was described as a feasible route for bicycle lanes. Figure 13. Existing Bike and Pedestrian Facilities 27
31 Trails Washington, Baltimore & Annapolis (WB&A) Trail crosses Waugh Chapel Road at Old Waugh Chapel Road north of the study area. The at-grade crossing is currently unsignalized with a median refugee area. The 2013 PBMP identified WB&A trail access improvement to enhance access to WB&A Trail where Old Waugh Chapel Road bridge crosses the trail. TRANSIT Transit and school bus routes Although there are no fixed-route local or regional bus service in the area, the County is offering a Call and Ride service in this area. Waugh Chapel Road services a few school bus routes. MARC station The Odenton MARC train station is located approximately 3 miles from the Maytime Drive intersection, the western terminus of the Waugh Chapel study area. The Odenton station provides daily train service to various locations, including Washington DC s Union Station and Baltimore s Penn Station, via the Penn Line. It a popular commuter route, with parking at the Odenton station often beyond capacity. 28
32 Chapter 6 Safety Analysis CRASH DATA Crash data was used to evaluate safety conditions and crash patterns throughout the study area. This data was obtained from the State Highway Administration of Maryland Department of Transportation. The data includes crashes from January 1, 2014 to August 31, 2017 by mile marker. It is noted that the crash analysis included segments of Waugh Chapel Road from MD 3 to Autumn Gold Drive, just past Four Seasons Elementary School. According to the crash data, MD 3 represents mile marker 0.00 and Autumn Gold Drive represents mile marker 1.50 on Waugh Chapel Road. COLLISION FREQUENCY AND SEVERITY Between January 2014 and August 2017, there were 70 total crashes in the study corridor. A summary of the crashes by year and by injury is shown in Table 8. There were no fatalities during the study period, but two fatal collisions were reported in the study corridor since The two fatalities happened on the curved roadway segment near the unsignalized Silver Way intersection (one to the east and the other to the west) during the winter (January and February). Approximately 6% of the crashes involved impaired drivers. Table 8: Crash Severity by Year Year Fatalities Injuries No Injuries Total Total Note: 2017 data is partial and unedited. COLLISION TYPES Figure 14 and Figure 15 show crash types that were analyzed. Most of the crashes happened during the weekday (55) compared to the weekend (15). There were no bicycle or pedestrian collisions reported. The most prevalent crash frequencies were near intersections. Mile marker 1.12 near Symphony Lane/Silver Way and Waugh Chapel Road had a total of 5 crashes, and mile marker 0.17 near New Market Lane/Wigeon Way and Waugh Chapel Road had a total of 19 crashes. There were many rear end, head on, and angle crashes near these intersections. 29


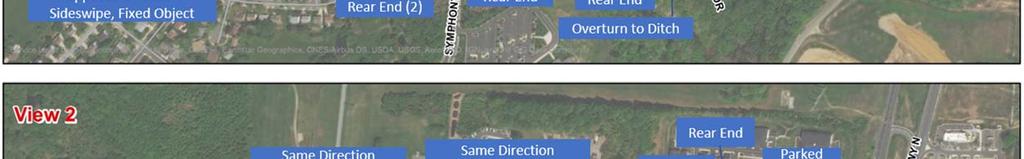
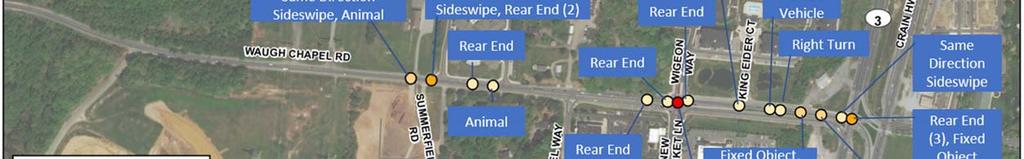

33 Figure 14. Crash Patterns by Study Intersections 30
34 4% 3% Angle Meets Left Turn 24% Same Direction Rear End Same Movement Angle 37% Head On Head On Left Turn Opposite Direction Sideswipe Same Direction Right Turn 7% Same Direction Sideswipe Single Vehicle 3% 1% 6% 2% 13% Other Figure 15: Crash Types Along the entire study area, rear end, single vehicle, and angle crash types were the most prevalent. Single vehicle accidents consist of those with fixed objects, animals, driving off road, parked vehicles, and other non-collision accidents. These crashes were mainly concentrated around intersections and driveways. Table 9 summarizes the collision types by intersection. There was a total of 67 crashes that were intersection related out of the 70 total crashes within the study area. Crashes within 250 feet of the intersection or within turning lanes were assumed to be intersection related crashes. The following summary highlights crash patterns at intersections: Majority of the rear end crashes happened at New Market Lane/Wigeon Way (7 crashes), followed by Symphony Lane (5 crashes), and Silver Way/Macmullen Drive (3 crashes). The rearend crashes at Silver Way/Macmullen Drive are attributable to a combination of factors, including the lack of westbound left-turn lane, speeding, and the horizontal alignment approaching the intersection in the westbound direction on Waugh Chapel Road. Most angle crashes occurred at New Market Lane/Wigeon Way (8 crashes). There were also three head on left turn crashes at this intersection, comprising the five head-on crashes in the corridor (the other two occurred near Symphony Lane). This intersection has heavy left-turn volumes and protected left turn phases are provided for three out of the four movements. Upon further review in the field, a protected left-turn phase may be needed for the southbound approach as well. At the intersection of Symphony Lane and Waugh Chapel Road, protected/permissive left-turn phases are provided on Waugh Chapel Road. Review of turn phasing on Waugh Chapel Road and the side streets may be needed to determine how best to accommodate heavy right and left turn volumes on several of the approaches to allow for safe turning maneuvers, particularly in the morning. 31
35 There were 5 single vehicle crashes near Maytime Drive and Waugh Chapel Road. All these collisions were hitting fixed objects near the intersection. This section has a straight alignment and the 85 th percentile speeds in this segment exceed the speed limit by more than 10 mph. Speeding may contribute to vehicles running off the road. Majority of the single vehicle crashes occurred between Maytime Drive and Silver Way/Macmullen Drive. Roadway horizontal curves and speeding are contributing factors. When developing improvements, this information will be taken into consideration. 32
36 Table 9: Intersection Collision Types Intersection Angle Meets Left Turn Same Direction Rear End Same Movement Angle Head On Head On Left Turn Opposite Direction Sideswipe Same Direction Right Turn Same Direction Sideswipe Single Vehicle Maytime Dr Symphony Ln Silver Way and Macmullen Dr Driveway into Waugh Chapel Center - West Driveway into Waugh Chapel Center - East New Market Ln/Wigeon Way King Eider Ct Crain Hwy (MD 3) Total Other Total 33
37 For the study area, the following crash trends also were reported during 2014 to 2017: 50% 17% 33% 12 crashes (17%) occurred during the AM peak period and 23 collisions (33%) during the PM peak period. There was an equal amount of crashes that happened during the peak periods as there were during the off-peak period (35 crashes, 50%). AM Peak PM Peak Off Peak Figure 16: Time Period 9% 6% 7% 78% 55 crashes (78%) occurred during clear/cloudy weather conditions, 6 (9%) during the rain, 4 (6%) during snow/sleet conditions, and 5 crashes (7%) during unknown conditions. The majority were during clear/cloudy conditions, indicating weather was not a major contributing factor. Clear or Cloudy Rain Snow or Sleet NA Figure 17: Weather Condition 9% 3% 4% 68% 16% Wet Dry Snow Ice NA 48 crashes (68%) occurred during dry road conditions, 11 (16%) during wet road conditions, 6 (9%) during ice conditions, 3 (4%) during snow conditions, and 2 crashes (3%) occurred during other road conditions. This indicates that roadway surface conditions are not contributing factors to crashes. Figure 18: Road Condition 34
38 Chapter 7 Findings and Next Steps SUMMARY OF FINDINGS The following summarizes the key findings of the existing conditions analysis for the Waugh Chapel Road study corridor: The level of service at the signalized study intersections along Waugh Chapel Road operate within adequate levels of service during peak hours. According to Synchro analysis, the two unsignalized intersections operate at LOS F during the AM and PM peak hours and LOS D and F during the Saturday peak hour. The failing level of service is due to the difficulty that the side street vehicles have in finding gaps to enter Waugh Chapel Road. Field observations reveal minimal queues at the unsignalized intersections. The roadway segments studied along Waugh Chapel Road operate at LOS D/E. The peak hour demand on Waugh Chapel Road is heavy for a two-lane facility. The segments east of Symphony Lane operate worse than the western segment, Maytime Drive to Symphony Lane, during the AM peak due to higher demand and truck traffic. During PM peak, all segments operate at LOS E for both directions. Field observations did not reveal issues with level of service along Waugh Chapel Road. There was very little delay along the corridor during the peak periods, with the exception of an approximately 15-minute period between 7:50 and 8:05 AM in the eastbound direction at the intersection of Waugh Chapel Road and Symphony Lane. This delay is attributed to the traffic associated with the School of the Incarnation. Under existing conditions, the intersection of Silver Way/Macmullen Drive and Waugh Chapel Road does not warrant a traffic signal. Speeding in the corridor, based on the 85 th percentile speeds collected, in conjunction with roadway horizontal alignment may present potential risk to safety at the intersections as well as future proposed pedestrian and bicycle improvements. Reported crashes along the corridor are centered around the intersections and driveways. Excluding the crashes near MD 3, crashes at the intersection of New Market Lane/Wigeon Way represented over 35% of the crashes in the corridor and most of the rear-end and angle crashes. Most of the single vehicle crashes occurred between Maytime Drive and Silver Way/Macmullen Drive. Roadway horizontal curves and speeding are contributing factors. The lack of connected sidewalks on Waugh Chapel Road in the study area is a critical gap to address in this study as the roadway is transformed. Dedicated bicycle facilities or shared use paths are needed on Waugh Chapel Road to provide protection for bicyclists and connectivity for the bicycle network linking to the regional trail and transit system. NEXT STEPS Following the final existing conditions report, the study team will develop future volumes for the study corridor. The team will then work with the County and the community to develop evaluation metrics and begin to develop concepts for improvements to address deficiencies along the study corridor. 35
39 Chapter 8 Future No Build Conditions This chapter documents the future (2040) No Build traffic volume forecast and traffic operations analysis. The study team chose to use year 2040 as the future analysis year for this study to develop improvement alternatives that could accommodate anticipated traffic growth while serving the multimodal needs on Waugh Chapel Road. The findings from the future No Build analysis will be used to identify traffic operational issues and needs and to provide a basis for developing improvement alternatives. The traffic analyses include assessments of typical weekday AM and PM peak hour and Saturday mid-day peak hour operations for the future year of TRAFFIC FORECAST The study team obtained the Baltimore Metropolitan Council (BMC) regional travel demand model (Version 44C) (hereafter referred to as BMC model) for developing traffic growth rates. The BMC model was used to generate baseline (2016) and future (2040) link traffic volumes. Traffic growth rate(s) for the study corridor and major crossing and parallel roadways were derived from BMC model link volumes. In addition, the land use data associated with the BMC model was reviewed in conjunction with the traffic growth rates by the study team. The traffic growth rates on Waugh Chapel Road are projected to range from 1% to 2% with higher growth anticipated in the off-peak directions (e.g. westbound in AM and eastbound in PM). Upon examining the land use data, the residential area surrounding the study corridor has minimal growth while the biggest growth in population and employment (approximately 10% annually) is projected to take place in the planned Odenton Town Center near the study area. The traffic forecasts from BMC model are consistent with the projected land use growth. A brief model validation was conducted to compare the BMC link volumes with daily volumes collected either from the field or from SHA. A screenline was selected to cross Waugh Chapel Road and the parallel east-west roadway MD 175. Traffic count data was not available for Conway Road or Patuxent Road, which were then excluded from the screenline. The BMC model link volumes on Waugh Chapel Road were post-processed by loading more traffic from residential area south of the study corridor to Waugh Chapel Road instead of directly to MD 3 given the large traffic analysis zone (TAZ) and oversimplification of side streets. The screenline volume comparison shows that BMC model volumes were 11% higher than the daily counts, thereby meeting the threshold established in the Federal Highway Administration (FHWA) Model Reasonableness Check. The BMC model was observed to assign more volume to MD 175 when compared to traffic counts, which is likely due to the higher posted speed limit on MD 175 compared to Waugh Chapel Road. Kimley-Horn presented the traffic growth projection and land use data analysis to the study team. The study team determined that that an average annual growth rate of 1% would most properly represent the anticipated growth on Waugh Chapel Road in the peak direction of travel while off-peak direction of travel would experience more growth (close to 2%). For Saturday mid-day traffic projection, 1% growth rate was proposed for both directions of travel on Waugh Chapel Road. The County approved the proposed growth rate(s) prior to developing future traffic volumes. Kimley-Horn grew the existing intersection traffic volumes using the approved traffic growth rate and balanced the traffic volumes as needed throughout the study corridor. Trip generation data for Summerfield Village was used to estimate the side street volumes in 2040 because existing counts represent only partially developed and occupied units. The projected 2040 No-Build AM and PM peak hour and Saturday mid-day peak hour traffic volumes for the study area are summarized in Figure 19 and Figure 20, respectively. It was assumed that 2040 traffic demand would change under the build scenario 36
40 due to proposed new street connections as well as multimodal improvements; however, intersection spot improvements would not trigger traffic demand change in


41 Figure No Build Weekday Peak Hour Volumes 38

42 Figure No Build Saturday Peak Hour Volumes 39
TRANSPORTATION FACILITY PLANNING Waugh Chapel Road Maytime Drive to New Market Lane
 July 24, 2018 TRANSPORTATION FACILITY PLANNING Waugh Chapel Road Maytime Drive to New Market Lane DPWandYOU.com Making a difference, together Meeting Agenda Purpose of the project Overview of work conducted
TRAFFIC IMPACT ANALYSIS
 TRAFFIC IMPACT ANALYSIS FOR THE CHAMPAIGN UNIT#4 SCHOOL DISTRICT PROPOSED HIGH SCHOOL (SPALDING PARK SITE) IN THE CITY OF CHAMPAIGN Final Report Champaign Urbana Urbanized Area Transportation Study 6/24/2014
TRANSPORTATION ANALYSIS REPORT US Route 6 Huron, Erie County, Ohio
 TRANSPORTATION ANALYSIS REPORT US Route 6 Huron, Erie County, Ohio December 12, 2012 Prepared for: The City of Huron 417 Main Huron, OH 44839 Providing Practical Experience Technical Excellence and Client
THIS PAGE LEFT BLANK INTENTIONALLY
 GA SR 25 Spur at Canal Road Transportation Impact Analysis PREPARED FOR GLYNN COUNTY, GEORGIA 1725 Reynolds Street, Suite 300 Brunswick, Georgia 31520 PREPARED BY 217 Arrowhead Boulevard Suite 26 Jonesboro,
Traffic Impact Analysis Walton Acres at Riverwood Athletic Club Clayton, NC
 Traffic Impact Analysis Walton Acres at Riverwood Athletic Club Clayton, NC 1. TABLE OF CONTENTS INTRODUCTION...1 1.1. Site Location and Study Area...1 1.2. Proposed Land Use and Site Access...2 1.3.
Truck Climbing Lane Traffic Justification Report
 ROUTE 7 (HARRY BYRD HIGHWAY) WESTBOUND FROM WEST MARKET STREET TO ROUTE 9 (CHARLES TOWN PIKE) Truck Climbing Lane Traffic Justification Report Project No. 6007-053-133, P 101 Ι UPC No. 58599 Prepared by:
Traffic Impact Analysis Chatham County Grocery Chatham County, NC
 Chatham County Grocery Chatham County, NC TABLE OF CONTENTS 1. INTRODUCTION... 1 1.1. Location and Study Area... 1 1.2. Proposed Land Use and Access... 2 1.3. Adjacent Land Uses... 2 1.4. Existing ways...
Traffic Analysis and Design Report. NW Bethany Boulevard. NW Bronson Road to NW West Union Road. Washington County, Oregon
 Traffic Analysis and Design Report NW Bethany Boulevard NW Bronson Road to NW West Union Road Washington County, Oregon May 2011 Table of Contents Table of Contents Section 1 Executive Summary... 2 Section
1609 E. FRANKLIN STREET HOTEL TRAFFIC IMPACT STUDY EXECUTIVE SUMMARY
 1609 E. FRANKLIN STREET HOTEL TRAFFIC IMPACT STUDY EXECUTIVE SUMMARY Prepared for: The Town of Chapel Hill Public Works Department Traffic Engineering Division Prepared by: HNTB North Carolina, PC 343
Figure 1: Vicinity Map of the Study Area
 ARIZONA TEXAS NEW MEXICO OKLAHOMA May 5, 2016 Mr. Anthony Beach, P.E. BSP Engineers 4800 Lakewood Drive, Suite 4 Waco, Texas 76710 Re: Intersection and Access Analysis along Business 190 in Copperas Cove
Traffic Impact Study WestBranch Residential Development Davidson, NC March 2016
 Traffic Impact Study WestBranch Residential Development Davidson, NC March 216 TRAFFIC IMPACT STUDY FOR THE WestBranch Residential Development LOCATED IN DAVIDSON, NC Prepared For: Lennar Carolinas, LLC
Highway 111 Corridor Study
 Highway 111 Corridor Study June, 2009 LINCOLN CO. HWY 111 CORRIDOR STUDY Draft Study Tea, South Dakota Prepared for City of Tea Sioux Falls Metropolitan Planning Organization Prepared by HDR Engineering,
METHODOLOGY. Signalized Intersection Average Control Delay (sec/veh)
") Chapter 5 Traffic Analysis 5.1 SUMMARY US /West 6 th Street assumes a unique role in the Lawrence Douglas County transportation system. This principal arterial street currently conveys commuter traffic
Chapter 5 Traffic Analysis 5.1 SUMMARY US /West 6 th Street assumes a unique role in the Lawrence Douglas County transportation system. This principal arterial street currently conveys commuter traffic
OFFICE/RETAIL DEVELOPMENT 1625 BANK STREET OTTAWA, ONTARIO TRANSPORTATION BRIEF. Prepared for: Canada Inc.
 OFFICE/RETAIL DEVELOPMENT 1625 BANK STREET OTTAWA, ONTARIO TRANSPORTATION BRIEF Prepared for: 9402209 Canada Inc. December 15, 2015 115-625 Report_2.doc D. J. Halpenny & Associates Ltd. Consulting Transportation
Waterford Lakes Small Area Study
 Waterford Lakes Small Area Study Existing Traffic Conditions PREPARED FOR: ORANGE COUNTY PUBLIC WORKS DEPARTMENT TRAFFIC ENGINEERING DIVISION ORLANDO, FLORIDA PREPARED WITH: INWOOD CONSULTING ENGINEERS
TRAFFIC IMPACT STUDY And A TRAFFIC SIGNAL WARRANT ANALYSIS FOR A SENIOR LIVING AND APARTMENT DEVELOPMENT
 TRAFFIC IMPACT STUDY And A TRAFFIC SIGNAL WARRANT ANALYSIS FOR A SENIOR LIVING AND APARTMENT DEVELOPMENT DEERFIELD TOWNSHIP, WARREN COUNTY, OHIO Nantucket Circle and Montgomery Road () Prepared for: ODLE
INDUSTRIAL BUILDING 3009 HAWTHORNE ROAD CITY OF OTTAWA TRANSPORTATION OVERVIEW REVISED. Prepared for: Canada Inc.
 INDUSTRIAL BUILDING 3009 HAWTHORNE ROAD CITY OF OTTAWA TRANSPORTATION OVERVIEW REVISED Prepared for: 7849648 Canada Inc. Octiober 1, 2015 114-598 Overview_2.doc D. J. Halpenny & Associates Ltd. Consulting
MEMORANDUM. Charlotte Fleetwood, Transportation Planner
 MEMORANDUM Date: Updated August 22, 2017 To: Organization: Charlotte Fleetwood, Transportation Planner Boston Transportation Department From: Jason DeGray, P.E., PTOE, Regional Director of Engineering
DRAFT. Corridor study. Honeysuckle Road. October Prepared for the City of Dothan, AL. Prepared by Gresham, Smith and Partners
 DRAFT Corridor study Honeysuckle Road October 2017 Prepared for the City of Dothan, AL Prepared by TABLE OF CONTENTS SECTION I... 1 STUDY SUMMARY... 1 INTRODUCTION... 1 CONCLUSIONS... 5 SECTION II... 7
Route 28 (South Orleans Road)/Route 39 (Harwich Road)/Quanset Road Intersection
/Route 39 (Harwich Road)/Quanset Road Intersection") TRAFFIC FEASIBILITY STUDY Route 28 (South Orleans Road)/Route 39 (Harwich Road)/Quanset Road Intersection Orleans, Massachusetts Prepared for: Town of Orleans Prepared by: Fay, Spofford & Thorndike, LLC
TRAFFIC FEASIBILITY STUDY Route 28 (South Orleans Road)/Route 39 (Harwich Road)/Quanset Road Intersection Orleans, Massachusetts Prepared for: Town of Orleans Prepared by: Fay, Spofford & Thorndike, LLC
ALLEY 24 TRAFFIC STUDY
 ALLEY 24 TRAFFIC STUDY in City of Frostburg, Maryland January 2013 3566 Teays Valley Road Hurricane, WV Office: (304) 397-5508 www.denniscorporation.com Alley 24 Traffic Study January 2013 Frostburg, Maryland
Gateway Transportation Study
 Gateway Transportation Study Amherst, Massachusetts SUBMITTED TO University of Massachusetts Amherst Town of Amherst SUBMITTED BY Vanasse Hangen Brustlin, Inc. Watertown, Massachusetts March 213 Back of
2.0 LANE WIDTHS GUIDELINE
 2.0 LANE WIDTHS GUIDELINE Road Engineering Design Guidelines Version 2.0.1 May 2018 City of Toronto, Transportation Services City of Toronto Page 0 Background In early 2014, Transportation Services initiated
TRAFFIC SIGNAL WARRANT STUDY
 TRAFFIC SIGNAL WARRANT STUDY 5 th STREET & ENCHANTED PINES DRIVE JANUARY 2013 TRAFFIC OPERATIONS ENGINEERING SERVICES/PUBLIC WORKS DEPARTMENT TABLE OF CONTENTS INTERSECTION LOCATION MAP ii INTRODUCTION
Chapter 4 Traffic Analysis
 Chapter 4 Traffic Analysis PURPOSE The traffic analysis component of the K-68 Corridor Management Plan incorporates information on the existing transportation network, such as traffic volumes and intersection
Traffic Impact Study. Westlake Elementary School Westlake, Ohio. TMS Engineers, Inc. June 5, 2017
 TMS Engineers, Inc. Traffic Impact Study Westlake Elementary School Westlake, Ohio June 5, 2017 Prepared for: Westlake City Schools - Board of Education 27200 Hilliard Boulevard Westlake, OH 44145 TRAFFIC
List of Attachments. Location Map... Site Plan... City of Lake Elsinore Circulation Element... City of Lake Elsinore Roadway Cross-Sections...
 List of Attachments Exhibits Location Map... Site Plan... City of Lake Elsinore Circulation Element... City of Lake Elsinore Roadway Cross-Sections... Existing Lane Geometry and Traffic Controls... Existing
INDUSTRIAL BUILDING 1660 COMSTOCK ROAD CITY OF OTTAWA TRANSPORTATION OVERVIEW. Prepared for:
 INDUSTRIAL BUILDING 1660 COMSTOCK ROAD CITY OF OTTAWA TRANSPORTATION OVERVIEW Prepared for: Simluc Contractors Limited 2550 Blackwell Street, Ottawa K1B 5R1 October 18, 2013 113-584 Overview_1.doc D. J.
Evaluation of M-99 (Broad Street) Road Diet and Intersection Operational Investigation
 Road Diet and Intersection Operational Investigation") Evaluation of M-99 (Broad Street) Road Diet and Intersection Operational Investigation City of Hillsdale, Hillsdale County, Michigan June 16, 2016 Final Report Prepared for City of Hillsdale 97 North Broad
Evaluation of M-99 (Broad Street) Road Diet and Intersection Operational Investigation City of Hillsdale, Hillsdale County, Michigan June 16, 2016 Final Report Prepared for City of Hillsdale 97 North Broad
Transportation Impact Study for Abington Terrace
 Transportation Impact Study for Abington Terrace Abington Township, Montgomery County, PA Sandy A. Koza, P.E., PTOE PA PE License Number PE059911 Prepared by McMahon Associates, Inc. 425 Commerce Drive,
CITY OF WEST LAKE HILLS. Forest View Neighborhood Traffic Calming Study
 CITY OF WEST LAKE HILLS 901 South Mopac Expressway Building V, Suite 220 Austin, Texas 78746 Texas P.E. Firm Registration No. F-929 Klotz Associates Final Report Submittal: March 20, 2015 Revised Final
DEPARTMENT OF ENVIRONMENTAL SERVICES. North Harrison Street (Lee Highway to Little Falls Road) Comparative Analysis. Prepared for:
 Comparative Analysis. Prepared for:") DEPARTMENT OF ENVIRONMENTAL SERVICES North Harrison Street (Lee Highway to Little Falls Road) Comparative Analysis Prepared for: Arlington County Department of Environmental Services 2100 Clarendon Boulevard,
DEPARTMENT OF ENVIRONMENTAL SERVICES North Harrison Street (Lee Highway to Little Falls Road) Comparative Analysis Prepared for: Arlington County Department of Environmental Services 2100 Clarendon Boulevard,
Project Report. South Kirkwood Road Traffic Study. Meadows Place, TX October 9, 2015
 Meadows Place, TX October 9, 2015 Contents 1 Introduction... 1 2 Data Collection... 1 3 Existing Roadway Network... 2 4 Traffic Volume Development... 2 5 Warrant Analysis... 3 6 Traffic Control Alternative
I-95 Northbound at US 1 (Exit 126) Design and Study Final Report
 Design and Study Final Report") I-95 Northbound at US 1 (Exit 126) Design and Study Final Report July 2018 Prepared by: Prepared for: TABLE OF CONTENTS 1 Introduction... 1 Study Area Limits... 1 Purpose and Need of the Study... 1 Safety
I-95 Northbound at US 1 (Exit 126) Design and Study Final Report July 2018 Prepared by: Prepared for: TABLE OF CONTENTS 1 Introduction... 1 Study Area Limits... 1 Purpose and Need of the Study... 1 Safety
DIMARCO CANANDAIGUA PROPERTIES HOUSING PROJECT CANANDAIGUA, ONTARIO COUNTY, NEW YORK
 TRAFFIC IMPACT STUDY FOR THE DIMARCO CANANDAIGUA PROPERTIES HOUSING PROJECT CANANDAIGUA, ONTARIO COUNTY, NEW YORK MARCH 14, 2017 PREPARED FOR: 1950 Brighton Henrietta Town Line Rd Rochester, NY 14623 PREPARED
Glenn Avenue Corridor Traffic Operational Evaluation
 Glenn Avenue Corridor Traffic Operational Evaluation PREPARED FOR: THE CITY OF AUBURN PREPARED BY: DECEMBER 2007 Glenn Avenue Corridor Study--Auburn, Alabama TABLE OF CONTENTS Introduction... 1 Background
EUCLID AVENUE PARKING STUDY CITY OF SYRACUSE, ONONDAGA COUNTY, NEW YORK
 EUCLID AVENUE PARKING STUDY CITY OF SYRACUSE, ONONDAGA COUNTY, NEW YORK CITY OF SYRACUSE DEPARTMENT OF PUBLIC WORKS 1200 CANAL STREET EXTENSION SYRACUSE, NEW YORK 13210 DRAFT REPORT DATE: November 13,
10.0 CURB EXTENSIONS GUIDELINE
 10.0 CURB EXTENSIONS GUIDELINE Road Engineering Design Guidelines Version 1.0 March 2017 City of Toronto, Transportation Services City of Toronto Page 0 Background In early 2014, Transportation Services
Traffic Impact Study Little Egypt Road Development Denver, North Carolina June 2017
 Traffic Impact Study Little Egypt Road Development Denver, North arolina June 2017 N. Little Egypt Road DQ\ QDQFLQJ VDOHV RU RWKHU SHUIRUPDQFH EDVHG FULWHULD Proposed Site Driveways Site Driveway 1 TRAFFI
FRONT RANGE CROSSINGS TRAFFIC IMPACT STUDY
 FRONT RANGE CROSSINGS TRAFFIC IMPACT STUDY Prepared for: City of Thornton And Colorado Department of Transportation Prepared by: 11 Blake Street, Suite 2 Denver, Colorado 822 Contact: Brian Bern, PE, PTOE
Walmart (Store # ) 60 th Street North and Marion Road Sioux Falls, South Dakota
 60 th Street North and Marion Road Sioux Falls, South Dakota") Walmart (Store #4865-00) 60 th Street North and Marion Road Sioux Falls, South Dakota Prepared for: Wal-Mart Stores, Inc. Bentonville, Arkansas Prepared by: Kimley-Horn and Associates, Inc. ã2013 Kimley-Horn
Walmart (Store #4865-00) 60 th Street North and Marion Road Sioux Falls, South Dakota Prepared for: Wal-Mart Stores, Inc. Bentonville, Arkansas Prepared by: Kimley-Horn and Associates, Inc. ã2013 Kimley-Horn
Bay to Bay Boulevard Complete Streets Project
 Bay to Bay Boulevard Complete Streets Project Dale Mabry Highway to Bayshore Boulevard February 08, 2018 Photo Source: Tampa Bay Times Alessandra Da Pra Meeting Format Introduction Resurfacing Information
Appendix B: Forecasting and Traffic Operations Analysis Framework Document
 Existing Conditions Report - Appendix Appendix B: Forecasting and Traffic Operations Analysis Framework Document This document defines the methodology and assumptions that will be used in the traffic forecasting
TRAFFIC ASSESSMENT River Edge Colorado
 TRAFFIC ASSESSMENT River Edge Colorado Submitted by: Fehr & Peers 621 17th Street, Ste. 231 Denver, CO 8293 (33) 296-43 December, 21 App. M-2 Traffic Assessment River Edge Colorado December 21 TABLE OF
Road Conversion Study Plumas Street
 Plumas Street Phase I Submitted to The Regional Transportation Commission of Washoe County Submitted by Zong Tian, Ph.D., P.E. Saeedeh Farivar Haiyuan Li, Ph.D. Center for Advanced Transportation Education
Troutbeck Farm Development
 Troutbeck Farm Development Willistown Township, Chester County PA For Submission To: Willistown Township Last Revised: October, 4 TPD# INLM.A. 5 E. High Street Suite 65 Pottstown, PA 9464 6.36.3 TPD@TrafficPD.com
Date: April 4, Project #: Re: A Street/Binford Street Traffic/Intersection Assessment
 To: Peter Cavanaugh General Electric From: David Bohn, PE Ryan White, PE Date: April 4, 217 Project #: 13421. Re: / Traffic/Intersection Assessment Consistent with the Cooperation Agreement between the
Off-road Trails. Guidance
 Off-road Trails Off-road trails are shared use paths located on an independent alignment that provide two-way travel for people walking, bicycling, and other non-motorized users. Trails specifically along
STILLWATER AVENUE CORRIDOR STUDY Old Town, Maine
 Draft Study STILLWATER AVENUE CORRIDOR STUDY Old Town, Maine SUBMITTED TO: BANGOR AREA COMPREHENSIVE TRANSPORTATION SYSTEM SUBMITTED BY: I MAY 23, 2017 DRAFT STILLWATER AVENUE STUDY FINAL REPORT Table
TOWN OF CHAPEL HILL POLICY AND PROCEDURES FOR TRAFFIC CALMING MEASURES
 TOWN OF CHAPEL HILL POLICY AND PROCEDURES FOR TRAFFIC CALMING MEASURES (Adopted by the Town Council on June 30, 2004) (Revised December 6, 2010) (Revised February 8, 2016) POLICY AND PROCEDURES FOR TRAFFIC
MEMORANDUM. DATE March 1, 2012 TO Town of Milton Mark Abbott, Seth Asante, and Efi Pagitsas Boston Region MPO Staff
 MEMORANDUM DATE March 1, 212 TO Town of Milton FROM RE Mark Abbott, Seth Asante, and Efi Pagitsas Boston Region MPO Staff FFY 211 Safety and Operations Analyses at Selected Boston Region MPO Intersections:
Chapter 5 DATA COLLECTION FOR TRANSPORTATION SAFETY STUDIES
 Chapter 5 DATA COLLECTION FOR TRANSPORTATION SAFETY STUDIES 5.1 PURPOSE (1) The purpose of the Traffic Safety Studies chapter is to provide guidance on the data collection requirements for conducting a
Figure 1: East West Connector Alignment Alternatives Concept Drawing
 Page 2 of 9 Figure 1: East West Connector Alignment Alternatives Concept Drawing The Montebello Drive extension will run north south and connect Wilsonville Road to the Boones Ferry Road to Brown Road
Complete Street Analysis of a Road Diet: Orange Grove Boulevard, Pasadena, CA
 Complete Street Analysis of a Road Diet: Orange Grove Boulevard, Pasadena, CA Aaron Elias, Bill Cisco Abstract As part of evaluating the feasibility of a road diet on Orange Grove Boulevard in Pasadena,
HILTON GARDEN INN HOTEL HOTEL EXPANSION 2400 ALERT ROAD, OTTAWA TRANSPORTATION BRIEF. Prepared for:
 HILTON GARDEN INN HOTEL HOTEL EXPANSION 2400 ALERT ROAD, OTTAWA TRANSPORTATION BRIEF Prepared for: Bona Building & Management Co. Ltd. Place Vanier, 333 North River Road Vanier, Ontario K1L 8B9 October
Traffic Impact Study for Rolling Ridge Redevelopment
 Traffic Impact Study for Rolling Ridge Redevelopment Webster Groves, Missouri October 19, 2018 Prepared For: Gershman Commercial Real Estate 150 North Meramec Avenue Suite 500 St. Louis, Missouri 63105
Henderson Avenue Mixed-Use Development
 Zoning Case: Z145-3 Traffic Impact Analysis Henderson Avenue Mixed-Use Development Dallas, TX October 26 th, 216 Kimley-Horn and Associates, Inc. Dallas, Texas Project #644827 Registered Firm F-928 Traffic
Cheyenne Metropolitan Planning Organization
 Dell Range Boulevard Corridor Study PHASE II SECTION 20 DRAFT Prepared for: Cheyenne Metropolitan Planning Organization November 20, 2015 (Section 20 is bordered by Powderhouse Road on the west, Storey
Chapter 16: Traffic and Parking A. INTRODUCTION
 Chapter 6: Traffic and Parking A. ITRODUCTIO This chapter examines the potential traffic and parking impacts of the proposed Fresh Kills Park roads. The analysis of transit and pedestrians is presented
FINAL DESIGN TRAFFIC TECHNICAL MEMORANDUM
 FINAL DESIGN TRAFFIC TECHNICAL MEMORANDUM July 2014 FINAL (SR 43) Project Development and Environment Study From State Road 60 (Adamo Drive) to I-4 (SR 400) Hillsborough County, Florida Work Program Item
HENDERSON DEVELOPMENT 213, 217, 221, 221 ½, 223 HENDERSON AVENUE and 65 TEMPLETON STREET OTTAWA, ONTARIO TRANSPORTATION OVERVIEW.
 HENDERSON DEVELOPMENT 213, 217, 221, 221 ½, 223 HENDERSON AVENUE and 65 TEMPLETON STREET OTTAWA, ONTARIO TRANSPORTATION OVERVIEW Prepared for: 2294170 Ontario Inc. February 2, 2017 117-652 Report_1.doc
Grant Avenue Streetscape
 REPORT TYPE GOES HERE Grant Avenue Streetscape PREPARED FOR City of Manassas 9027 Center Street Manassas, VA 20110 PREPARED BY 8300 Boone Boulevard Suite 700 Vienna, Virginia 22182 571.389.8121 July 31,
Technical Memorandum TRAFFIC IMPACT STUDY. RIDLEY ROAD CONVENIENCE STORE Southampton County, VA. Prepared for: Mr. David Williams.
 Technical Memorandum TRFFIC IMPCT STUDY RIDLEY ROD CONVENIENCE STORE Southampton County, V Prepared for: Mr. David Williams By: Charles Smith, P.E., PTOE EPR Charlottesville, V July 2014 1 TBLE OF CONTENTS
Bridge Street Corridor Study Report
 Bridge Street Corridor Study Report Prepared for: Prepared by: BRIDGE STREET CORRIDOR STUDY REPORT PREPARED FOR: CITY OF ARROYO GRANDE COMMUNITY DEVELOPMENT DEPARTMENT 300 EAST BRANCH STREET ARROYO GRANDE,
Pedestrian Road Safety Audit
 Pedestrian Road Safety Audit Middlebrook Road From Father Hurley Boulevard to Waring Station Road December 2017 Montgomery County Department of Transportation Table of Contents 1. Introduction... 1 1.1
Draft Report. Traffic Impact Study. Superstore, Wal-Mart, and Kent Development. Yarmouth, Nova Scotia. Prepared for
 oad & Traffic Management Road & Traffic Management R Atlantic Traffic Engineering Specialists Draft Report Traffic Impact Study Superstore, Wal-Mart, and Kent Development Yarmouth, Nova Scotia Prepared
QUICKIE C STORE AND GAS BAR 1780 HERON ROAD OTTAWA, ONTARIO TRANSPORTATION BRIEF. Prepared for:
 QUICKIE C STORE AND GAS BAR 1780 HERON ROAD OTTAWA, ONTARIO TRANSPORTATION BRIEF Prepared for: Quickie Convenience Stores Larny Holdings Ltd. c/o PBC Group April 15, 2015 115-615 Report_1.doc D. J. Halpenny
5858 N COLLEGE, LLC N College Avenue Traffic Impact Study
 5858 N COLLEGE, LLC nue Traffic Impact Study August 22, 2016 Contents Traffic Impact Study Page Preparer Qualifications... 1 Introduction... 2 Existing Roadway Conditions... 5 Existing Traffic Conditions...
TABLE OF CONTENTS TABLE OF CONTENTS... I APPENDICES... III LIST OF EXHIBITS... V LIST OF TABLES... VII LIST OF ABBREVIATED TERMS...
 TABLE OF CONTENTS TABLE OF CONTENTS... I APPENDICES... III LIST OF EXHIBITS... V LIST OF TABLES... VII LIST OF ABBREVIATED TERMS... IX 1 INTRODUCTION... 1 1.1 Project Overview... 1 1.2 Analysis Scenarios...
URBAN QUARRY HEADQUARTERS 2717 STEVENAGE DRIVE CITY OF OTTAWA TRANSPORTATION OVERVIEW. Prepared for: Urban Quarry 4123 Belgreen Drive, Ottawa K1G 3N2
 URBAN QUARRY HEADQUARTERS 2717 STEVENAGE DRIVE CITY OF OTTAWA TRANSPORTATION OVERVIEW Prepared for: Urban Quarry 4123 Belgreen Drive, Ottawa K1G 3N2 February 27, 2014 113-584 Overview_1.doc D. J. Halpenny
TRAFFIC STUDY GUIDELINES Clarksville Street Department
 TRAFFIC STUDY GUIDELINES Clarksville Street Department 9/1/2009 Introduction Traffic studies are used to help the city determine potential impacts to the operation of the surrounding roadway network. Two
TAKOMA METRO STATION
 TKOM METRO STTION Traffic nalysis Technical Memorandum Station Planning in Support of Joint evelopment Job No. 13-FQ165-LN-2 November 213 WSHINGTON METROPOLITN RE TRNSIT UTHORITY (WMT) Takoma Metro Station
A plan for improved motor vehicle access on Railroad Avenue in Provincetown
 A plan for improved motor vehicle access on Railroad Avenue in Provincetown February 2011 A plan for improved motor vehicle access on Railroad Avenue in Provincetown INTRODUCTION AND PROBLEM IDENTIFICATION
FAIRFIELD INN & SUITES HOTEL 135 THAD JOHNSON PRIVATE OTTAWA TRANSPORTATION BRIEF. Prepared for:
 FAIRFIELD INN & SUITES HOTEL 135 THAD JOHNSON PRIVATE OTTAWA TRANSPORTATION BRIEF Prepared for: Bona Building & Management Co. Ltd. Place Vanier, 333 North River Road Vanier, Ontario K1L 8B9 August 12,
Traffic Circulation Study for Neighborhood Southwest of Mockingbird Lane and Airline Road, Highland Park, Texas
 ARIZONA TEXAS NEW MEXICO OKLAHOMA February 13, 2015 Mr. Meran Dadgostar P.E., R.S. Town of Highland Park 4700 Drexel Dr. Highland Park, Texas 75205 Re: Traffic Circulation Study for Neighborhood Southwest
Community Advisory Committee
 Community Advisory Committee Meeting #1 November 19, 2014 Presentation Team Matt Fulda, Greater Bridgeport Regional Council Chris Granatini, P.E., Tighe & Bond Craig Yannes, P.E., PE PTOE, Tighe & Bond
DUNBOW ROAD FUNCTIONAL PLANNING
 DUNBOW ROAD FUNCTIONAL PLANNING Final Report August 3, 216 #31, 316 5th Avenue NE Calgary, AB T2A 6K4 Phone: 43.273.91 Fax: 43.273.344 wattconsultinggroup.com Dunbow Road Functional Planning Final Report
TRAFFIC IMPACT STUDY CRITERIA
 Chapter 6 - TRAFFIC IMPACT STUDY CRITERIA 6.1 GENERAL PROVISIONS 6.1.1. Purpose: The purpose of this document is to outline a standard format for preparing a traffic impact study in the City of Steamboat
122 Avenue: 107 Street to Fort Road
 : 107 Street to Fort Road November 24, 2015 4:30 8:00 p.m. Meeting Purpose Summarize project work completed to date Share results of public input from Phase 1 Share the draft concept plan and proposed
TRAFFIC IMPACT STUDY COMPREHENSIVE UPDATE TOWN OF THOMPSON S STATION, TENNESSEE PREPARED FOR: THE TOWN OF THOMPSON S STATION
 TRAFFIC IMPACT STUDY COMPREHENSIVE UPDATE TOWN OF THOMPSON S STATION, TENNESSEE PREPARED FOR: THE TOWN OF THOMPSON S STATION Transportation Consultants, LLC 1101 17 TH AVENUE SOUTH NASHVILLE, TN 37212
4. ENVIRONMENTAL IMPACT ANALYSIS 9. TRANSPORTATION AND TRAFFIC
 4. ENVIRONMENTAL IMPACT ANALYSIS 9. TRANSPORTATION AND TRAFFIC 4.9.1 INTRODUCTION The following section addresses the Proposed Project s impact on transportation and traffic based on the Traffic Study
Shockoe Bottom Preliminary Traffic and Parking Analysis
 Shockoe Bottom Preliminary Traffic and Parking Analysis Richmond, Virginia August 14, 2013 Prepared For City of Richmond Department of Public Works Prepared By 1001 Boulders Pkwy Suite 300, Richmond, VA
Edgemont Village Traffic and Parking Technical Report January 2014
 Edgemont Village Traffic and Parking Technical Report January 2014 In the fall of 2013, the District of North Vancouver engaged consultants to assess existing intersection and parking conditions in Edgemont
Washington St. Corridor Study
 FIGURE 7.17 Bridge Alternatives - Cross Sections 86 Discarded Alternative: Short-Term Bridge Repair Short-term repairs and west bridge span replacement were considered during analysis. Short-term repairs
133 rd Street and 132 nd /Hemlock Street 132 nd Street and Foster Street MINI ROUNDABOUTS. Overland Park, Kansas
 133 rd Street and 132 nd /Hemlock Street 132 nd Street and Foster Street MINI ROUNDABOUTS Overland Park, Kansas September 1, 2017 TABLE OF CONTENTS 1. INTRODUCTION... 1 2. LITERATURE REVIEW... 1 3. CONCEPT
INTERSECTION SAFETY STUDY State Route 57 / Seville Road
 INTERSECTION SAFETY STUDY State Route 57 / Seville Road City of Wadsworth, Medina County, Ohio Prepared For: City of Wadsworth Engineering Department 120 Maple Street Wadsworth, OH 44281 Prepared By: GPD
Capital Region Council of Governments
 March 23, 2018 Capital Region Council of Governments PROJECT CONCEPT REPORT Realignment of Swamp and Northfield Road s approaches to Route 44 (Boston Turnpike) Town of Coventry SUMMARY: The Town of Coventry
The current document is revised based on the comments received on:
 General Overview 1 Introduction Over the last several years, the Waterford Lakes area has experienced increased congestion due to a substantial increase in residential and commercial development. The current
Draft North Industrial Area-Wide Traffic Plan
 Summary of North Industrial and Hudson Bay Industrial Recommended Improvements Table 1. Summary of s Item Location 1 2 3 4 5 6 7 8 9 10 11 12 Millar Ave north of 51st St Super 8 Motel back lane 400 Block
M-58 HIGHWAY ACCESS MANAGEMENT STUDY Mullen Road to Bel-Ray Boulevard. Prepared for CITY OF BELTON. May 2016
 M-58 HIGHWAY ACCESS MANAGEMENT STUDY Prepared for CITY OF BELTON By May 2016 Introduction Missouri State Highway 58 (M-58 Highway) is a major commercial corridor in the City of Belton. As development has
BELCHERTOWN. Intersection of Federal Steet (Route 9) and Bay Road MAY 2012
 and Bay Road MAY 2012") BELCHERTOWN Intersection of Federal Steet (Route 9) and Bay Road MAY 2012 Prepared Under the Direction of Pioneer Valley MPO By: Pioneer Valley Planning Commission 60 Congress Street Springfield 01104-3419
BELCHERTOWN Intersection of Federal Steet (Route 9) and Bay Road MAY 2012 Prepared Under the Direction of Pioneer Valley MPO By: Pioneer Valley Planning Commission 60 Congress Street Springfield 01104-3419
A Traffic Operations Method for Assessing Automobile and Bicycle Shared Roadways
 A Traffic Operations Method for Assessing Automobile and Bicycle Shared Roadways A Thesis Proposal By James A. Robertson Submitted to the Office of Graduate Studies Texas A&M University in partial fulfillment
PRELIMINARY DRAFT WADDLE ROAD / I-99 INTERCHANGE PROJECT ALTERNATIVE ANALYSIS FINAL TRAFFIC SUMMARY REPORT
 PRELIMINARY DRAFT WADDLE ROAD / I-99 INTERCHANGE PROJECT ALTERNATIVE ANALYSIS FINAL TRAFFIC SUMMARY REPORT Prepared by: In Association with: November 2013 EXECUTIVE SUMMARY Patton Township, in partnership
Access Location, Spacing, Turn Lanes, and Medians
 Design Manual Chapter 5 - Roadway Design 5L - Access Management 5L-3 Access Location, Spacing, Turn Lanes, and Medians This section addresses access location, spacing, turn lane and median needs, including
Small Area Study U.S. Route 220 and VA Route 615 Intersection. Bath County, Virginia
 Small Area Study U.S. Route 220 and VA Route 615 Intersection Bath County, Virginia Prepared by the Central Shenandoah Planning District Commission Final Report February 2018 Table of Contents 1. INTRODUCTION...
Traffic Impact and Access Study PROPOSED DURKEE FARM ESTATES. Foster Street Littleton, Massachusetts. Prepared for: Grimes Road, LLC.
 Traffic Impact and Access Study PROPOSED DURKEE FARM ESTATES Foster Street Littleton, Massachusetts Prepared for: Grimes Road, LLC. Westford, MA Prepared by: MDM Transportation Consultants, Inc. 28 Lord
COMMERCIAL DEVELOPMENT 2015 ROBERTSON ROAD OTTAWA, ONTARIO TRANSPORTATION BRIEF. Prepared for:
 COMMERCIAL DEVELOPMENT 2015 ROBERTSON ROAD OTTAWA, ONTARIO TRANSPORTATION BRIEF Prepared for: First Bay Properties Inc. 311 Richmond Road, Suite 203 Ottawa, ON K1Z 6X3 August 8, 2017 117-663 Brief_1.doc
Military Road Safety Improvements
 Military Road Safety Improvements 26 th Road North to 31 st Street North SUMMARY OF DATA REVIEW AND PRELIMINARY RECOMMENDATIONS Prepared for: Department of Environmental Services Traffic Engineering and
MEDICAL/OFFICE BUILDING 1637 BANK STREET OTTAWA, ONTARIO TRANSPORTATION OVERVIEW. Prepared for:
 MEDICAL/OFFICE BUILDING 1637 BANK STREET OTTAWA, ONTARIO TRANSPORTATION OVERVIEW Prepared for: 2434984 Ontario Inc. 13-5510 Canotek Road Ottawa, Ontario K1J 9J5 June 4, 2015 115-613 Report_2.doc D. J.
Dr. M.L. King, Jr. Street North Complete Streets Resurfacing Opportunities HOUSING, LAND USE, AND TRANSPORTATION COMMITTEE MARCH 22, 2018
 Dr. M.L. King, Jr. Street North Complete Streets Resurfacing Opportunities HOUSING, LAND USE, AND TRANSPORTATION COMMITTEE MARCH 22, 2018 What s Happening The City plans to mill and resurface Dr. M.L.