Retail Market Review The Perfect Storm Edward Garner - Communications Director
|
|
|
- Bruce Magnus Chandler
- 5 years ago
- Views:
Transcription

1 Retail Market Review The Perfect Storm Edward Garner - Communications Director
2 Aldi Lidl Everyone else Waitrose M&S Coping with the Perfect Storm Edward Garner - Communications Director

3 > The Agenda Market Background Squeeze & Effect Towards the Mainstream? Invading the Repertoire EDLP and meaning it The Response The Fightback Frozen Insights
4 Global Food Price Indices Food Price Index, UN FAO Food Price Index Cereals Price Index
5 Grocery Market Growth v. Inflation 7% 6% 5% 4% 3% 2% 1% 0% -1% -2% -3% 20/Sep/09 15/Nov/09 10/Jan/10 07/Mar/10 02/May/10 27/Jun/10 22/Aug/10 17/Oct/10 12/Dec/10 06/Feb/11 03/Apr/11 29/May/11 24/Jul/11 18/Sep/11 13/Nov/11 08/Jan/12 04/Mar/12 29/Apr/12 24/Jun/12 19/Aug/12 14/Oct/12 09/Dec/12 03/Feb/13 31/Mar/13 26/May/13 21/Jul/13 15/Sep/13 10/Nov/13 05/Jan/14 02/Mar/14 27/Apr/14 22/Jun/14 17/Aug/14 12/Oct/14 07/Dec/14 01/Feb/15 29/Mar/15 24/May/15 19/Jul/15 13/Sep/15 08/Nov/15 03/Jan/16 28/Feb/16 24/Apr/16 19/Jun/16 14/Aug/16 12 we growth (Grocers RST) 12 we inflation
6 Food and Drink as a Proportion of UK Household Expenditure % Source: ONS Series ABQI / ABZV
7 Food and Drink as a Proportion of UK Household Expenditure % 25 Housing & Utilities Source: ONS Series ABQI / ABZV
8 Total Grocery Budget Own Label Trends - 4-weekly m Latest 12-wk % Change May Jun Jul Aug Sep Oct Nov Dec Jan Feb Mar Mar Apr May Jun Jul Aug Sep Oct Nov Dec Jan Feb Mar Mar Apr May Jun Jul Aug Sep Oct Nov Dec Jan Feb Mar Mar Apr May Jun Jul Aug Sep Oct Nov Dec Jan Jan Feb Mar Apr May Jun Jul Aug-16 Tesco Asda Sainsbury's Morrisons +26% -29% -21% -11%

9 > The Agenda Market Background Squeeze & Effect Towards the Mainstream? Invading the Repertoire EDLP and meaning it The Response The Fightback Frozen Insights
10 Annual Till Roll Totals Expenditure Trends Lidl 16 Aldi 13 Co-op 2 Waitrose 1 Total Grocers Sainsbury's Iceland Tesco -1 Morrisons -2 Independents -3 Asda w/e Aug y/y % Change

11 Long-Term Share of Till Roll Grocers Share (Expenditure)
12 Long-Term Share of Till Roll Grocers Share (Expenditure) Tesco Asda Sainsbury's Morrisons Total Aldi + Lidl
13 Latest Period Till Roll Totals - Share of Total Grocers Tesco Sainsbury's Asda Morrisons Co-op Aldi Waitrose Lidl Iceland +5.4% + 6.9bn Independents Farmfoods w/e 19 Aug w/e 14 Aug 16
14 Latest Period Till Roll Totals - Share of Total Grocers Tesco Sainsbury's Asda Morrisons Co-op Aldi Waitrose Lidl Iceland Independents Farmfoods w/e 19 Aug w/e 14 Aug 16
15 Till-Roll Trends - Annual % Change - Rolling 52wk periods Jun Jul Aug Sep Oct Nov Dec Jan Feb Mar Mar Apr May Jun Jul Aug Sep Oct Nov Dec Jan Feb Mar Mar Apr May Jun Jul Aug Sep Oct Nov Dec Jan Jan Feb Mar Apr May Jun Jul Aug-16 Sainsbury's Tesco Asda Morrisons
16 Annual Till Roll Totals Expenditure Changes m Aldi 759 Lidl 668 Co-op 155 Waitrose 83 Sainsbury's w/e Aug y/y m Change

17 > The Agenda Market Background Squeeze & Effect Towards the Mainstream? Invading the Repertoire EDLP and meaning it The Response The Fightback Frozen Insights


18

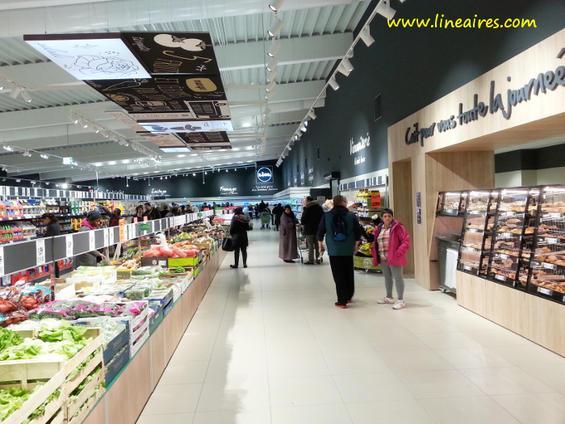
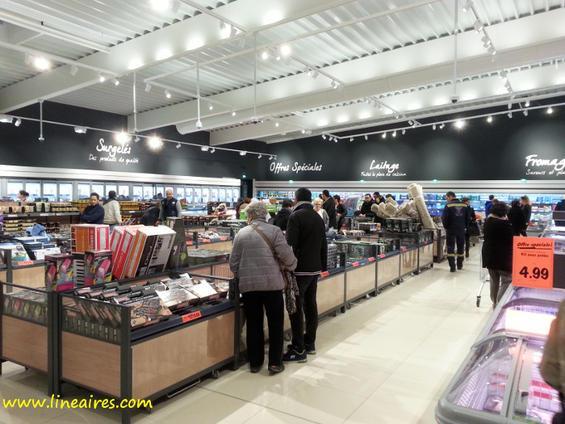
19 Rushden, Northants - November 2015


20
21
22

23

24

25

26

27

28

29
30 SOCIAL CLASS PROFILES - 12 W/E JUL % Class E Class D Class C2 Class C1 Class AB Waitrose M & S Sainsbury's Tesco Total Grocers Aldi Lidl Morrisons Co-op Asda Independents Iceland Farmfoods
31 Trended Aldi Loyalty Breakdown Sales % Shoppers % Aug Aug- 17-Aug- 16-Aug- 14-Aug- 19-Aug- 18-Aug- 17-Aug- 16-Aug- 14-Aug w/e periods High Loyal (>50%) Medium Loyal (>20%) Low Loyal (>0%)
32 Trended Tesco Loyalty Breakdown Sales % Shoppers % Aug Aug Aug Aug Aug- 19-Aug w/e periods Aug Aug Aug Aug- 16 High Loyal (>50%) Medium Loyal (>20%) Low Loyal (>0%)
33 Trading Indices - Aldi 52 w/e Aug Frozen Poultry+Game 186 Fruit+Veg+Salads 147 Frozen Fish 140 Fresh Meat 132 Fresh Poultry+Game 132 Packet Breakfast 111 Biscuits 107 Ambient Bakery Products 106 Canned Goods 105 Sweet Home Cooking 102 Dairy Products 100 Frozen Confectionery 100
34 Trading Indices - Lidl 52 w/e Aug Frozen Poultry+Game 166 Fresh Meat 153 Fresh Fish 150 Fruit+Veg+Salads 147 Fresh Poultry+Game 145 Sweet Home Cooking 127 Frozen Confectionery 123 Frozen Fish 117 Canned Goods 112 Packet Breakfast 108 Biscuits 106 Pickle+Tbl Sce+Condiment 104
35 Year-on-Year Expenditure Trends - % change Aldi Fresh+Chilled 19.8 TOTAL GROCERIES 14.8 Toiletries 14.7 Household 14.5 Ambient Groceries 11.5 Frozen 9.6 Alcohol w/e 14 Aug 16
36 Year-on-Year Expenditure Trends - & change Lidl Fresh+Chilled 20.5 TOTAL GROCERIES 15.6 Frozen 13.6 Household 13.6 Toiletries 13.3 Ambient Groceries 12.2 Alcohol w/e 14 Aug 16
37 120 Fresh & Chilled Trading Indices w/e 17 Aug w/e 16 Aug w/e 14 Aug 16
38 120 Fresh & Chilled Trading Indices w/e 17 Aug w/e 16 Aug w/e 14 Aug 16

39 > The Agenda Market Background Squeeze & Effect Towards the Mainstream? Invading the Repertoire EDLP and meaning it The Response The Fightback Frozen Insights
40 Aldi share amongst Asda/Aldi Shoppers - %

41 > The Agenda Market Background Squeeze & Effect Towards the Mainstream? Invading the Repertoire EDLP and meaning it The Response The Fightback Frozen Insights
42 ON PROMOTION - % Big 4
43 ON PROMOTION - % Big 4
44 ON PROMOTION - % Big 4

45

46 > The Agenda Market Background Squeeze & Effect Towards the Mainstream? Invading the Repertoire EDLP and meaning it The Response The Fightback Frozen Insights
47
48 PROMOTIONAL MECHANICS CONTRIBUTION TO GROWTH Tesco - 12 w/e 8% 6% Contribution to growth %pts 4% 2% 0% -2% -4% -6% -8% -10% Full price Price reduction Multibuy Y for X Market growth Grocery (RST) 12w/e
49 Tesco Share Change - 12 week share year-on-year change Mar Apr May Jun Jul Aug Sep Oct Nov Dec Jan Feb Mar Mar Apr May Jun Jul Aug Sep Oct Nov Dec Jan Feb Mar Mar Apr May Jun Jul Aug Sep Oct Nov Dec Jan Jan Feb Mar Apr May Jun Jul Aug-16
50

51
52
53 Grocery Share at Round Pound Prices - % - Asda Dec Jan Feb Mar Apr Apr May Jun Jul Aug Sep Oct Nov Dec Jan Feb Mar Mar Apr May Jun Jul Aug Sep Oct Nov Dec Jan Feb Mar Mar Apr May Jun Jul Aug Sep Oct Nov Dec Jan Feb Mar Mar Apr May Jun Jul Aug Sep Oct Nov Dec Jan Jan Feb Mar Apr May Jun Jul Aug-16


54
55 PROMOTIONAL MECHANICS CONTRIBUTION TO GROWTH Asda - 12 w/e 6% 4% Contribution to growth %pts 2% 0% -2% -4% -6%? -8% -10% Full price Price reduction Multibuy Y for X Market growth Grocery (RST) 12w/e
56 Asda Year-on-Year Trends - Till Roll % Mar Apr May Jun Jul Aug Sep Oct Nov Dec Jan Feb Mar Mar Apr May Jun Jul Aug Sep Oct Nov Dec Jan Feb Mar Mar Apr May Jun Jul Aug Sep Oct Nov Dec Jan Jan Feb Mar Apr May Jun Jul Aug w/e Periods
57 Reasons for Store Choice - It always has low prices Asda 159 Co-operative 98 Morrisons 79 Tesco 76 Sainsbury's 66 M & S 60 Waitrose 29 LinkQ Questionnaire - Outlet Share Index 52 w/e Mar
58 Reasons for Store Choice - It always has low prices Aldi 222 Asda 159 Lidl 146 Co-operative 98 Morrisons 79 Tesco 76 Sainsbury's 66 M & S 60 Waitrose 29 LinkQ Questionnaire - Outlet Share Index 52 w/e Mar

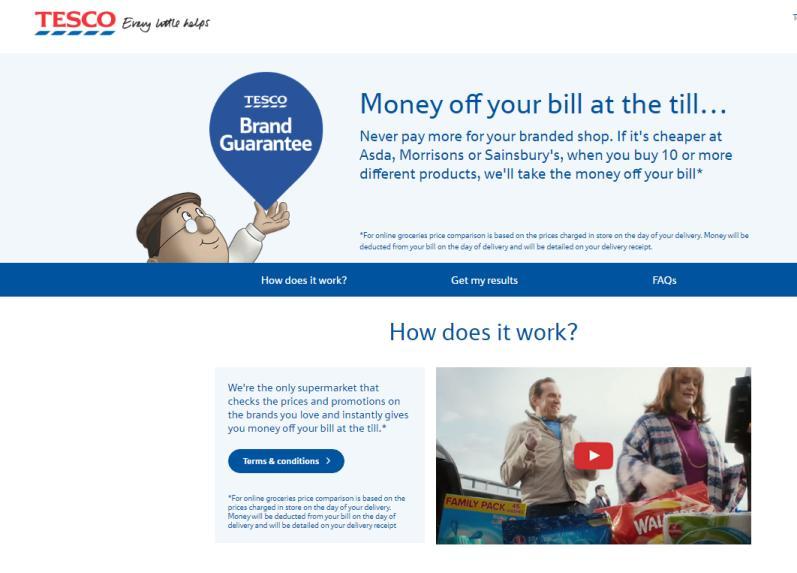
59 We've ended Brand Match to bring lower regular prices Brand Match ended on 26 April 2016
60 PROMOTIONAL MECHANICS CONTRIBUTION TO GROWTH Sainsbury's - 12 w/e 15% Contribution to growth %pts 10% 5% 0% -5% -10% -15% -20% Full price Price reduction Multibuy Y for X Market growth
61 Sainsbury Share Change - 12 week share year-on-year change Mar Mar Apr May Jun Jul Aug Sep Oct Nov Dec Jan Feb Mar Mar Apr May Jun Jul Aug Sep Oct Nov Dec Jan Feb Mar Mar Apr May Jun Jul Aug Sep Oct Nov Dec Jan Jan Feb Mar Apr May Jun Jul-16

62

63
64

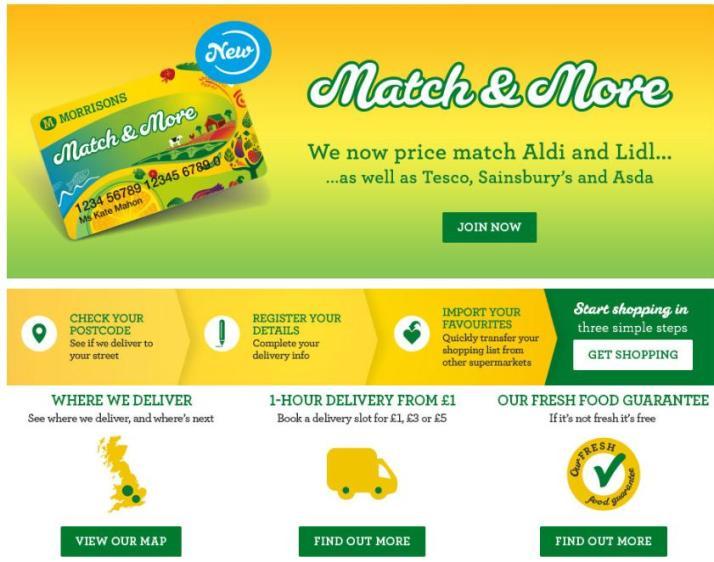
65 Frosty morning? Don t worry, we ve found a use for that Morrisons card

66

67 The Agenda Market Background Squeeze & Effect Towards the Mainstream? Invading the Repertoire EDLP and meaning it The Response > The Fightback Frozen Insights
68 40 Aldi Year-on-Year Trends - Till Roll % Mar Apr May Jun Jul Aug Sep Oct Nov Dec Jan Feb Mar Mar Apr May Jun Jul Aug Sep Oct Nov Dec Jan Feb Mar Mar Apr May Jun Jul Aug Sep Oct Nov Dec Jan Jan Feb Mar Apr May Jun Jul Aug w/e Periods
69 Lidl Year-on-Year Trends - Till Roll % Mar Apr May Jun Jul Aug Sep Oct Nov Dec Jan Feb Mar Mar Apr May Jun Jul Aug Sep Oct Nov Dec Jan Feb Mar Mar Apr May Jun Jul Aug Sep Oct Nov Dec Jan Jan Feb Mar Apr May Jun Jul Aug w/e Periods


70
71 Long-Term Share of Till Roll Grocers Share (Expenditure)

72
73 Reasons for Store Choice - Waitrose It has friendly staff 285 I like the cafe / restaurant 255 I like the own-label goods less queuing than other stores It has a good product range 158 It has a butcher's counter It has a delicatessen It has a fresh fish counter It has an in-store bakery It's near to my home I like the store's layout It sells clothing CDs etc. It has good value for money It always has low prices 29 LinkQ Questionnaire - Outlet Share Index 52 w/e Mar
74 M&S Share of Fresh & Chilled Groceries Sep Oct Nov Dec Jan Feb Mar Mar Apr May Jun Jul Aug Sep Oct Nov Dec Jan Feb Mar Mar Apr May Jun Jul Aug Sep Oct Nov Dec Jan Jan Feb Mar Apr May Jun Jul Aug-16 Share (Expenditure)
75 M&S Year-on-Year Growth Trends - RST % Jul Aug Sep Oct Nov Dec Jan Feb Mar Mar Apr May Jun Jul Aug Sep Oct Nov Dec Jan Feb Mar Mar Apr May Jun Jul Aug Sep Oct Nov Dec Jan Jan Feb Mar Apr May Jun Jul Aug w/e Periods
76 RST Trends - Annual % Change - Rolling 52wk periods Sep Oct Nov Dec Jan Feb Mar Mar Apr May Jun Jul Aug Sep Oct Nov Dec Jan Feb Mar Mar Apr May Jun Jul Aug Sep Oct Nov Dec Jan Jan Feb Mar Apr May Jun Jul Aug-16 Sainsbury's Tesco Asda Morrisons M&S Fresh & Chilled
77 FOR TONIGHT SHOPPER MISSIONS % WITHIN OUTLET For Tonight - Share of Occasions % 52 w/e 02 Feb w/e 01 Feb w/e 31 Jan 16 All Outlets M & S Sainsbury's Local Budgens The Co-operative Tesco Express Tesco Metro Independents Asda Aldi
78 Trended Loyalty Breakdown Waitrose % M&S % Aug Aug Aug Aug Aug- 19-Aug w/e periods Aug Aug Aug Aug- 16 High Loyal (>50%) Medium Loyal (>20%) Low Loyal (>0%)
79 Total Groceries - Net Switching Volumes - M & S Tesco 32 Asda 24 Sainsbury's 22 Co-op 20 Morrisons 17 Independents 4 Waitrose 3 All Others 2 Farmfoods M & S - 0 Iceland Ocado -3-3 Aldi -4 Lidl -7 Switching - m 52 w/e Jul vs. 52 w/e Jul
80 Total Groceries - Total Net Switching Volumes - Summary Aldi Lidl Ocado M & S Waitrose Farmfoods Iceland All Others Sainsbury's Co-op Independents Morrisons Tesco Asda Switching - Spend ( m) 52 w/e Jul vs. 52 w/e Jul
81 Total Internet Grocery - Rolling 12 w/e growth Sep Oct Nov Dec Jan Feb Mar Mar Apr May Jun Jul Aug Sep Oct Nov Dec Jan Jan Feb Mar Apr May Jun Jul Aug- 16
82 14 Total Grocery Internet Lifestage Signatures Pre-Family Young Family 0-4 Years Middle Family 5-9 Years Family 10+ Years Older Dependents Empty Nesters Retired 52 w/e Jul
83 14 Total Grocery Internet Lifestage Signatures Pre-Family Young Family 0-4 Years Middle Family 5-9 Years Family 10+ Years Older Dependents Empty Nesters Retired 52 w/e Jul
84 14 Total Grocery Internet Lifestage Signatures Pre-Family Young Family 0-4 Years Middle Family 5-9 Years Family 10+ Years Older Dependents Empty Nesters Retired 52 w/e Jul

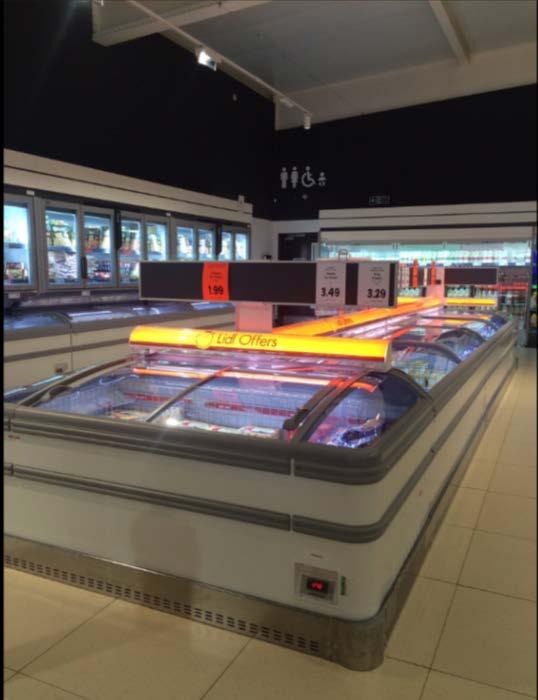
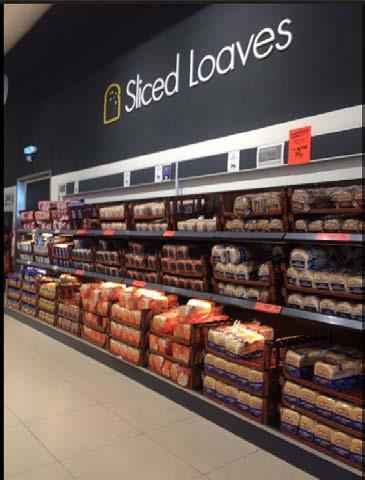
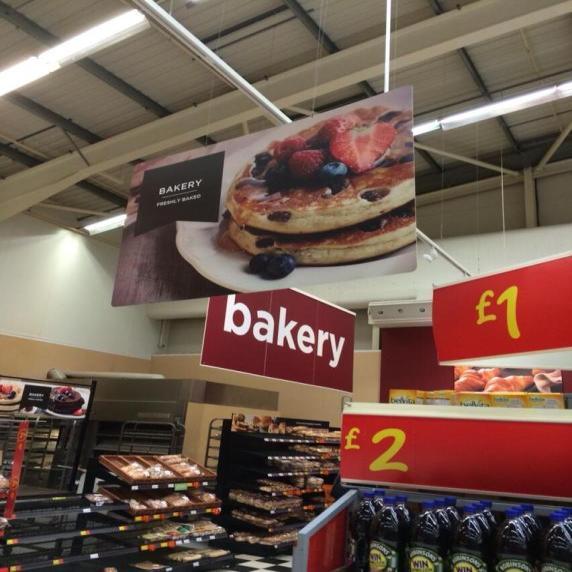
85 In-store theatre

86 Picture comparing a typical Aldi store entrance in Australia with its new look store in McGraths Hills in NSW

87 Picture comparing a typical Aldi store entrance in Australia with its new look store in McGraths Hills in NSW
88 Dec Feb Apr Jun Jul Sep Nov Jan Mar May Jul Aug Oct Dec Feb Apr Jun Jul Sep Nov Jan Mar May Jun Aug Oct Dec Feb Apr May Jul Sep Nov Jan Mar May Jun Aug Oct Dec Feb Apr May Jul Sep Nov Jan Mar Apr Jun Aug Oct Dec Feb Mar May Jul Sep Nov Jan Mar Apr Jun Aug Oct Dec Jan-16 Fairtrade Prepacked Bananas Market Share Total Grocers Sainsbury
89 Fairtrade Shares Sainsbury's 30 Co-op Tesco Waitrose 10 Asda 8 Morrisons 7 M & S 5 Aldi 2 Iceland Independents Lidl Farm Foods Share of Fairtrade - 52 w/e Jul
90 Mar May Jul Aug Oct Dec Feb Apr Jun Jul Sep Nov Jan Mar May Jun Aug Oct Dec Feb Apr May Jul Sep Nov Jan Mar May Jun Aug Oct Dec Feb Apr May Jul Sep Nov Jan Mar Apr Jun Aug Oct Dec Feb Mar May Jul Sep Nov Jan Mar Apr Jun Aug Oct Dec Jan-16 Not-Caged Eggs Market Share Sainsbury s Asda Tesco Morrisons
91 Total Organic Grocery Products including Baby - 4 weekly m
92 Total Organic Market (inc. Baby) Rolling 52 week periods Y-on-Y Change %
93 Where Lidl shoppers prefer to shop < In other grocers In Lidl > 52 w/e Jul
94 Where Aldi shoppers prefer to shop < In other grocers In Aldi > 52 w/e Jul
95 400 Tesco - Net New/Lost & Repeat Buyers - Contribution to Change 300 Actual Contribution (000,000s) Oct Nov Dec Jan Feb Mar Mar Apr May Jun Jul Aug Sep Oct Nov Dec Jan Feb Mar Mar Apr May Jun Jul Aug Sep Oct Nov Dec Jan Feb Mar Mar Apr May Jun Jul Aug Sep Oct Nov Dec Jan Jan Feb Mar Apr May Jun Jul 16 Net New/Lost Repeat Total
96 Asda - Net New/Lost & Repeat Buyers - Contribution to Change Actual Contribution (000,000s) Oct Nov Dec Jan Feb Mar Mar Apr May Jun Jul Aug Sep Oct Nov Dec Jan Feb Mar Mar Apr May Jun Jul Aug Sep Oct Nov Dec Jan Feb Mar Mar Apr May Jun Jul Aug Sep Oct Nov Dec Jan Jan Feb Mar Apr May Jun Jul 16 Net New/Lost Repeat Total
97 350 Aldi - Net New/Lost & Repeat Buyers - Contribution to Change 300 Actual Contribution (000,000s) Oct Nov Dec Jan Feb Mar Mar Apr May Jun Jul Aug Sep Oct Nov Dec Jan Feb Mar Mar Apr May Jun Jul Aug Sep Oct Nov Dec Jan Feb Mar Mar Apr May Jun Jul Aug Sep Oct Nov Dec Jan Jan Feb Mar Apr May Jun Jul 16 Net New/Lost Repeat Total
98 200 Lidl - Net New/Lost & Repeat Buyers - Contribution to Change Actual Contribution (000,000s) Oct Nov Dec Jan Feb Mar Mar Apr May Jun Jul Aug Sep Oct Nov Dec Jan Feb Mar Mar Apr May Jun Jul Aug Sep Oct Nov Dec Jan Feb Mar Mar Apr May Jun Jul Aug Sep Oct Nov Dec Jan Jan Feb Mar Apr May Jun Jul 16 Net New/Lost Repeat Total
99 % Aldi or Lidl shoppers also shopping in Mainstream in 4 w/e July

100 The Agenda The UK Background Squeeze & Effect Towards the Mainstream? Invading the Repertoire EDLP and meaning it The Response The Fightback > Frozen Insights
101 Year-on-Year Expenditure Trends - % change All Outlets Healthcare 3.4 Fresh+Chilled 0.8 Alcohol 0.4 TOTAL GROCERIES -0.1 Frozen -0.8 Household -1.0 Ambient Groceries -1.2 Toiletries w/e 14 Aug 16
102 Year-on-Year Expenditure Trends - % change Total Frozen Lidl 13.6 Aldi 9.6 Co-op 2.9 Farmfoods 1.6 Iceland 0.4 Total Grocers -0.9 Tesco -1.6 Sainsbury's -3.1 Waitrose -3.2 Morrisons -4.4 Asda -5.8 M & S Independents w/e 14 Aug 16
103 Share of Total Grocers - Total Frozen Tesco Iceland Asda Sainsbury's Morrisons Aldi Farm Foods Lidl The Co-operative Waitrose M & S Independents w/e 16 Aug w/e 14 Aug 16
104 Year-on-Year Expenditure Trends - % change Total Fresh & Chilled Lidl Aldi M & S Waitrose Co-op Total Grocers Farmfoods Sainsbury's Tesco Morrisons Iceland Asda Independents w/e 14 Aug 16
105 Share of Total Grocers - Fresh+Chilled Tesco Sainsbury's Asda Morrisons Waitrose M & S Aldi The Co-operative Lidl Iceland Independents Farm Foods w/e 16 Aug w/e 14 Aug 16
106 Trading Index Internet Delivery Organic 193 Frozen Household Ambient Groceries Fresh+Chilled Toiletries Alcohol 82 Healthcare w/e Jul
107 Trading Index Internet Delivery Take Home Soft Drinks Savoury Carbohydrts+Sncks Chilled Drinks Canned Goods Frozen Poultry+Game Packet Breakfast Savoury Home Cooking Frozen Prepared Foods Frozen Fish Household & Cleaning Prds Frozen Confectionery Pickle+Tbl Sce+Condiment Pet Care Sweet Home Cooking Fresh Poultry+Game Dairy Products Frozen Meat Haircare Take Home Savouries Biscuits Fruit+Veg+Salads Fresh Meat Hot Beverages Chilled Convenience Bathroom Toiletries Oral-Care Alcohol Fresh Fish Ambient Bakery Products Chilled Bakery Products Healthcare Take Home Confectionery w/e Jul
108 Trading Index Internet Delivery Fresh Poultry Fresh Sausages Fresh Bacon Rashers 99 Fresh Bacon Joint Fresh Beef Fresh Pork 85 Wet/Smoked Fish Fresh Lamb w/e Jul
109 Frozen Food - Internet Share by Household Income pa pa pa pa pa pa pa w/e Jul
110 Frozen Food - Internet Share by Lifestage Pre-Family Young Family 0-4 Years Middle Family 5-9 Years Family 10+ Years Older Dependents Empty Nesters Retired 52 w/e Jul
111 Frozen Food Internet in Context 52 w/e 17 Aug w/e 16 Aug w/e 14 Aug 16 Total Frozen bn y/y % Change Internet Frozen m y/y % Change Internet Share % Internet Penetration %HH Grocer Tripsize Internet Tripsize
112 Frozen Food Ranges - Y/Y Growth m - 52 w/e Jul Youngs Gastro Birds Eye Field Fresh Deluxe (Lidl) Quorn Albert Bartlett Iceland Butchers Market Iceland Classic Birds Eye Inspirations Chicago Town Linda Mccartney (Hain) Birds Eye Harry Ramsden Ben+Jerrys Artic Royal (Iceland) Goodfellas Takeaway Aldi Specially Selected
113 twitter edgarner
How is the Irish Fish Market Performing? Data to 18 June 2017
 How is the Irish Fish Market Performing? Data to 18 June 2017 Today s Agenda Contents Definitions Total Fish Frozen Fish Fresh Fish Focus on How does fish s performance compare to other proteins and who
How is the Irish Fish Market Performing? Data to 31 st December 2017
 How is the Irish Fish Market Performing? Data to 31 st December 2017 Today s Agenda Contents Definitions Total Fish Frozen Fish Fresh Fish Focus on How does fish s performance compare to other proteins
The Evolving Shopper & Its Impact on Produce
 The Evolving Shopper & Its Impact on Produce Amir Jalaly & Chris Cowan WHO are Kantar Worldpanel? HOW have shopping habits changed & the impact on produce? A CHANGING consumer landscape WHO are Kantar
COMPARISON OF FIXED & VARIABLE RATES (25 YEARS) CHARTERED BANK ADMINISTERED INTEREST RATES - PRIME BUSINESS*
 CHARTERED BANK ADMINISTERED INTEREST RATES - PRIME BUSINESS*") COMPARISON OF FIXED & VARIABLE RATES (25 YEARS) Fixed Rates Variable Rates FIXED RATES OF THE PAST 25 YEARS AVERAGE RESIDENTIAL MORTGAGE LENDING RATE - 5 YEAR* (Per cent) Year Jan Feb Mar Apr May Jun Jul
COMPARISON OF FIXED & VARIABLE RATES (25 YEARS) Fixed Rates Variable Rates FIXED RATES OF THE PAST 25 YEARS AVERAGE RESIDENTIAL MORTGAGE LENDING RATE - 5 YEAR* (Per cent) Year Jan Feb Mar Apr May Jun Jul
Lamb Market Outlook. ASI New Orleans, TX January 25, David P. Anderson Professor and Extension Economist
 Lamb Market Outlook ASI New Orleans, TX January 25, 2019 David P. Anderson Professor and Extension Economist Overview Usual Suspects Production Demand Prices The Usual Suspects Stocks Imports Weights Mil.
Utility Debt Securitization Authority 2013 T/TE Billed Revenues Tracking Report
 Utility Debt Securitization Authority 2013 T/TE Billed Revenues Tracking Report Billing Budgeted Billed Dollar Percent Month Revenues Revenues Variance Variance Jan 2018 11,943,180.68 12,697,662.47 754,481.79
How customer behaviour is changing
 DIANE WEHRLE Marketing & Insights Director How customer behaviour is changing www.spring-board.info www. spring-board.info SPRINGBOARD Data and insights on customer activity, and store and retail destination
Goldman Sachs Agricultural Biotech Forum New York, NY. March 7, 2012
 1 Goldman Sachs Agricultural Biotech Forum New York, NY March 7, 2012 2 Forward Looking Statement Warning This presentation contains forward-looking statements about the business, financial condition and
UK Seafood Value Chain 2017 Provisional
 UK Seafood Value Chain 2017 Provisional Sources: Nielsen ScanTrack GB Total Coverage including Discounters and Northern Ireland including Musgraves 30.12.17, Nielsen HomeScan GB 30.12.17, The NPD Group/CREST
Beef Outlook. Regional Dealer Event. February 9, Dr. Scott Brown Agricultural Markets and Policy Division of Applied Social Sciences
 Beef Outlook Regional Dealer Event February 9, 2018 Dr. Scott Brown Agricultural Markets and Policy Division of Applied Social Sciences brownsc@missouri.edu http://amap.missouri.edu $ Per Cwt. MED. & LRG.
Wisconsin 511 Traveler Information Annual Usage Summary January 3, Wisconsin 511 Phone Usage ( )
") Wisconsin 511 Traveler Information 211 Annual Usage Summary January 3, 212 Overall to-date Summary 36 months of operation 1,16,63 total calls the 1 Million mark was passed on December 3, 212 3,627,527
Wisconsin 511 Traveler Information 211 Annual Usage Summary January 3, 212 Overall to-date Summary 36 months of operation 1,16,63 total calls the 1 Million mark was passed on December 3, 212 3,627,527
Cross Sector Property Update
 Ian Cross Sector Property Update Johnny Dudgeon, FRICS Savills Lincoln Email: jdudgeon@savills.com Tel: 01522 508952 UK Housing Market Residential Rural Commercial Strategic Land East Midlands West Midlands
Livestock, Poultry, and Dairy: Situation and Outlook
 Livestock, Poultry, and Dairy: Situation and Outlook AAEA Annual Meeting Extension Track August 14, 2012 James G. Robb Director james.robb@lmic.info 29 land Grant Universities: USDA Members: ERS APHIS
Cattle Market Outlook & Important Profit Factors for Cattle Producers
 Cattle Market Outlook & Important Profit Factors for Cattle Producers Dr. Scott Brown Agricultural Markets and Policy Division of Applied Social Sciences brownsc@missouri.edu http://amap.missouri.edu $
Economic Overview. Melissa K. Peralta Senior Economist April 27, 2017
 Economic Overview Melissa K. Peralta Senior Economist April 27, 2017 TTX Overview TTX functions as the industry s railcar cooperative, operating under pooling authority granted by the Surface Transportation
2018 HR & PAYROLL Deadlines
 th (by payment date) EPAF 3rd PARTY FEEDS WTE Approval 2018 HR & PAYROLL s Normal Payroll day s 2017 B1-26 3 * 13-Dec-17 15-Dec-17 n/a n/a n/a 28-Dec-17 29-Dec-17 11:00 AM 16-Dec-2017 29-Dec-2017 JAN 2018
Cattle & Beef Outlook
 Cattle & Beef Outlook Friday, August 18, 2017 Glynn Tonsor Dept. of Agricultural Economics, Kansas State University Overarching Beef Industry Economic Outlook Supplies Expansion continues, but has moderated
TEGMA Fall Transportation Symposium
 TEGMA 2017 Fall Transportation Symposium John Wilson Senior Vice President Dairy industry trends 1997 1998 1999 2000 2001 2002 2003 2004 2005 2006 2007 2008 2009 2010 2011 2012 2013 2014 2015 2016 Million
Serving international shoppers during the holiday season. 4 th December 2018
 1 Serving international shoppers during the holiday season 4 th December 2018 Agenda 2 1 Vinod Paul, Head of Business Intelligence and Insights Sales seasonality Key nationalities Monthly arrivals 2 Said
Cattle & Beef Outlook
 Cattle & Beef Outlook Glynn Tonsor Dept. of Agricultural Economics, Kansas State University Overarching Beef Industry Economic Outlook Supplies Peak herd size may extend given 17 returns Demand Key to
Manufacturers Continue Capacity Expansion as Technology Orders Grow
 Contact: Penny Brown, AMT, 703-827-5275 pbrown@amtonline.org For Release: October 8th, 2018 Manufacturers Continue Capacity Expansion as Technology Orders Grow Manufacturing technology orders posted an
BMO Capital Markets 2013 Farm to Market Conference New York, New York. May 14, 2013
 0 BMO Capital Markets 2013 Farm to Market Conference New York, New York May 14, 2013 1 Forward Looking Statement Warning This presentation contains forward-looking statements about the business, financial
Conference Welcome and Introduction
 Conference 2013 Welcome and Introduction Housing stock Present day Owner occupation Private renting 17.5m 4m 66% 15.1% Housing associations Council housing 2.8m 2.2m 26.5m 10.6% 8.3% > 2.8m Social Housing
J.P. Morgan New York Non-Deal Road Show. New York, New York
 J.P. Morgan New York Non-Deal Road Show New York, New York March 2, 2018 Forward Looking Statement Warning This presentation contains forward-looking statements about the business, financial condition
BMO Capital Markets New York Road Show New York, New York. December 5, 2013
 0 BMO Capital Markets New York Road Show New York, New York December 5, 2013 1 Forward Looking Statement Warning This presentation contains forward-looking statements about the business, financial condition
Goldman Sachs Eighteenth Annual Agribusiness Conference New York, New York. March 12, 2014
 0 Goldman Sachs Eighteenth Annual Agribusiness Conference New York, New York March 12, 2014 1 Forward Looking Statement Warning This presentation contains forward-looking statements about the business,
Livestock Market Trends
 Livestock Market Trends Farm$mart Agricultural Conference January 18, 2014 John Bancroft Market Strategies Program Lead john.bancroft@ontario.ca 519-271-6974 Today s Discussion 2014 FCC Market Drivers
Beef Cattle Market Update
 Beef Cattle Market Update August 8, 2017 Dr. Scott Brown Agricultural Markets and Policy Division of Applied Social Sciences University of Missouri brownsc@missouri.edu http://amap.missouri.edu Twitter
Sidoti & Company, LLC West Coast Road Show. San Francisco, California
 Sidoti & Company, LLC West Coast Road Show San Francisco, California February 4, 2015 Forward Looking Statement Warning This presentation contains forward-looking statements about the business, financial
MAR DASHBOARD MAR. Compliant % Breakdown Mar % Late % On-time MAR APR MAY JUN JUL AUG SEP OCT NOV DEC
 Positive Response Compliance 215 Compliant 215 Non-Compliant 216 Compliant 216 Non-Compliant 1% 87% 96% 86% 96% 88% 97% 89% 89% 88% 86% 92% 93% 94% 96% 94% 8% 6% 4% 2% 13% JAN 4% 14% FEB 4% 12% 3% 11%
Photo courtesy of Judy Jacobson, Watford City. Cattle Situation and Outlook Ag Lenders Conference
 Photo courtesy of Judy Jacobson, Watford City Cattle Situation and Outlook Ag Lenders Conference Tim Petry Livestock Economist www.ndsu.edu/livestockeconomics Oct. 31, 2016 AGL16-Outlook 10-31-2016 TO
Steel Market Outlook. AM/NS Calvert
 Steel Market Outlook AM/NS Calvert Agenda Economic indicators Key steel consuming markets and forecasted demand Steel consumptions trends Global steel markets and raw materials Comments on trade 1 U.S.
Outlook for the U.S. Livestock and Poultry Sectors in 2011
 Outlook for the U.S. Livestock and Poultry Sectors in 2011 Presented By Shayle D. Shagam World Agricultural Outlook Board, USDA USDA Outlook Forum Washington, D.C. February 25, 2011 Situation Facing Livestock
Western University Unsealed Nuclear Substance Contamination Monitoring Record
 Western University Unsealed Contamination Monitoring Record Permit Holder: Room number: A. Indirect Monitoring (Wipe test using liquid scintillation counter or NaI counter) Counter Type: Make Model Contamination
A comment on recent events, and...
 A comment on recent events, and... where we are in the current economic cycle November 15, 2016 Mark Schniepp Director Likely Trump Policies $4 to $5 Trillion in tax cuts over 10 years to corporations,
Presentation from the USDA Agricultural Outlook Forum 2017
 Presentation from the USDA Agricultural Outlook Forum 2017 United States Department of Agriculture 93 rd Annual Agricultural Outlook Forum A New Horizon: The Future of Agriculture February 23-24, 2017
BMO Capital Markets 2014 Farm to Market Conference New York, New York. May 21, 2014
 0 BMO Capital Markets 2014 Farm to Market Conference New York, New York May 21, 2014 1 Forward Looking Statement Warning This presentation contains forward-looking statements about the business, financial
Goldman Sachs U.S. Emerging/SMID Cap Growth Conference. New York, New York
 Goldman Sachs U.S. Emerging/SMID Cap Growth Conference New York, New York November 20, 2014 Forward Looking Statement Warning This presentation contains forward-looking statements about the business, financial
Livestock and Dairy Market Outlook
 Livestock and Dairy Market Outlook August 9, 2018 Missouri Farm Bureau Commodity Conference Dr. Scott Brown Agricultural Markets and Policy Division of Applied Social Sciences brownsc@missouri.edu http://amap.missouri.edu
Outlook for Livestock and Poultry. Michael Jewison World Agricultural Outlook Board, USDA
 Outlook for Livestock and Poultry Michael Jewison World Agricultural Outlook Board, USDA USDA Agricultural Outlook Forum February 20, 2015 About Those Forecasts Everything makes sense in hindsight, a fact
The Cairns Economy Recent Trends and Prospects
 MINING, AGRICULTURE, TOURISM, TRANSPORT, CONSTRUCTION, MANUFACTURING, DEFENCE, EDUCATION, ADMINISTRATION, SERVICES The Cairns Economy Recent Trends and Prospects WS (Bill) Cummings PRESENTATION TO Ref:
U.S. EXPORTS Dairy Products - by Country, 2009 (pie chart) 69 Dairy Products, 2009 v (bar graph) 70 All Dry Whey, All Dry Whey -
 69 Dairy Products, 2009 v (bar graph) 70 All Dry Whey, All Dry Whey -") TABLE OF CONTENTS I. EXECUTIVE SUMMARY 5 II. UTILIZATION A. Dry Milk Products Utilization 1. Nonfat Dry Milk Compilation of Dry Milk Utilization Data 9 Nonfat Dry Milk Overview 10 Nonfat Dry Milk Domestic
TABLE OF CONTENTS I. EXECUTIVE SUMMARY 5 II. UTILIZATION A. Dry Milk Products Utilization 1. Nonfat Dry Milk Compilation of Dry Milk Utilization Data 9 Nonfat Dry Milk Overview 10 Nonfat Dry Milk Domestic
Curves On The Road Ahead
 Curves On The Road Ahead Light Vehicle Market Outlook November 2018 Charles Chesbrough Senior Economist A g e n d a Economic Outlook and New Vehicle Sales Affordability Threat and the Used Vehicle Market
KC Scout Kansas City s Bi-State Transportation Management Center
 KC Scout Kansas City s Bi-State Transportation Management Center Operations Report May 216 This report contains statistical and operational data of activities at the Scout TMC for the period Sunday, May
FREEDOM OF INFORMATION REQUEST
 FREEDOM OF INFORMATION REQUEST REQUEST NUMBER: FOI Request 003905-16 REQUEST DETAILS: As part of my research I am requesting information on the numbers of 'strip searches' that have taken place within
NCC Cable System Order
 Order # 62508883 Flight s 03/13/18-04/01/18 Syscode 2107 Agency Canal Partners Media System Name Spectrum/DISH- I+ Tampa-St. Pete, FL Advertiser Levine For Governor Phone (301) 951-2620 Credit Update 03/13/18
Commodity Market Outlook: Corn, Forage, Wheat & Cattle
 Commodity Market Outlook: Corn, Forage, Wheat & Cattle Stephen R. Koontz Professor & extension economist Department of Agricultural & Resource Economics Colorado State University Stephen.Koontz@ColoState.Edu
Cattle Situation and Outlook
 Photo courtesy of Judy Jacobson, Watford City Cattle Situation and Outlook Tim Petry Livestock Economist www.ndsu.edu/livestockeconomics September 2, 2015 Washburn Livestock Outlook-9-1-15.pptx TO ALL
Swine Market Outlook
 2018 IOWA PORK REGIONAL CONFERENCES NASHUA, CARROLL, LE MARS, & WASHINGTON, IA FEBRUARY 19-22, 2018 Swine Market Outlook Lee Schulz, Department of Economics, Iowa State University (515) 294-3356; lschulz@iastate.edu
The Future of the Fish & Seafood Market in Belgium to 2017
 1. The Future of the Fish & Market in Belgium to 2017 Reference Code: FD0554MR www.canadean-winesandspirits.com The Future of the Fish & Market in Belgium to 2017 Table of Contents 1. Introduction... 9
Current Hawaii Economic Conditions. Eugene Tian
 Current Hawaii Economic Conditions Eugene Tian Department of Business, Economic Development & Tourism At the PATA/TTRA 2016 Annual Outlook & Economic Forecast Forum February 3, 2016 Positive Signs in the
Suburb Flyover Report
 Suburb Flyover Report NARRABEEN (House) Prepared By: Shelley Bakhuizen, Ray White Mona Vale NARRABEEN - Suburb Map NARRABEEN - Sales Statistics (Houses) Year # Sales Median Growth Low High 1998 188 $ 09,500
Global Boxboard Market Review
 Global Boxboard Market Review Sailing In A World Of Volatility And Uncertainty European Conference March 2018 Alejandro Mata Senior Economist, European Forest Products Copyright 2018 RISI, Inc. Proprietary
JULY 2013 RIDERSHIP REPORT MTA METRO-NORTH RAILROAD EXECUTIVE SUMMARY
 Ridership Report JULY 2013 RIDERSHIP REPORT MTA METRO-NORTH RAILROAD EXECUTIVE SUMMARY July July 2013 Total MNR System Ridership was 7.346 million vs. 7.439 million in July 2012, a decrease of 92,959 passengers
Outlook for U.S. Retail Food Prices and Inflation in 2009
 Outlook for U.S. Retail Food Prices and Inflation in 2009 Ephraim Leibtag, PhD Food Markets Branch, Food Economics Division ERS-USDA Presented at the 2009 Agricultural Outlook Forum Global Agriculture
Producer Price Index - Agriculture (PPI-A) (January March 2001)
 (January March 2001)") Producer Price Index - Agriculture (PPI-A) (January March 2001) Introduction The Producer Price Index-Agriculture (PPI-A) gives a measure of the average change in the selling prices which producers receive
Producer Price Index - Agriculture (PPI-A) (January March 2001) Introduction The Producer Price Index-Agriculture (PPI-A) gives a measure of the average change in the selling prices which producers receive
Babson Capital/UNC Charlotte Economic Forecast. May 13, 2014
 Babson Capital/UNC Charlotte Economic Forecast May 13, 2014 Outline for Today Myths and Realities of this Recovery Positive Economic Signs Negative Economic Signs Outlook for 2014 The Employment Picture
Little Athletics NSW. 2018/2019 Season. Age Group Information Handbook / 1
 Little Athletics NSW Age Group Information Handbook 2018/2019 Season / 1 Little Athletics NSW 2018/19 Season Age Group Information Handbook Introduction From the commencement of the 2018/2019 competition
Manufacturers continue capacity expansion as technology orders grow
 Contact: Penny Brown, AMT, 703-827-5275 pbrown@amtonline.org For Release: September 10, 2018 Manufacturers continue capacity expansion as technology orders grow Manufacturing technology orders for July
3. EXCEL FORMULAS & TABLES
 Fall 2017 CS130 - Excel Formulas & Tables 1 3. EXCEL FORMULAS & TABLES Fall 2017 Fall 2017 CS130 - Excel Formulas & Tables 2 Cell References Absolute reference - refer to cells by their fixed position.
DEC DASHBOARD. Positive Response Compliance DEC. Compliant Tickets : On-Time Performance Analysis. December % Late.
 Positive Response Compliance 215 Compliant 215 Non-Compliant 216 Compliant 216 Non-Compliant 1% 87% 96% 86% 96% 88% 97% 89% 97% 89% 98% 88% 97% 86% 96% 92% 97% 93% 97% 94% 97% 96% 97% 94% 97% 8% 6% 4%
JAN DASHBOARD. Positive Response Compliance JAN. Compliant Tickets : On-Time Performance Analysis. January % Late.
 Positive Response Compliance 216 Compliant 216 Non-Compliant 217 Compliant 217 Non-Compliant 1% 96% 97% 8% 6% 4% 2% 4% 3% FEB MAR APR MAY JUN JUL AUG SEP OCT NOV DEC 8% Late Compliant Tickets : On-Time
nipigon.net Township of Nipigon 2018 Community Profile
 nipigon.net Township of Nipigon V 1.0 February 2018 2018 Nipigon nipigon.net nipigon.net Township of Nipigon nipigon.net Township of Nipigon nipigon.net Township of Nipigon nipigon.net Township of Nipigon
United Nations Conference on Trade and Development
 United Nations Conference on Trade and Development 11 th MULTI-YEAR EXPERT MEETING ON COMMODITIES AND DEVELOPMENT 15-16 April 2019, Geneva Saudi economic growth strategy on the face of oil price uncertainty
UK Seafood Industry Sources : Nielsen ScanTrack & HomeScan MAT , NPD Crest MAT Dec 2014, Marine Management Organisation, Cefas Weymouth
 UK Seafood Industry 2014 Sources : Nielsen ScanTrack & HomeScan MAT 03.01.15, NPD Crest MAT Dec 2014, Marine Management Organisation, Cefas Weymouth UK consumer purchased 6.33bn of seafood in 2014 +3.3%
Economy On The Rebound
 Economy On The Rebound Robert Johnson Associate Director of Economic Analysis November 17, 2009 robert.johnson@morningstar.com (312) 696-6103 2009, Morningstar, Inc. All rights reserved. Executive
A review of 2015 fatal collision statistics as of 31 December 2015
 A review of fatal collision statistics as of 31 December This report summarises the main trends in road fatalities that have emerged in. This has been prepared by the Road Safety Authority following analysis
U.S. and Colorado Economic Outlook National Association of Industrial and Office Parks. Business Research Division Leeds School of Business
 U.S. and Colorado Economic Outlook National Association of Industrial and Office Parks Presented by the Business Research Division Leeds School of Business University of Colorado at Boulder U.S. Economic
2016 1H Results Presentation. Milan, 28 th July 2016
 2016 1H Results Presentation Milan, 28 th July 2016 Broadcasting & Advertising ITALY 1H 2016 Macro-economic indicators GDP & HH EXPENDITURE y.o.y growth rate, Source: ISTAT GOOD & SERVICE CONSUMPTION y.o.y
September 2018 FY Key Performance Report
 September 20 FY 2019 - Key Performance Report Management Notes: The information in this report is based on the FY 2019 Operating Budget, adopted by the Board on June 11, 20. RT s farebox recovery ratio
Southern Lodging Summit Memphis, TN. Presented by Randy Smith Founder Smith Travel Research
 Southern Lodging Summit Memphis, TN Presented by Randy Smith Founder Smith Travel Research Total US - Key Statistics 12-Months Ending July 2012 % Change Hotels 52.3 k Room Supply 1.8 bn 0.4% Room Demand
Outlook for the U.S. Livestock and Poultry Sectors in 2012 Presented By Shayle D. Shagam World Agricultural Outlook Board, USDA
 Outlook for the U.S. Livestock and Poultry Sectors in 2012 Presented By Shayle D. Shagam World Agricultural Outlook Board, USDA USDA Outlook Forum Washington, D.C. February 24, 2012 Situation Facing Livestock
Further Opening Up and Reform of China s Capital Market
 Further Opening Up and Reform of China s Capital Market Haizhou Huang January 7, 2016 China economy and capital market: Finding new normal 1 Macro: We expect China GDP to grow 6.9% in 2015 and 6.8% in
Paper 2. Mathematics test. Calculator allowed. First name. Last name. School KEY STAGE TIER
 265279_p2_35_skunk.qxp 20/6/05 10:04 am Page 1 Ma KEY STAGE 3 TIER 3 5 2005 Mathematics test Paper 2 Calculator allowed Please read this page, but do not open your booklet until your teacher tells you
UK Integrated Behaviour Change Programmes
 UK Integrated Behaviour Change Programmes 17 th November 2009 ACT TDM Summit Conference Daniel Johnson, Transport for London Nicky Ward, Steer Davies Gleave Structure 1. UK travel behaviour change 2. An
Analyzing the Energy Economy Michael Plante Senior Research Economist
 Federal Reserve Bank of Dallas Analyzing the Energy Economy Michael Plante Senior Research Economist Disclaimer Disclaimer: The statements in this presentation do not represent the official views of the
Zions Bank Economic Overview
 Zions Bank Economic Overview Veteran Owned Business Conference May 11, 2018 Dow Tops 26,000 Up 48% Since 2016 Election Jan 26, 2018 26,616 Oct 30, 2016 17,888 Source: Wall Street Journal Dow Around Correction
The Herzliya Conference The Economic Dimension Prof. Rafi Melnick Provost, Interdisciplinary Center (IDC) Herzliya
 Herzliya") The Herzliya Conference The Economic Dimension 2009 Provost, Interdisciplinary Center (IDC) Herzliya The Big Issues The broken crystal ball A crisis that happens once in 100 years From a country oriented
The Herzliya Conference The Economic Dimension 2009 Provost, Interdisciplinary Center (IDC) Herzliya The Big Issues The broken crystal ball A crisis that happens once in 100 years From a country oriented
May 2018 FY Key Performance Report
 May 20 FY 20 - Key Performance Report Management Notes: The information in this report is based on the FY 20 Operating Budget, Amendment 2, adopted by the Board on January 22, 20. RT s farebox recovery
September 2017 MLS Statistical Report. Residential Inventory
 September 217 MLS Statistical Report Residential Inventory 2 2 1 1 21 216 217 Summary Inventories: Residential inventory is down 1%, Lots / Land inventory is down 13% and commercial inventory was down
SEASONAL PRICES for TENNESSEE FEEDER CATTLE and COWS
 SEASONAL PRICES for TENNESSEE FEEDER CATTLE and COWS Tammy L. McKinley Extension Specialist Agricultural & Resource Economics economics.ag.utk.edu AE16-06 July 2016 TABLE OF CONTENTS Seasonal : Introduction...
Bluetongue Disease (BT)
") Bluetongue Disease (BT) Analysis of ADNS data since 01/2018 Reporting period: 2018-01-01 2018-12-09 Data query: 2018-12-10 AGES DSR Austrian Agency for Health and Food Safety www.ages.at Parameters Data
Bluetongue Disease (BT) Analysis of ADNS data since 01/2018 Reporting period: 2018-01-01 2018-12-09 Data query: 2018-12-10 AGES DSR Austrian Agency for Health and Food Safety www.ages.at Parameters Data
Zions Bank Economic Overview
 Zions Bank Economic Overview Intermountain Credit Education League May 10, 2018 Dow Tops 26,000 Up 48% Since 2016 Election Jan 26, 2018 26,616 Oct 30, 2016 17,888 Source: Wall Street Journal Dow Around
Golf Course Metrics WHEREAS:
 Golf Metrics Update Golf Course Metrics WHEREAS: 1. The Board holds three public golf courses and three pitch and putt courses in its jurisdiction; 2. These courses provide citizens with (181 - golf only)
Discounted Cash Flow Analysis. Basic Information. Smith Investment Group. Property Address: 456 Sample St, Sampletown, SA, Year Built: 1995
 Discounted Cash Flow Analysis Prepared For: Company: Prepared By: Company: Mr. John Smith Smith Investment Group Sample Underwriter Sample Analysis Basic Information Property Name: Sample Retail Property
Agricultural Commodity Outlook: Grain, Forage & Cattle Markets
 Agricultural Commodity Outlook: Grain, Forage & Cattle Markets Stephen R. Koontz Professor & extension economist Department of Agricultural & Resource Economics Colorado State University Stephen.Koontz@ColoState.Edu
Grain Market Outlook and Marketing Strategies Presented By: Brian Roach
 Grain Market Outlook and Marketing Strategies Presented By: Brian Roach Disclaimer: Futures/options trading involves substantial risk of loss and trading may not be suitable for all investors. You should
SA economic review Kevin Lings. August 2018
 SA economic review Kevin Lings August 2018 South Africa real GDP growth year-on-year %y/y 8 7 6 5 Ave 4.3% 4 Ave 2.5% 3 2 Ave 0.9% 1 0-1 -2-3 00 01 02 03 04 05 06 07 08 09 10 11 12 13 14 15 16 17 18 2
The Changing Global Economy Impacts on Seaports and Trade Dr. Walter Kemmsies
 The Changing Global Economy Impacts on Seaports and Trade Dr. Walter Kemmsies Chief Economist, PAGI Group, JLL (Port, Airport & Global Infrastructure) Agenda Where are we in the cycle? What are the barriers
Phone: Fax: Commissioners Road, W. London, Ontario N6J 1Y3 STATISTICAL REPORT. (for month ending April 30, 2017)
") Phone: 519-641-1400 Fax: 519-641-1419 342 Commissioners Road, W. London, Ontario N6J 1Y3 STATISTICAL REPORT (for month ending April 30, 2017) Table of Contents News Release for April 2017 3 Market Report
Phone: 519-641-1400 Fax: 519-641-1419 342 Commissioners Road, W. London, Ontario N6J 1Y3 STATISTICAL REPORT (for month ending April 30, 2017) Table of Contents News Release for April 2017 3 Market Report
Land Values and Chinese Agriculture
 Land Values and Chinese Agriculture Wendong Zhang Assistant Professor of Economics and Extension Economist wdzhang@iastate.edu 515-294-2536 2016 Pro-Ag Meetings, Clarinda, IA, December 15 th, 2016 The
3. EXCEL FORMULAS & TABLES
 Winter 2017 CS130 - Excel Formulas & Tables 1 3. EXCEL FORMULAS & TABLES Winter 2017 Winter 2017 CS130 - Excel Formulas & Tables 2 Cell References Absolute reference - refer to cells by their fixed position.
January 2019 FY Key Performance Report
 January 2019 FY 2019 - Key Performance Report Management Notes: The information in this report is based on the FY 2019 Operating Budget, adopted by the Board on June 11, 20. RT s farebox recovery ratio
Iowa Land Values. Wendong Zhang Assistant Professor of Economics and Extension Economist
 Iowa Land Values Wendong Zhang Assistant Professor of Economics and Extension Economist wdzhang@iastate.edu 515-294-2536 2017 U.S. Bank Ag Summit, Ames, IA, January 10 th, 2017 The new Mike Duffy 30 29
Market Insights. June 30, 2018
 June 30, 2018 Economic Overview 2 Global & Regional Growth Forecasts IMF GDP Forecasts (% change YoY) 2010 2011 2012 2013 2014 2015 2016 2017 2018 Advanced Economies 1.7% 1.2% 1.3% 2.1% 2.3% 1.7% 2.3%
System Flexibility Indicators
 System Flexibility Indicators Place your chosen image here. The four corners must just cover the arrow tips. For covers, the three pictures should be the same size and in a straight line. Operational Forum
President and Chief Executive Officer Federal Reserve Bank of New York Washington and Lee University H. Parker Willis Lecture in Political Economics
 The U.S. Economic Outlook Chartspresented by WilliamC Dudley Charts presented by William C. Dudley President and Chief Executive Officer Federal Reserve Bank of New York Washington and Lee University H.
Dr. James P. Gaines Research Economist recenter.tamu.edu
 Texas Uncertain Economy in a World of Uncertain Oil Prices Dr. James P. Gaines Research Economist recenter.tamu.edu National Economic Recovery still Going 2 U.S. Outlook Expected GDP growth still modest:
Media Kit Contents. Company Profile... Audience Profile... Site Traffic... Ad Types... Ad Placements... Web Reporting... Rate Card...
 Media Kit 2009 Contents Company Profile... Audience Profile... Site Traffic... Ad Types... Ad Placements... Web Reporting... Rate Card... Page 2 Page 3 Page 4 Page 5 Page 6 Page 11 Page 12 Company Profile
Market Insights. March 29, 2019
 March 29, 2019 Economic Overview 2 Global & Regional Growth Forecasts IMF GDP Forecasts (% change YoY) 2010 2011 2012 2013 2014 2015 2016 2017 2018 Advanced Economies 1.2% 1.4% 2.1% 2.3% 1.7% 2.4% 2.3%