Appendix I. US 50/South Shore Community Revitalization (Stateline) Project Caltrans Project Report Traffic Operations Analysis Update
|
|
|
- Tyrone Tate
- 5 years ago
- Views:
Transcription
1 Appendix I /South Shore Community Revitalization (Stateline) Project Caltrans Project Report Traffic Operations Analysis Update
2 To: Cc: Technical Memorandum From: Date: 02/23/2016 File: Project Development Team Caltrans District 3 John Holder, Damion Farley Nevada Department of Transportation (NDOT) Bill Glaser Tahoe Transportation District (TTD) Russ Nygaard Tahoe Regional Planning Agency (TRPA) Keith Norberg Wood Rodgers, Inc. Mark Rayback, Steven Robinson Wood Rodgers, Inc. Nawid Nessar, PE,TE, Mario Tambellini, EIT J:\Jobs\8436_Tahoe\01_US50_PR\Traffic\Memos\ February\8436_US50Stateline_Traffic_Operations_Analysis_Update_ docx Project #: WR #: RE: South Shore Community Revitalization (Stateline) Project Caltrans Project Report Traffic Operations Analysis Update INTRODUCTION & BACKGROUND Draft A Traffic Operations Analysis (TOA) memorandum (Wood Rodgers, dated 4/15/2009) was originally completed in support of the Project Study Report (PSR, approved by Caltrans District 3 in June 2010) phase for the construction of improvements to the segment of the US Highway 50 () corridor between Pioneer Trail and Lake Parkway, in/through the Stateline area. The Project Approval and Environmental Documentation (PA&ED) phase was subsequently initiated by Tahoe Transportation District (TTD) in September 2010 to prepare the Environmental Document and the Caltrans Project Report (PR) for the project. As part of the PR phase, a technical memorandum (Wood Rodgers, dated September 2010) was completed, that presented the results of Wood Rodgers review of study area traffic trends between year (existing conditions year used in the PSR) and year (existing conditions year at the time the PR was initiated). The September 2010 Memorandum determined that the traffic operations analysis originally performed in the PSR phase was still reflective of existing conditions. A Traffic Operations Supplement (dated 01/25/2012) was also issued that evaluated design year (year 2035) traffic operations for the single project build alternative that was under active consideration at the time. The January 2012 Supplement was prepared in order to analyze two project build alternatives that had been updated/modified since the PSR phase under the then design year of 2035 only. Subsequently, a technical memorandum dated (12/14/2012) was issued that summarized Wood Rodgers review and analysis of the latest 2012 traffic volumes, and presented a comprehensive update to existing counts and future-year traffic forecasts and traffic operations. The December 2012 Memorandum was prepared in order to reanalyze all proposed project alternatives using updated year 2012 existing (at the time) and future year forecast traffic volumes. This current technical memorandum was prepared in order to summarize traffic operations under updated project alternatives that have been proposed as of January 2016, as well as comprehensively update all elements of analysis completed since the PSR phase. This memorandum includes the following elements: A discussion of current/recent and historical traffic/transportation conditions within the study area C Street, Bldg-100-B Sacramento, California Tel: Fax:
3 South Shore Community Revitalization Project Existing (or 2015 base year) conditions traffic operational analysis for study intersections and roadway/highway segments. A traffic safety (i.e. accident data) analysis for existing study facilities. An Existing (2015) plus Project conditions analysis in order to support a CEQA evaluation. A discussion of Year 2020 (interim future year or project opening day ) traffic volume forecasts, and year 2020 traffic operational analysis with and without project improvements in place. A discussion of Year 2040 (i.e., 20-year design) traffic volume forecasts, and Year 2040 traffic operational analysis both with and without the proposed project improvement alternatives. WR# February 2016 Page 2
4 South Shore Community Revitalization Project TABLE OF CONTENTS INTRODUCTION & BACKGROUND... 1 TABLE OF CONTENTS... 3 CURRENT SETTING... 4 Existing Transportation Facilities... 4 Bicycle and Pedestrian Facilities... 6 Transit Access and Facilities... 8 ANALYSIS METHODOLOGY... 9 SAFETY ANALYSIS RECENT TRAFFIC TRENDS AND EXISTING COUNTS EXISTING CONDITIONS TRAFFIC OPERATIONS Intersection Operations Roadway Operations PROJECT DESCRIPTION FUTURE-YEAR TRAFFIC FORECASTS Year 2020 Traffic Forecasts Year 2040 Traffic Forecasts Future Year Transportation Network Improvements With Project (Alternatives B, C, D, and E) Forecasts YEAR 2020 NO-BUILD TRAFFIC OPERATIONS Intersection Operations Roadway Operations YEAR 2040 NO-BUILD TRAFFIC OPERATIONS Intersection Operations Roadway Operations EXISTING PLUS PROJECT TRAFFIC OPERATIONS Intersection Operations Roadway Operations YEAR 2020 WITH PROJECT (OPENING DAY) TRAFFIC OPERATIONS Intersection Operations Roadway Operations YEAR 2040 WITH PROJECT TRAFFIC OPERATIONS Intersection Operations Roadway Operations PROPOSED DEVELOPMENT TRAFFIC IMPACTS Intersection Operations Roadway Operations Parking Impacts VMT ANALYSIS Proposed Transportation Improvements VMT Analysis Proposed New Developments VMT Analysis WR# February 2016 Page 3

5 South Shore Community Revitalization Project CURRENT SETTING The study area consists of the Tahoe South Shore Stateline area located on the border between the States of California and Nevada. The 1.1 mile-long corridor encompasses the casinos in the Stateline area, the Heavenly Village Redevelopment area, as well as adjacent commercial, lodging, and residential areas. The study area is defined by the following boundary points:, 1,800 feet west of its intersection with Pioneer Trail Pioneer Trail, 1,400 feet south of its intersection with The Loop Road, consisting of Pine Boulevard to the west and Lake Parkway to the east., 200 feet north of its intersection with Kingsbury Grade (Nevada State Route 207) EXISTING TRANSPORTATION FACILITIES US Highway 50 is a State and trans-continental highway that traverses east-west through the study area. Caltrans District 3 s Transportation Concept Report and Corridor System Management Plan (June, 2014) categorizes the study segment of as a 4-lane conventional urban arterial with a center turn lane. The study corridor segment is functionally classified as a Freeway & Expressway (F&E) and Terminal Access Route. The corridor is considered a National Highway System (NHS) route and an Interregional Road System (IRRS) route, but not a scenic route or lifeline route. Regionally, connects the Sacramento metropolitan region in the State of California to Carson City in the State of Nevada and beyond. Within the Project area, is a four-lane arterial with a continuous two-way left-turn median lane that transitions to dedicated left-turn pockets at major intersections. During peak-hours in the winter and summer seasons, the corridor operates at near-capacity conditions in and around the casino core, resulting in long queues. As this area becomes congested during peak time periods, there is a known propensity by travelers to divert along the local street network to bypass congestion that occurs along the corridor. This typically prevents the corridor from attaining full operational failure (identified as the formation of extensive queuing to the east and west of the casino core area). Figure 1 Existing Eastbound Queuing West of Pioneer Trail (Looking West) (Source: Google Maps, May 2015) Long queues on eastbound heading into the casino core are very common. May 2015 conditions shown; queues are longer during summer. WR# February 2016 Page 4
6 South Shore Community Revitalization Project intersections are traffic signal-controlled at Kingsbury Grade (Nevada State Route 207), Lake Parkway, nue, Friday Avenue, Park Avenue, Pioneer Trail, and Ski Run Boulevard, as well as at other intersections east and west of the study area. A traffic signal with pedestrianactivated scramble phase also exists along between the CVS Pharmacy / Montbleu Resort and the Hard Rock Casino and Resort. Based on a review of Caltrans 2014 traffic count data, the segment east of Pioneer Trail and west of Park Avenue experiences annual average daily traffic (AADT) of 27,500 vehicles and a peak month ADT of 34,500 vehicles. Based on 2014 NDOT traffic counts, the AADT on was 21,500 vehicles approximately 300 feet east of the California-Nevada border. This technical memorandum considers an east-west roadway. Pioneer Trail is a two-lane arterial that connects in Meyers to (Lake Tahoe Boulevard) near Stateline. Within the study area, Pioneer Trail intersects at a signalized intersection located to the east of the Ski Run Boulevard intersection. The Pioneer Trail/ intersection currently operates as a four-phase signal with protected left-turn movements for the eastbound and westbound approaches, and split phasing for the northbound and southbound approaches. As the only east-west parallel alternative to, Pioneer Trail currently carries approximately 10,800 vehicles per day according to the most recent 2014 traffic counts from El Dorado County s Hourly Traffic Count Reports database available on their website. Park Avenue is a two-lane local roadway serving the Stateline area. Park Avenue serves residential traffic, as well as recreational traffic associated with the various hotel/casino and retail uses located in the Stateline area. The Park Avenue intersection with is signalized, with protected east-west left-turn movements from. forms the southeast leg of this intersection and provides direct access to the Heavenly Village redevelopment area to the south of. continues southeast and connects with Montreal Road / Lake Parkway. nue is a two-lane local roadway in the Stateline area that is aligned immediately adjacent to the California/Nevada border in California. Land use along nue consists mainly of hotel and motel lodging units, with some single-family residences on the north end near Lake Tahoe. nue intersects at a signalized intersection that operates with protected left-turn movements from. The fourth (southern) leg of this intersection provides an entrance-only driveway access to the Lake Tahoe Resort Hotel. Lake Parkway West forms the secondary access loop roadway on the west/north (Lake Tahoe) side of in Nevada, providing access to/from the Edgewood Golf Course, a bank building, and to the rear of Harvey s and the Hard Rock Hotel on the Nevada side of Stateline. At the state line, it provides direct continuity to Pine Boulevard that extends further west to connect with Park Avenue. Lake Parkway East is the loop roadway on the east/south (mountain) side of. It provides access to/from the rear of Montbleu Resort and Harrah s, and provides direct continuity to Montreal Road at. Lake Parkway West and East intersect with at a signalized intersection that provides protected left-turn movements from. Montreal Road is a two-lane local roadway that extends between Chonokis Road to the west to to the east and continues as Lake Parkway further east to connect to. Montreal Road is an alternate route to for the critical segment between Pioneer Trail and. Montreal Road currently carries approximately 6,000-7,000 vehicles per day (estimated from year 2013 peak period counts obtained from the Heavenly Mountain Resort Epic Discovery Project EIR/EIS Transportation, Parking, and Circulation Section (Hauge Brueck Associates, February 2015)). Local Roads within/near the project study area include Chonokis Road, Moss Road, and Echo Road. These two-lane residential roadways are located east of pioneer trail just south of the Village Center WR# February 2016 Page 5
7 South Shore Community Revitalization Project Shopping Center. All three of these local roads provide direct access between Pioneer Trail and Montreal Road and are heavily used as cut-through routes to access Lake Parkway from Pioneer Trail in order to bypass congestion on through the casino core. Due to the large volumes cut-through traffic, these local roadways experience much higher than typical daily traffic volumes and speeds. BICYCLE AND PEDESTRIAN FACILITIES The study area currently includes a few bicycle facilities at the west end of the Project area. A linear park provides a separated Class I facility along the northwest side of between Pioneer Trail and Ski Run Boulevard. Within the study area, there are a few segments of sidewalks on and south of. There is a pedestrian underpass beneath between Harvey s and Harrah s for pedestrians to walk between the casino buildings. A protected pedestrian crossing of is provided at the traffic signals located at Pioneer Trail, Park Avenue, Friday Avenue, Stateline Avenue and Lake Parkway. Along other streets, the sidewalks are limited and have frequent discontinuities. A traffic signal that has a pedestrian scramble signal phase crossing is provided on, east of nue, between Montbleu Resort and Hard Rock Casino and Hotel. Bicycle Route Classifications Caltrans classifies bikeways as follows: Class I Bikeway (Bike Path) Provides a completely separated right-of-way for the exclusive use of bicycles and pedestrians with crossflow by motorists minimized. Class II Bikeway (Bike Lane) Provides a striped lane for one-way bicycle travel on a street or highway. Class III Bikeway (Bike Route) Provides for shared use with bicycle or motor vehicle traffic, typically on lower volume roadways. Class IV Bikeway (Separated Bikeway / Cycle Track) A bikeway for the exclusive use of bicycles and includes a separation required between the separated bikeway and the through vehicular traffic. The separation may include, but is not limited to, grade separation, flexible posts, inflexible physical barriers, or on-street parking. WR# February 2016 Page 6
 WR# 8436.")
8 South Shore Community Revitalization Project Figure 2 Typical Class I, II, and III Bikeway Configurations (Source: Lake Tahoe Regional Bicycle and Pedestrian Plan, 2010) WR# February 2016 Page 7

9 South Shore Community Revitalization Project Figure 3 Typical Class IV Bikeway (Cycle Track) Configuration (Source: City of San Diego Bicycle Master Plan Update, June 2011) TRANSIT ACCESS AND FACILITIES One-way cycle track shown, but can be two-way as well. The South Shore area is currently served by the BlueGO transit system, which includes local fixedroute and commuter bus services. The Stateline Transit Center is located within the study area at the intersection of and Transit Way, adjacent to Heavenly Mountain Resort. BlueGO bus routes that operate within the study area are as follows: Route 50 operates between the South Y and Kingsbury Transit Centers from 5:00 AM to 11:00 PM with one-hour headways. Route 53 operates between the South Y and Kingsbury Transit Centers at one-hour headways from about 7:00 AM to 11:00 PM Monday through Saturday with special hours offered on Sundays, holidays, and late nights. Route 23 operates between the Stateline Transit Center, the Kingsbury Transit Center, and Ridge Resort/Heavenly Mountain Resort from approximately 7:00 AM to 12:30 AM at onehour headways with extended service hours on Fridays and Saturdays. BlueGO offers winter-time ski shuttles routes from Heavenly Mountain Resort to various South Shore and ski destinations. Tahoe Transportation District offers an ADA Demand Response Service throughout the area available during fixed-route service hours. WR# February 2016 Page 8
10 South Shore Community Revitalization Project ANALYSIS METHODOLOGY Traffic operations have been quantified through the determination of "Level of Service" (). is a qualitative measure of traffic operating conditions, whereby a letter grade "A" through "F" is assigned to an intersection or roadway segment, representing progressively worsening traffic operations. In this analysis, has been calculated for all intersection control types using methods documented in the Transportation Research Board (TRB) Publication Highway Capacity Manual, Fifth Edition, 2010 (HCM-2010). For signalized and all-way-stop-controlled (AWSC) intersections, the intersection delays and reported are the average values for the whole intersection. For two-waystop-controlled (TWSC) intersections, the worst-case movement delays and are reported. The delay-based HCM-2010 criteria for different types of intersection control are outlined in Table 1. The speed-based thresholds for different types of urban street classifications are shown in Table 2. Table 1 - Level-of-Service () Definitions and Criteria for Intersections Level of Service A B C D E F Flow Type Stable Flow Stable Flow Stable Flow Approaching Unstable Flow Unstable Flow Forced Flow Source: HCM-2010, Exhibits 18-6, 19-1 and 20-2 Operational Characteristics Free-flow conditions with negligible to minimal delays. Excellent progression with most vehicles arriving during the green phase and not having to stop at all. Nearly all drivers find freedom of operation. Good progression with slight delays. Short cycle-lengths typical. Relatively more vehicles stop than under A. Vehicle platoons are formed. Drivers begin to feel somewhat restricted within groups of vehicles. Relatively higher delays resulting from fair progression and/or longer cycle lengths. Individual cycle failures may begin to appear. The number of vehicles stopping is significant, although many still pass through without stopping. Most drivers feel somewhat restricted. Somewhat congested conditions. Longer but tolerable delays may result from unfavorable progression, long cycle lengths, and/or high volume-to-capacity ratios. Many vehicles are stopped. Individual cycle failures may be noticeable. Drivers feel restricted during short periods due to temporary back-ups. Congested conditions. Significant delays result from poor progression, long cycle lengths, and high volume-to-capacity ratios. Individual cycle failures occur frequently. There are typically long queues of vehicles waiting upstream of the intersection. Driver maneuverability is very restricted. Jammed or grid-lock type operating conditions. Generally considered to be unacceptable for most drivers. Zero or very poor progression, with over-saturation or high volume-tocapacity ratios. Several individual cycle failures occur. Queue spillovers from other locations restrict or prevent movement. Intersection Control (seconds/vehicle) Two-Way-Stop Signal or All-Way Stop Control Control < > > > > > > > > > 80 > 50 WR# February 2016 Page 9
11 South Shore Community Revitalization Project Table 2- Speed-based Level-of-Service () Criteria for Roadway/Highway Segments Urban Street Class I II III IV Free Flow Speed Range mph mph mph mph Typical Free Flow Speed 50 mph 40 mph 35 mph 30 mph Average Travel Speed (mph) A > 42 > 35 > 30 > 25 B >34 42 >28 35 >24 30 >19 25 C >27 34 >22 28 >18 24 >13 19 D >21 27 >17 22 >14 18 >9 13 E >16 21 >13 17 >10 14 >7 9 F Source: HCM 2000, Exhibit 15-2 The Caltrans Guide for the Preparation of Traffic Impact Studies (dated December 2002) states that: Caltrans endeavors to maintain a target at the transition between C and D on State highway facilities, however, Caltrans acknowledges that this may not be always feasible and recommends that the lead agency consult with Caltrans to determine the appropriate target. NDOT has established D ( little driver freedom at tolerable operating speeds, approaching unstable flow ) as its minimum objective for planned improvements. Pursuant to the Tahoe Regional Planning Agency (TRPA) Regional Plan Goals and Policies peak period traffic operations should not exceed the following levels: C on rural scenic/recreational roads D in rural developed areas. D on urban roads D for signalized intersections E may be acceptable during peak periods not to exceed four hours per day. Based on the above agency policies, D has been generally used as the minimum acceptable standard on all study facilities that fall under Caltrans or NDOT right of way. For study facilities that fall under local agency jurisdiction, TRPA-defined D operations are still used as the minimum acceptable threshold, however, peak hour E is regarded acceptable if the duration of such operations do not exceed four hours per day. Furthermore, Caltrans staff has indicated that E is acceptable on Caltrans facilities if such operations meet the TRPA standard of E for no more than four hours per day (discussed during the Project Development Team Meeting for Bypass Project Study Report Development, March 18, 2009; meeting minutes attached as Appendix Exhibit 7). In this study, a general suburban Peak Hour Factor (PHF) of 0.92 (as recommended by HCM-2010) has been used in the study intersection analyses under all analysis scenarios. Based on a review of Caltrans and NDOT AADT, and truck counts for years , a heavy-vehicle percentage of 3% in the peak hour periods was applied to east-west through approaches at the study intersections and a 2% peak-hour heavy-vehicle percentage was used for the north-south local street approaches. Saturation flow rates of 1,300 vehicles per hour per lane (vphpl) for summer peak hour, and 1,500 vphpl for annual average peak hour, were used for eastbound & westbound movements at study intersections west of and including the / nue intersection. Saturation flow rate represents the number of vehicles that can pass through an intersection during an hour of green time and according to the Highway Capacity Manual, can be affected/reduced by a number of factors including lane widths, pedestrian crossings/conflicts, vehicle compositions, and a high number of turning vehicles, among others. WR# February 2016 Page 10

12 South Shore Community Revitalization Project Figure 4 Existing Bike and Pedestrian Activity at / Park Ave / Intersection (Source: Google Maps, May 2015) between Pioneer Trail and Lake Parkway experiences high bike and pedestrian volumes that contribute to low saturation flow rates. May 2015 conditions shown; volumes are higher during summer. Based on observation of low travel speeds and significant queueing on during the summer peak, in the Stateline area is assumed to have lower than typical saturation flow rates (typical saturation flow rates are generally 1,900 vphpl). The lower than typical saturation flow rates are caused by high volumes of bikes, pedestrians, busses, and other modes of non-motorized transportation (such as carriages) traveling along and/or crossing in the Stateline area, and a large number of high volume driveways (casinos, restaurants, shops, etc.) with direct access to between Pioneer Trail and Lake Parkway. Additionally, in many cases along the corridor, 95 th percentile intersection queues are metered by upstream signals or volume exceeds intersection capacity. As a result, saturation headway would not be reached during the peak hour, also leading to lower than typical saturation flow rates. A saturation flow rate of 1,750 vphpl was used for all other study intersections and turning movements, including facilities on Pine Boulevard and Lake Parkway, under all analysis scenarios. These facilities experience smaller amounts of pedestrian/bike/transit traffic than but have smaller than typical lane and shoulder widths. Therefore, a saturation flow rate slightly lower than the typical value was used. WR# February 2016 Page 11

13 South Shore Community Revitalization Project Figure 5 Other Modes of Transportation / Causes of Stateline Area Congestion (Source: Google Maps, May 2015) Horse drawn carriages frequently travel on near the resorts/casinos, slowing down traffic and contributing to low saturation flow rates. The / nue intersection is shown. Synchro/ SimTraffic 8 operational analysis software was used to implement the HCM-2010 analysis procedures for intersection and arterial segment operations analysis. SIDRA Version 6.0 software was used for evaluation of roundabout operations. In order to determine whether significance should be associated with unsignalized intersection operating conditions, a supplemental traffic signal warrant analysis was also completed. The term signal warrants refers to the list of established criteria used by Caltrans, NDOT and other public agencies to quantitatively justify or ascertain the need for installation of a traffic signal at an unsignalized intersection location. Per Caltrans requirements, this study employs signal warrant criteria presented in the California Manual on Uniform Traffic Control Devices, 2014 Edition for unsignalized intersections located in California. Per NDOT requirements, this study employs signal warrant criteria presented in the Federal Highway Administration s (FHWA) 2009 MUTCD with Revisions 1 and 2, May 2012 for unsignalized intersections located in Nevada. From here on out, it can be assumed that the term MUTCD in this technical memorandum refers to the California MUTCD for intersections in California, and the FHWA MUTCD for intersections in Nevada. The MUTCD signal warrant criteria are based upon several factors including volume of vehicular and pedestrian traffic, location of school areas, frequency of accidents, etc. This study has utilized MUTCD based Peak-Hour-Volume-based Warrant 3 (same under both California and FHWA MUTCD). Both the California and FHWA MUTCD indicate the satisfaction of a traffic signal warrant or warrants shall not in itself require the installation of a traffic control signal. To determine whether E operations are projected to occur at a location for more than four hours a day, hourly traffic volumes were obtained from Caltrans Performance Measurement System (PeMS) database for Fridays and Saturdays during summer 2015 on near Midway Road (closest available count station to the project area). It was determined from the summer hourly counts that the fifth highest hour of traffic volumes throughout a summer day (note that the 5 th highest hour of traffic volumes overall in a day was selected, regardless of what time of day it occurred and not necessarily near the PM peak hour/period) was typically about six (6) percent lower than the traffic volumes during the peak hour. Therefore, any facilities projected to operate at E under the WR# February 2016 Page 12
14 South Shore Community Revitalization Project peak hour were reanalyzed with six (6) percent lower volumes (i.e. analyzed under 5 th highest hour traffic conditions). If the six (6) percent lower volumes still resulted in the facility operating at E, it was determined that the E conditions lasted for more than four hours. Note that AADT-based projections, roadway Levels of Service, and capacity tables for all evaluated scenarios/alternatives are included as Appendix Tables 2 4 for reference purposes. However, per agency criteria, the peak hour based intersectional and arterial operations are regarded as the most appropriate measures of effectiveness for study area traffic operations under all scenarios. This study accounts for pedestrian conflicts by incorporating pedestrian volumes and pedestrian signal phases with estimated calls per hour according to the location of existing pedestrian crossings at each study intersection. Relative quantity of pedestrian conflicts per hour at each study intersection were estimated based on proximity to the commercial/retail core of the study network, i.e. the intersection with nue. Additionally, this study modeled the existing signalized intersection with pedestrian scramble phase located between Montbleu Resort and Hard Rock Hotel & Casino for all analyzed alternatives, with exception of the Skywalk alternative. Vehicle miles traveled (VMT) is the total miles traveled by vehicles within a specific region over a certain time period. TRPA has a general VMT threshold standard of reducing overall VMT within the TRPA region to 10% below 1981 levels. Therefore, any projects that result in an increase in regional VMT are generally regarded as having a negative impact, while any projects that result in a decrease in regional VMT are generally regarded as having a beneficial impact. A general VMT analysis was performed for each proposed project alternative to determine compliance with TRPA s VMT standard. VMT analysis is included in a later section of this report. SAFETY ANALYSIS Wood Rodgers reviewed TSAR traffic accident data records and TASAS accident data summaries provided by Caltrans District 3 for the study segments for the available most-recent three-year data period (January 1, 2010 through December 31, 2013). NDOT accident data was also obtained for the latest available three year period (October 1, 2012 through October 01, 2015) and summarized in Caltrans format for consistency. The data is summarized in Table 3 and Table 4. Intersection Location (Post Mile) Jurisdiction Table 3 - Accident Data Summary (Intersections) Tot Fat Inj F+I Number of Accidents Multi Veh Persons Actual Accident Rates (# of accidents / MV) Average Accident Rates (# of accidents / MV) Wet Dark Kld Inj Fat F+I Tot Fat F+I Tot / Pioneer Trail (PM ) Caltrans / Park Ave (PM ) Caltrans / (PM ) Caltrans /Lake Parkway Loop - NDOT Source: Caltrans District 3, NDOT Notes: MV = Million Vehicles, Fat = Fatalities, Inj = Injuries, Veh = Vehicle, Kld = Killed, F+I = Fatalities + Injuries, Tot = Total 1 Caltrans District 3 accident data is for period from January 1, 2011 to December 31, (All data and accident rates were provided by Caltrans.) 2 NDOT accident data is for period from October 1, 2012 to October 01, Average accident rates from Caltrans segments were used for the NDOT segment for comparison purposes. (Accident data was provided, but accident rates were calculated to match Caltrans format.) As shown in Table 3, at the intersections with Pioneer Trail, Park Avenue, and Stateline Avenue, the actual accident rates are less than the state average accident rates for fatal, fatal + injury WR# February 2016 Page 13
15 South Shore Community Revitalization Project (F+I), and total accidents. The / Lake Parkway Loop intersection had the most reported accidents with 14 and the most reported injury accidents with four (4). The / Lake Parkway Loop intersection had actual accidents rates higher than average accident rates for fatal + injury (F+I), and total accidents. Of the 14 accidents at the / Lake Parkway Loop intersection, a majority (10) were collisions between multiple vehicles. Rear-end (6) was the most commonly reported type of collision, which is the type most commonly associated with signalized intersections. The most frequently reported collision factor was followed too closely (4), while the most frequently reported driver factors were inattention/distraction (5) and had been drinking (1). Roadway Segment (Post Mile) Jurisdiction Table 4 - Accident Data Summary (Roadway Segments) Tot Fat Inj F+I Number of Accidents Multi Veh Persons Actual Accident Rates (# of accidents / MVM) Average Accident Rates (# of accidents / MVM) Wet Dark Kld Inj Fat F+I Tot Fat F+I Tot - b/w Pioneer Trail (PM ) and Stateline Ave (PM ) - Caltrans 1 - b/w and Kingsbury Grade Rd (Mile Marker ) - NDOT Source: Caltrans District 3, NDOT Notes: MVM = Million Vehicle Miles, Fat = Fatalities, Inj = Injuries, Veh = Vehicle, Kld = Killed, F+I = Fatalities + Injuries, Tot = Total 1 Caltrans District 3 accident data is for period from January 1, 2011 to December 31, (All data and accident rates were provided by Caltrans.) 2 NDOT accident data is for period from October 1, 2012 to October 1, Average accident rates from Caltrans segments were used for the NDOT segment for comparison purposes. (Accident data was provided, but accident rates were calculated to match Caltrans format.) As shown in Table 4, the actual accident rates of the segment between Pioneer Trail and nue are less than the state average accident rates for fatal, F+I, and total accidents. However, the actual accident rates along the segment of between nue and Kingsbury Grade are higher than state average accident rates for fatal, F+I, and total accidents. Over the three year data period, a total of 35 accidents were reported on the segment between nue and Kingsbury Grade that involved one (1) fatality and injuries to 19 persons. A majority (22) of the accidents involved a collision between multiple vehicles. Followed too Closely (11) and Speeding (5) were the most frequently reported collision factors while inattention/distraction (6) was the most commonly reported driver factor. Rear-end (18) was the most frequently reported type of collision. RECENT TRAFFIC TRENDS AND EXISTING COUNTS Caltrans and NDOT-published Annual Average Daily Traffic (AADT) count data from year 1992 through year 2014 were reviewed for the study segments of extending from west of Pioneer Trail to east of Kingsbury Grade. Table 5 illustrates the study highway/roadway segments traffic volumes from 1992 through WR# February 2016 Page 14
16 South Shore Community Revitalization Project Year Table 5 - Segments through Study Intersections - Recent Traffic Trends Just west of Pioneer Trail Two-Way Annual Average Daily Traffic (AADT) Volumes Between Pioneer Trail and Park Ave Just east of Park Avenue Just west of Just east of Just east of Kingsbury Grade ,000 47,000 46,000 34,000 31,100 n/a ,000 47,000 46,000 34,000 29,300 n/a ,000 47,000 46,000 34,000 29,070 n/a ,000 44,000 44,000 33,000 28,740 n/a ,500 41,000 44,500 33,000 27,900 n/a ,500 41,000 44,500 33,000 27,900 n/a ,500 41,000 44,500 33,000 26,700 n/a ,500 41,000 44,500 29,500 26,700 n/a ,500 41,000 44,500 28,000 27,800 n/a ,500 41,000 44,500 29,000 27,300 n/a ,500 41,000 34,000 33,000 27,600 n/a ,000 37,500 34,000 33,000 30,500 n/a ,500 37,500 33,500 33,000 30,800 n/a ,500 36,000 32,000 33,000 28,900 27, ,500 35,500 29,000 30,500 26,500 23, ,500 35,000 29,000 30,500 25,000 20, ,500 33,000 28,500 28,000 25,000 20, ,500 31,500 27,500 27,500 24,000 21, ,500 28,500 26,500 26,500 24,000 22, ,500 29,000 26,500 26,000 27,000 24, ,500 29,000 26,500 25,500 22,500 21, ,500 29,000 26,500 25,500 21,500 22, ,500 27,500 24,600 25,000 21,500 25,000 Source: Caltrans and NDOT Traffic Volumes Publications Notes: At certain locations, Caltrans and NDOT counts may have been actually conducted only once in every three years. n/a = data not available As seen from Table 5, traffic volumes on study segments have generally been decreasing over the last 22 years. Between 1992 and 2014, overall AADT on study segments between Pioneer Trail and just east of nue have decreased by 8,500-21,400 AADT (approximately 21%-47%), which is equal to a rate of approximately 1% to 3% per year. More recently, between 2006 and 2014, AADT volumes through the study segments between Pioneer Trail and just east of nue appear to have decreased by 3% to 23%, which is equal to a rate of approximately 0.5% to 3% per year. However, between 2012 and 2014 AADT on east of Kingsbury Grade Road has increased from 21,000 AADT to 25,000 AADT (approximately 20% growth). Additionally, based on the last five year AADT counts on Pioneer Trail, obtained from El Dorado County s Hourly Traffic Count Reports database available on their website, AADT on Pioneer Trail at South Lake Tahoe city limits has increased from 9,218 AADT in 2011 to 10,772 AADT in 2014 (approximately 17% growth). Based on last three years PeMS data, summer ADT on west of the project study area at Bigler Road has increased from 36,000 ADT to 37,000 ADT (approximately 3% growth) between 2012 and The growth on Pioneer Trail and west of the project study area, and on east of Kingsbury Grade Road, combined with the slight decrease in volumes on near the casinos, suggests that traffic volumes are on the increase in the South Shore area, but that vehicles are bypassing near the casinos by cutting through the area on the local streets. Existing summer peak hour conditions traffic counts for study intersections were obtained from the recently approved Heavenly Mountain Resort Epic Discovery Project EIR/EIS Transportation, WR# February 2016 Page 15
17 South Shore Community Revitalization Project Parking, and Circulation Section (Hauge Brueck Associates, February 2015). The Heavenly Mountain Resort counts were collected in December 2013 during the Friday PM peak hour (highest consecutive hour of counts between 3:00 PM and 6:00 PM) and then converted to August 2013 summer peak hour volumes using a seasonal conversion factor obtained from Caltrans PeMS data. Volumes for study intersections not included in the Heavenly Mountain Resort EIR were estimated using existing volumes from Appendix Figure 1 of the / South Shore Community Revitalization (Stateline) Project Caltrans Project Report Traffic Counts, Forecasts and Operations Update (Wood Rodgers, October 2012) as they were the next most recently available existing volumes for the project area. Volumes obtained from the October 2012 Operations Update were adjusted as necessary to match/balance with the 2013 Heavenly Mountain Resort EIR counts at neighboring intersections. This was done by calculating the percent change (i.e. growth factor ) in volumes between the October 2012 Operations Update and the Heavenly Mountain Resort EIR at neighboring common intersections and applying the resulting growth factor to the intersection volumes from the October 2012 Operations Update. These new factored intersection volumes were then manually adjusted as necessary to better balance with the neighboring intersection counts from the Heavenly Mountain Resort EIR. (Note: Since the volumes from the October 2012 Operations Update were based on the 2007 counts performed for the Loop Road project PSR, the volumes were generally higher than the 2013 Heavenly Mountain Resort EIR counts due to the downward traffic volume trend shown in Table 5. As a result, the volumes from the October 2012 Operations Update were generally factored downward to match Heavenly Mountain Resort EIR counts.) Annual average counts were obtained using a conversion factor calculated from latest Caltrans Count Book and PeMS AADT data. Based on the above recent traffic trends and analysis of year 2013 vs year 2015 PeMS data, it was determined that volumes in the project study area have remained essentially constant (+/- 1%) between year 2013 and year 2015 conditions. Therefore, for the purposes of this study, existing traffic volumes included in the Heavenly Mountain Resort EIR were regarded as the current year 2015 (Existing) traffic volumes. The Existing (year 2015) annual average and summer peak hour traffic volumes are presented in Appendix Figure 1. Prior traffic, air quality, and noise studies have been prepared using year 2012 volumes as existing conditions. Based on the above recent traffic trends and analysis of year 2012 vs year 2015 PeMS data, it was determined that volumes in the project study area have remained essentially constant (+/-1%) between year 2012 and year 2015 conditions. Therefore any existing conditions analysis done previously using year 2012 volumes may still be considered representative of current year 2015 existing conditions. EXISTING CONDITIONS TRAFFIC OPERATIONS Intersection traffic operations were quantified for the existing study area facilities under Existing traffic volumes (shown in Appendix Figure 1), and are presented in this section. Note that for traffic operational analysis purposes, is considered an east-west route and all intersecting cross-streets are regarded as north-south streets. INTERSECTION OPERATIONS Table 6 summarizes Existing study intersection traffic operations under Existing traffic volumes (shown in Appendix Figure 1) and current intersection geometrics and control (shown in Appendix Figure 2). WR# February 2016 Page 16
18 South Shore Community Revitalization Project # Intersection Table 6 Existing Conditions Intersection Traffic Operations Control Type Annual Average Peak Hour Wrnt Met? 3 Summer Peak Hour 1 Park Ave / TWSC A No 10.3 B No 2 / AWSC A No 8.5 A No 3 / Pioneer Trail Signal B D - 4 / Park Ave / Signal 15.6 B C - 5 / Friday Ave Signal 5.0 A A - 6 / Signal 8.1 A B - 7 / Signal 14.8 B B - 8 / AWSC 10.5 B No 12.6 B No 9 / Harrah s Rd TWSC 14.3 B No 17.1 C No Notes: 1. Average control delays (in seconds/vehicle ) are indicated for signal-controlled and All way stop control (AWSC) intersections. 2. "Worst case delays are indicated for Two way stop controlled (TWSC) intersections. 3. Wrnt = MUTCD based Peak-hour-Volume Signal Warrant #3. As shown in Table 6, all study intersections are operating at annual average and summer peak hour D or better under Existing traffic volumes. MUTCD based traffic signal peak hour volume warrant 3 is not currently met at any of the unsignalized study intersections. ROADWAY OPERATIONS Table 7 shows peak hour arterial/highway directional segment operations under Existing volumes. Arterial Segment (b/w Pioneer Trail and.) (thru Pioneer Trail and.) Table 7 Existing Conditions Arterial Segment Traffic Operations Arterial Class Direction Annual Average Peak Hour Summer Peak Hour Speed Speed III EB 22.2 C 19.1 C III WB 21.6 C 20.5 C Notes: 1. Speed = Average Travel Speed in miles per hour, EB = Eastbound, WB = Westbound, = Level of Service 2. With a free flow speed of approx.35 mph for, the study roadway segments are regarded as a HCM-2010 Class III Arterial. As shown in Table 7, the study arterial segment operations (progression) are currently in the C or better under both annual average and summer peak hour conditions. PROJECT DESCRIPTION Purpose and Need The purpose of this project is to make improvements to the corridor consistent with the Loop Road System concept; reduce congestion; improve vehicle, pedestrian, and bicycle safety; advance multimodal transportation opportunities; improve the environmental quality of the area; enhance visitor and community experience; and promote the economic vitality of the area. The project will fulfill the following specific needs: A. Article V(2) of the Tahoe Regional Planning Compact (Public Law ), 1980 (the Compact), requires a transportation plan for the integrated development of a regional system of transportation within the Tahoe Region. The Compact requires the transportation plan to include consideration of the completion of the Loop Road System in the States of California and Nevada. Improvements are required to the corridor to meet the intent of the Loop Road System concept. Wrnt Met? WR# February 2016 Page 17
19 South Shore Community Revitalization Project B. Ongoing and proposed resort redevelopment in the project area has increased pedestrian traffic, creating a need for improved pedestrian safety, mobility, multi-modal transportation options. Improvements to pedestrian facilities, bicycle lanes, and mass transit are needed to connect the outlying residential and retail-commercial uses with employment and entertainment facilities, including hotels and gaming interests. Currently, there are no bike lanes on through the project area, and sidewalks are either not large enough to meet the increased demand, or do not exist. These issues impact the visitor and community experience within the area. C. Environmental improvements are needed in the area to help achieve the Tahoe Regional Planning Agency s (TRPA s) environmental thresholds, including water quality and air quality. Improvements to stormwater runoff collection and treatment facilities are needed to meet TRPA and Lahontan Regional Water Quality Control Board regulations and requirements. Reduction of vehicle congestion and reducing the number of vehicles on the roadway through enhanced pedestrian and multi-modal opportunities is needed to provide for improved air quality. Landscape improvements are needed to enhance the scenic resource element of the project area to facilitate compliance with TRPA s Scenic Threshold and to enhance the community and tourism experience. D. Project area intersections and roadway segments are operating marginally acceptable during a typical Summer PM Peak Hour. However, higher traffic during holidays, special events, and certain summer and winter peak periods results in long vehicle spillback to upstream intersections, long delays throughout the Stateline area and undesirable traffic operations. These undesirable traffic operations along cause traffic to use other routes to travel through the Stateline area, resulting in unwelcome cut through traffic on local residential neighborhood streets. The cut-through vehicles cause congestion in residential neighborhoods and have been observed to travel at high speeds, endangering local residents. E. Create opportunity for redevelopment and revitalization of the project area. Alternatives There are currently five alternatives (the No-Build alternative and four build alternatives) under consideration. The proposed alternatives are intended to improve transportation conditions for all modes of transportation - vehicles, pedestrians, bikes, and transit - along through the casino core by either rerouting the majority of vehicular traffic to the south, leaving the current alignment of as a more pedestrian friendly complete street, or by rerouting pedestrians over the existing alignment of via a pedestrian bridge, reducing conflicts. If no improvements are made to the existing through the casino core, it is projected that the centrally located / Stateline Avenue intersection would operate at F with high delays and queues by Year A discussion of Project Alternatives is provided as follows: Alternative A (No-Build): The No-Build scenario entails no circulation/capacity/control improvements over existing facilities within the study area. The analysis of the No-Build condition constitutes the future base upon which the other project alternatives are evaluated. Alternative A (No-Build) is illustrated in Appendix Exhibit 1. Study area intersection lane geometrics and control under Alternative A are shown in Appendix Figure 2. Alternative B (Triangle Alternative): The Triangle Alternative, or Proposed Action, would construct a new alignment for to the south of existing from just west of the Pioneer Trail intersection in California to Lake Parkway in Nevada. The new alignment would begin at a new Pioneer Trail intersection located to the west of the existing intersection, and would proceed south along existing Moss Road. It would then turn east onto Montreal Road, passing to the south of the WR# February 2016 Page 18
20 South Shore Community Revitalization Project Village Center shopping complex, and continuing along the existing Montreal Road and Lake Parkway alignment before ending at a new two-lane roundabout at the existing /Lake Parkway intersection. The new alignment would have four foot travel lanes, 5-foot shoulders, and turn pockets at major intersections and driveways. New signalized intersections would be located at and Harrah s Road. The existing segment of between Pioneer Trail and Lake Parkway would be relinquished to the City of South Lake Tahoe in California, and Douglas County in Nevada. Between Park Avenue and Lake Parkway, the existing would be reduced to one lane in each direction, with landscaped medians and left-turn pockets at major intersections and driveways. Between Pioneer Trail and Park Avenue, there are two options under consideration. The first option would leave this segment of existing as a five-lane roadway. The second option would reduce the segment to a three-lane roadway by altering the / Pioneer Trail and / Park Avenue intersections. Possible alterations include reducing Old eastbound / westbound approaches to the intersections in question to a single approach lane with right and left turn pockets as necessary, and reducing the dual left-turn lanes bringing traffic onto the segment from northbound to a single left-turn lane. The two receiving lanes on the north/east leg (old ) of the / Pioneer Trail intersection would be dropped several hundred feet to the east of the intersection. Bike lanes and sidewalks would be added and/or upgraded throughout the project area. A pedestrian bridge would be constructed over the new alignment near the California/Nevada State Line connecting the Van Sickle Bi-State Park to the Stateline area. As an option, the proposed two-lane roundabout at the /Lake Parkway intersection would instead remain as a signalized intersection and be upgraded for the modified lane configuration. Under this alternative, existing transit routes and stops would remain unchanged and in their approximate locations. Alternative B (Triangle) is illustrated in Appendix Exhibit 2. Study area intersection lane geometrics and control under Alternative B are shown in Appendix Figure 3A (with a five-lane Old cross section between Pioneer Trail and Park Avenue) and Appendix Figure 3B (with a three-lane Old cross section between Pioneer Trail and Park Avenue). Alternative C (Triangle One-Way Alternative): The Triangle One-Way Alternative would split eastbound and westbound directions of from the Pioneer Trail intersection in California to Lake Parkway in Nevada. Eastbound would remain on existing, while westbound would be realigned onto a new alignment. Beginning at the Lake Parkway intersection, westbound would proceed south along the existing Lake Parkway alignment and continue onto Montreal Road on a one-way, two-lane roadway, with traffic only allowed in the westbound direction. Westbound would continue to the south of the Village Center shopping complex before turning west along existing Moss Road and rejoining eastbound at a new Pioneer Trail intersection. Between Park Avenue and Lake Parkway, existing would be reduced to a oneway, two-lane roadway, with traffic only allowed in the eastbound direction. This configuration was chosen in order to route the larger eastbound tourist traffic volume through the main casino/business core in order to promote the economic vitality of the South Lake Tahoe / Stateline area. Both eastbound and westbound would have foot travel lanes, 5-foot right shoulders, 4-foot left shoulders, turn pockets at major intersections and driveways, and would add and/or upgrade bike lanes and sidewalks. New signalized intersections would be located on westbound at Heavenly Village Way and Harrah s Road. A pedestrian bridge would be constructed over westbound near the California/Nevada State Line connecting the Van Sickle Bi-State Park to the Stateline area. Under this alternative, existing transit routes and stops would remain unchanged and in their approximate locations. Alternative C (Triangle One-Way) is illustrated in Appendix Exhibit 3. Study area intersection lane geometrics and control under Alternative C are shown in Appendix Figure 4. WR# February 2016 Page 19
21 South Shore Community Revitalization Project Alternative D (PSR Alternative): This alternative is based on the project described in the 12/14/2012 technical memo as Alternative C (Modified) and Alternative D (Modified). The PSR Alternative would construct a new alignment for to the south of existing from the Pioneer Trail intersection in California to Lake Parkway in Nevada. The new alignment would begin at a reconstructed Pioneer Trail intersection, and proceed east between existing Echo Road and Fern Road. It would then turn north onto Montreal Road, passing to the south of the Village Center shopping complex, and continuing along the existing Montreal Road and Lake Parkway alignment before ending at a new two-lane roundabout at the existing /Lake Parkway intersection. The new alignment would have four foot travel lanes, 5-foot shoulders, and turn pockets at major intersections and driveways. New signalized intersections would be located at Heavenly Village Way and Harrah s Road. The existing segment of between Pioneer Trail and Lake Parkway would be relinquished to the City of South Lake Tahoe in California, and Douglas County in Nevada. Between Park Avenue and Lake Parkway, the existing would be reduced to one lane in each direction, with landscaped medians and left-turn pockets at major intersections and driveways. Bike lanes and sidewalks would be added and/or upgraded throughout the project area. A pedestrian bridge would be constructed over the new alignment near the California/Nevada State Line connecting the Van Sickle Bi-State Park to the Stateline area. As an option, the proposed two-lane roundabout at the /Lake Parkway intersection would instead remain as a signalized intersection and be upgraded for the modified lane configuration. Under this alternative, existing transit routes and stops would remain unchanged and in their approximate locations. Alternative D (PSR) is illustrated in Appendix Exhibit 4. Study area intersection lane geometrics and control under Alternative D are shown in Appendix Figure 5. Alternative E (Skywalk Alternative): The Skywalk Alternative would construct a concrete bridge over the entire width and length of existing between nue and the eastern end of the Montbleu Resort that would serve pedestrians as a skywalk walkway along the casino corridor. The skywalk would be served by escalators at both ends and elevators located throughout. The existing at-grade pedestrian scramble located between the Hard Rock Hotel & Casino and Montbleu Resort would be removed under this alternative and replaced with sidewalk barriers similar to that in front of Harrah s Hotel and Casino and Harvey s Hotel and Casino. The existing at-grade pedestrian crosswalks at the / nue intersection would be removed as well. Otherwise, the roadway configuration under Alternative E (Skywalk) would be the same as that of Alternative A (No-Build). Under this alternative, existing transit routes and stops would remain unchanged and in their approximate locations. Alternative E (Skywalk) is illustrated in Appendix Exhibit 5. Study area intersection lane geometrics and control under Alternative E are shown in Appendix Figure 6. Additional Options Restripe Lake Parkway (Near Hard Rock Casino) to 4 Lanes: An option for this project has been considered in the past that would restripe the segment of Lake Parkway between and the Hard Rock Casino Driveway to four lanes. This option would eliminate the existing two-way left-turn median and reduce the shoulders (eliminating the existing bicycle lanes) to accommodate four lanes. This option was proposed specifically to increase the capacity of Lake Parkway to be able to handle large volumes of special event traffic that would be generated a few times a year by a proposed Live Theater at the Hard Rock Casino site and an expanded outdoor concert venue at Harvey s. This option is only intended to improve traffic operations during special events, and would have no significant benefit to regular annual average or summer peak hour traffic operations. An alternative option has been proposed in the past where event traffic could be handled by converting (using cones) the existing two-way left-turn median into an additional westbound (inbound) lane before special events as people are arriving, and then converting the existing two-way WR# February 2016 Page 20
22 South Shore Community Revitalization Project left-turn median into an additional eastbound (outbound) lane after special events as people are leaving. This alternative option could handle the event traffic without the need for any restriping. Cycle Track: The Cycle Track option would construct a Class IV, 2-way bike path along the northwestern (westbound) side of the old alignment of under Alternative B. Since there is already a high volume of pedestrians along, this proposed bike path would have little to no additional effect on operations and therefore it was assumed that the lower than typical saturation flow rates assumed for this project would account for the effects of the proposed cycle track. Existing driveways along the project segment of westbound may experience a slight increase in delays due to construction of the Cycle Track option FUTURE-YEAR TRAFFIC FORECASTS YEAR 2020 TRAFFIC FORECASTS Future Year 2020 project opening day traffic forecasts were calculated by estimating trips that would be generated by local projects that are expected to be complete by 2020 and distributing/ adding those trips onto the Year 2015 existing annual average and summer peak counts. A list of approved projects that are currently under construction or scheduled to begin construction in the near future was assembled based on discussions with local business owners and TRPA staff, knowledge of the study area, and projects coded into the TRPA travel demand model. The following near-term development projects were assumed to be constructed under Year 2020 conditions: Edgewood Lodge Development Proposed resort development on the Edgewood Tahoe Golf Course located north of nue between Lake Tahoe and Pine Boulevard / Lake Parkway. The proposed resort would access Lake Parkway via the existing Golf Course Entrance Road between nue and. The proposed resort would include approximately 154 hotel rooms and 40 fractional/timeshare residences, as well as a health spa, restaurant, and conference center. Per current project schedule and information obtained from TRPA, it is estimated that the proposed resort will likely complete construction and be operational by Year Zalanta Resort at the Village Proposed development consisting of 30 recreational condominiums located on the northeast corner of the existing / Friday Avenue intersection (assuming is the east-west direction). It was assumed the proposed development would access existing roadways via a driveway connecting to Friday Avenue. Per current project schedule and information obtained from TRPA, it is estimated that the proposed development will likely complete construction and be operational by Year Beach Club Proposed redevelopment of the existing mobile home park located near Arthur Drive / Kahle Drive just north of the Edgewood Tahoe Golf Course in Stateline, Nevada. The proposed new development would consist of approximately 143 single family detached homes as well as a recreational beach, swim club, and pier. The proposed development would access via Kahle Drive. Per current project schedule and information obtained from TRPA, it is estimated that the proposed development will likely complete construction and be operational by Year Sierra Colina Village Approved residential development project that would consist of 42 townhouse units in 21 duplex buildings and eight (8) single family detached homes. The proposed project would be located off of Lake Village Drive east of and north of Burke Creek, and would gain access to via Lake Village Drive. Per current project schedule and information obtained from TRPA, it is estimated that the proposed resort will likely complete construction and be operational by Year WR# February 2016 Page 21
23 South Shore Community Revitalization Project YEAR 2040 TRAFFIC FORECASTS The evaluation of traffic operations over a 20-year planning/design horizon is typically necessary for major transportation improvement projects. With the proposed project improvements anticipated to be complete by Year 2020, Year 2040 is regarded as the long-term planning horizon and design year. Future Year 2040 design year traffic forecasts were calculated by estimating trips that would be generated by local projects that are expected to be complete between years 2020 and 2040 and distributing/adding those trips onto the Year 2020 project opening day forecasts. Additionally, traffic on in the Stateline area is projected to grow at a rate of up to approximately half a percent per year based on projections from the Caltrans District 3 Transportation Concept Report and Corridor System Management Plan (June, 2014) and discussions with TRPA staff regarding TRPA Travel Demand Model forecasts. Additional growth in through traffic was assumed on top of the local growth as necessary to achieve an overall growth rate of approximately half a percent per year on in the project study area. A list of proposed projects likely to be complete by Year 2040 was assembled based on discussions with local business owners and TRPA staff, knowledge of the study area, and projects coded into the TRPA travel demand model. Above and beyond recently-approved development projects considered built out under 2020 conditions, the following long-term projects are considered built out under Year 2040 conditions: Gondola Vista Proposed residential development that would consist of 22 townhouse units in 10 duplex buildings. The proposed development would be located on the mountain side of Lake Parkway east across from the Forest Suites Resort. Per current project schedule and information obtained from TRPA, it is estimated that the proposed development will likely complete construction and be operational by Year Chateau/Zalanta Full Buildout Proposed expansion of the Chateau/Zalanta developments that are currently partially built out on the northwest corner of and nue (assuming is the east-west direction). Based on discussion with business owners and TRPA, full build out of the project is assumed to consist of up to an additional 287 hotel rooms, 20,000 square feet of retail, and 60 recreational condominiums. Per current discussions with business owners and knowledge of the area, it is estimated that the proposed development may complete construction and be operational by Year Proposed short-term (2020) and long-term (2040) project trips were estimated using trip generation rates from the Institute of Transportation Engineers (ITE) Trip Generation Manual, 9 th Edition. A detailed summary of all trip generation rates, reduction factors, and total estimated trips for the proposed local projects is shown in Appendix Tables 1A and 1B. Year 2020 and 2040 No-Build traffic volume forecasts are included in Appendix Figures 6 and 11, respectively. Table 8 shows a summary of all project years analyzed in this memorandum. Traffic Volume Scenario PSR Phase (as Approved in 2010) Table 8 - Traffic Volume Years PR Phase (Ongoing) Notes Existing Existing volumes from Heavenly Mountain Resort EIR. Project Opening Day Existing volumes plus short-term project trips. Project Design Year Project Opening Day forecasts plus long-term project trips and growth in through traffic on. WR# February 2016 Page 22
24 South Shore Community Revitalization Project FUTURE YEAR TRANSPORTATION NETWORK IMPROVEMENTS Only one future year transportation network improvement, not related to the proposed project, is assumed to be constructed under all future year scenarios. It is assumed that the existing crosswalks at the / nue intersection would be removed and a pedestrian scramble would be constructed at the intersection in their place. The pedestrian scramble at the / nue intersection is assumed complete by Year WITH PROJECT (ALTERNATIVES B, C, D, AND E) FORECASTS Existing (Year 2015), Year 2020, and Year 2040 No-Build traffic volumes were redistributed/rerouted as necessary to calculate with project traffic forecasts for proposed project Alternatives B (Triangle), C (Triangle One-Way), and D (PSR). Alternatives B and D have the same volume forecasts as the only major difference between the two is the location of the realigned / Pioneer Trail intersection (the realigned Pioneer Trail intersection would be located further west of the existing intersection under Alternative B due to right of way considerations). Alternative E (Skywalk) utilizes No-Build forecasts as it only proposes pedestrian improvements, which have no significant impact on vehicular volume forecasts. Existing (Year 2015) with project volume forecasts are illustrated in Appendix Figures Year 2020 with project volume forecasts are illustrated in Appendix Figures Year 2040 with project volume forecasts are illustrated in Appendix Figures YEAR 2020 NO-BUILD TRAFFIC OPERATIONS INTERSECTION OPERATIONS Year 2020 No-Build intersection traffic operations were quantified under Year 2020 traffic volumes (shown in Appendix Figure 11) and existing study area transportation facilities, plus construction of the nue pedestrian scramble, and are summarized in Table 9. # Intersection Table 9 - Year 2020 No-Build Intersection Traffic Operations Control Type Annual Average Peak Hour Wrnt Met? 3 Summer Peak Hour 1 Park Ave / TWSC B No 10.6 B No 2 / AWSC A No 8.7 A No 3 / Pioneer Trail Signal B D - 4 / Park Ave / Signal 13.3 B D - 5 / Friday Ave Signal 5.1 A A - 6 / Signal 27.9 C E* - 7 / Signal 18.1 B C - 8 / AWSC 10.7 B No 13.0 B No 9 / Harrah s Rd TWSC 14.5 B No 17.5 C No Notes: 1. Average control delays (in seconds/vehicle ) are indicated for signal-controlled and All way stop control (AWSC) intersections. 2. "Worst case delays are indicated for Two way stop controlled (TWSC) intersections. 3. Wrnt = MUTCD based Peak-hour-Volume Signal Warrant #3. * Projected to operate at E for 4 hours or less per day based on analysis of 5 th highest hour, which is considered acceptable per TRPA standards. Wrnt Met? As shown in Table 9, all study intersections are projected to operate at annual average and summer peak hour E for four hours or less per day or better under Year 2020 No-Build volumes and WR# February 2016 Page 23
25 South Shore Community Revitalization Project existing capacity/control configurations. MUTCD based traffic signal peak hour volume warrant 3 is not projected to be met at any of the unsignalized study intersections under Year 2020 No-Build conditions. ROADWAY OPERATIONS Table 10 shows peak hour arterial/highway directional segment operations under Year 2020 No-Build traffic volumes. Table 10 - Year 2020 No-Build Conditions Arterial Segment Traffic Operations Arterial Segment Arterial Annual Average Peak Hour Summer Peak Hour Direction Class Speed Speed (b/w Pioneer Trail and.) III EB 20.1 C 17.3 D (thru Pioneer Trail and.) III WB 20.2 C 13.3 E* Notes: 1. Speed = Average Travel Speed in miles per hour, EB = Eastbound, WB = Westbound, = Level of Service 2. With a free flow speed of approx.35 mph for, the study roadway segments are regarded as a HCM-2010 Class III Arterial. * Projected to operate at E for 4 hours or less per day based on analysis of 5 th highest hour, which is considered acceptable per TRPA standards. As shown in Table 10, all study arterial segments are projected to operate at annual average and summer peak hour peak hour E for four hours or less per day or better under Year 2020 No-Build volumes and existing capacity configurations. YEAR 2040 NO-BUILD TRAFFIC OPERATIONS INTERSECTION OPERATIONS Year 2040 No-Build intersection traffic operations were quantified under Year 2040 traffic volumes (shown in Appendix Figure 16) and existing study area transportation facilities, plus construction of the nue pedestrian scramble, and are summarized in Table 11. # Intersection Table 11 - "Year 2040 No Build Intersection Traffic Operations Control Type Annual Average Peak Hour Wrnt Met? 3 Summer Peak Hour 1 Park Ave / TWSC B No 10.6 B No 2 / AWSC A No 8.7 A No 3 / Pioneer Trail Signal C E - 4 / Park Ave / Signal 15.8 B D - 5 / Friday Ave Signal 6.6 A B - 6 / Signal 35.9 D F - 7 / Signal 19.9 B C - 8 / AWSC 11.5 B No 15.3 C No 9 / Harrah s Rd TWSC 15.1 C No 18.8 C No Notes: 1. Average control delays (in seconds/vehicle ) are indicated for signal-controlled and All way stop control (AWSC) intersections. 2. "Worst case delays are indicated for Two way stop controlled (TWSC) intersections. 3. Wrnt = MUTCD based Peak-hour-Volume Signal Warrant #3. As shown in Table 11, the intersection with Pioneer Trail is projected to operate at summer peak hour E (and projected to operate at E for more than four hours per day) and the intersection with nue is projected to operate at summer peak hour F Wrnt Met? WR# February 2016 Page 24
26 South Shore Community Revitalization Project under Year 2040 No-Build volumes and existing capacity/control configurations. The remaining study intersections are projected to operate at annual average and summer peak hour D or better under Year 2020 No-Build volumes and existing capacity/control configurations. MUTCD based traffic signal peak hour volume warrant 3 is not projected to be met at any of the unsignalized study intersections under Year 2040 No-Build conditions. ROADWAY OPERATIONS Table 12 shows peak hour arterial/highway directional segment operations under Year 2040 No-Build traffic volumes. Table 12 - Year 2040 No-Build Conditions Arterial Segment Traffic Operations Arterial Segment Arterial Annual Average Peak Hour Summer Peak Hour Direction Class Speed Speed (b/w Pioneer Trail and.) III EB 19.3 C 13.8 E* (thru Pioneer Trail and.) III WB 18.7 C 10.5 E Notes: 1. Speed = Average Travel Speed in miles per hour, EB = Eastbound, WB = Westbound, = Level of Service 2. With a free flow speed of approx.35 mph for, the study roadway segments are regarded as a HCM-2010 Class III Arterial. * Projected to operate at E for 4 hours or less per day based on analysis of 5 th highest hour, which is considered acceptable per TRPA standards. As shown in Table 12, the Westbound arterial segment between Lake Parkway and Pioneer Trail is projected to operate at summer peak hour E (and projected to operate at E for more than four hours per day) under Year 2040 No-Build volumes and existing capacity configurations. All remaining study arterial segments are projected to operate at annual average and summer peak hour peak hour E for four hours or less per day or better under Year 2020 No-Build volumes and existing capacity configurations. WR# February 2016 Page 25
27 South Shore Community Revitalization Project EXISTING PLUS PROJECT TRAFFIC OPERATIONS INTERSECTION OPERATIONS Table 13 summarizes Existing plus Project conditions intersection traffic operations under all project alternatives. Existing plus Project conditions should be regarded as if a proposed alternative had been constructed under Year 2015 conditions. Existing plus Project traffic volumes for Alternatives B, C, D and E are illustrated in Appendix Figures 7, 8, 9 and 10, respectively. As shown in Table 13: Alternative B (Triangle): All study intersections are projected to operate at annual average and summer peak hour C or better under Existing plus Project conditions. Alternative C (Triangle One-Way): All study intersections are projected to operate at acceptable Existing plus Project peak hour operations except for the intersections with Pioneer Trail and Lake Parkway for the summer peak hour. The New / Pioneer Trail / Old intersection is projected to operate at summer peak hour F under Existing plus Project conditions. In order to improve at the New / Pioneer Trail / Old intersection to an acceptable ( E for four hours or less per day or better) level, a third dedicated left turn lane/pocket would need to be constructed on the eastbound approach, and a third receiving lane would need to be constructed on the Old leg of the intersection. However, these improvements are not feasible as they would necessitate significant additional right of way to be acquired, and have significant impacts to TRPA thresholds, including water quality, soil conservation, vegetation, and scenic. The proposed signal and roundabout-controlled New / Lake Parkway / Old intersections are projected to operate at summer peak hour E/F (and are projected to operate at E for more than four hours per day) under Existing plus Project conditions. In order to improve at the proposed signalized New / Lake Parkway / Old intersection to an acceptable ( E for four hours or less per day or better) level, a third dedicated left turn lane/pocket would need to be constructed on the westbound approach, and a third receiving lane would need to be constructed on the One-Way Westbound leg of the intersection. However, these improvements are not feasible as they would necessitate significant additional right of way to be acquired, and have significant impacts to TRPA thresholds, including water quality, soil conservation, vegetation, and scenic. A SIDRA-software based roundabout concept-level analysis for the New / Lake Parkway / Old location under Alternative C has determined that a roundabout is not a feasible solution at this intersection due to the high volume of circulating left turns that would be made from westbound onto the new Loop. Adding additional lanes to the roundabout would have no significant effect on the because the high volume of westbound left turns already in the roundabout would prevent eastbound through traffic from entering the roundabout without substantial delay. One possible mitigation for Alternative C is to reverse the directionality of the proposed one-way segments of (i.e. the old alignment of would carry westbound traffic and the new southern loop alignment of would carry eastbound traffic). This proposed reversal of directionality would reroute/eliminate the significant eastbound left-turn traffic entering the casino core that would be conflicting with the one-way westbound New through traffic at the / Pioneer Trail intersection. WR# February 2016 Page 26
28 South Shore Community Revitalization Project # Intersection Park Ave / Pine 1 Blvd / 2 New / 3 Pioneer Trail / Old 7 Old / Park 4 Ave / Heavenly Village Way 8 Old / Friday 5 Ave Old / New / Lake Pkwy / Old 4 New / Heavenly Village Way New / Harrah's Rd Control Type Alternative A (No Build) Table 13 - Existing plus Project Intersection Traffic Operations Alternative B (Triangle) Alternative C (Triangle One- Way) Alternative D (PSR) Alternative E (Skywalk) Annual Avg Summer Pk Annual Avg Summer Pk Annual Avg Summer Pk Annual Avg Summer Pk Annual Avg Summer Pk TWSC A 10.3 B 9.4 A 9.7 A 9.4 A 10.4 B 9.4 A 9.7 A 9.9 A 10.3 B AWSC A 8.5 A 8.1 A 8.5 A 8.2 A 8.6 A 8.1 A 8.5 A 8.1 A 8.5 A Signal A 18.7 B 37.5 D 19.5 B 23.2 C 52.6 D 88.4 F 19.3 B 23.1 C 17.2 B 37.0 D Signal B B 22.7 C Signal A 15.6 B 22.8 C 18.3 B 19.1 B 12.4 B 16.1 B 17.6 B 20.8 C 15.0 B 28.3 C Signal B C 27.1 C Signal A 7.5 A 6.2 A 7.8 A 2.7 A 13.8 B 6.1 A 7.7 A 3.8 A 5.0 A Signal 8.1 A 11.1 B 8.7 A 10.7 B 3.9 A 19.9 B 8.6 A 10.6 B 7.3 A 11.2 B Signal 14.8 B 19.9 B 15.8 B 20.0 B 37.7 D 69.4 E 15.9 B 19.2 B 19.3 B 25.0 C Rndabt 5, B 12.6 B Signal (AWSC 9 ) Signal (TWSC 10 ) 7.3 (12.9) A (B) 7.7 (14.9) A (B) 15.3 (27.8) C (D) 74.3 (151.8) F (F) 7.3 (12.9) A (B) 7.7 (14.9) A (B) B 17.1 C 8.6 A 10.3 B 5.3 A 5.8 A 8.8 A 10.6 B 10.5 B 12.6 B 5.0 A 7.5 A 4.8 A 4.9 A 1.2 A 3.7 A 4.7 A 4.6 A 14.3 B 17.1 C Notes: 1. "Average" control delays (in seconds/vehicle ) are indicated for signal-controlled and All way stop control (AWSC) intersections. 2. "Worst-case" delays are indicated for Two-way-stop (TWSC) controlled intersections. 3. Wrnt = MUTCD based Peak-hour-Volume Signal Warrant #3. 4. / intersection is controlled by a signal under "Skywalk Alternative" and by either a roundabout or a signal under "Triangle Alternative", "Triangle One-Way Alternative", and "PSR Alternative". 5. A layout drawing of the roundabout option for the / Lake Parkway intersection is provided in Appendix Exhibit "Average" and "Worst-case" control delays are indicated for roundabout intersection in avg (w.c.) format. 7. Signal A assumes a 5-lane cross-section of Old b/w Pioneer Trail and Park Avenue. Pioneer Trail intersection SB approach: 1 through lane, 1 free-right lane, 1 left turn pocket. Signal B assumes a 3-lane cross-section of Old b/w Pioneer Trail and Park Avenue. Pioneer Trail intersection SB approach: 1 through lane, 1 free-right turn pocket, 1 left turn pocket. 8. Signal A assumes a 5-lane cross-section of Old b/w Pioneer Trail and Park Avenue. Park Avenue intersection EB approach: 1 through lane, 1 right turn trap lane, 1 left turn pocket. NB approach: dual left turn pockets. Signal B assumes a 3-lane cross-section of Old b/w Pioneer Trail and Park Avenue. Park Avenue intersection EB approach: 1 through-right lane, 1 left turn pocket. NB approach: single left turn pocket. 9. Control Type for this intersection is AWSC under "Alternative A (No-Build)" and "Alternative E (Skywalk)" conditions. 10. Control Type for this intersection is TWSC under "Alternative A (No-Build)" and "Alternative E (Skywalk)" conditions. "-" Intersection does not exist under the specified alternative or otherwise "Not Applicable". WR# February 2016 Page 27
29 South Shore Community Revitalization Project Similarly, this proposed reversal of directionality would reroute/eliminate the significant westbound left-turn traffic entering the one-way westbound New that would be conflicting with the one-way eastbound through traffic at the / Lake Parkway intersection. Rerouting these left turns would lead to a significant improvement in delays and throughout the project study area, particularly at the New / Pioneer Trail / Old and New / Lake Parkway / Old intersections. Alternative D (PSR): All study intersections are projected to operate at annual average and summer peak hour C or better under Existing plus Project conditions. Alternative E (Skywalk): All study intersections are projected to operate at annual average and summer peak hour D or better under Existing plus Project conditions. MUTCD based traffic signal peak hour volume warrant 3 is not projected to be met at any of the unsignalized study intersections under all Existing plus Project alternatives. ROADWAY OPERATIONS Table 14 shows the peak hour arterial/highway directional segment operations under Existing plus Project conditions. As shown in Table 14: Alternative B (Triangle): All study arterial segments are projected to operate at annual average and summer peak hour D or better under Existing plus Project conditions, including the Old US 50 arterial segment with a three-lane cross-section between Pioneer Trail and Lake Parkway. Alternative C (Triangle One-Way): Westbound Old between Pioneer Trail and Park Avenue is projected to operate at annual average and summer peak hour E (and is projected to operate at E for more than four hours per day) under Existing plus Project conditions. All other study arterial segments are projected to operate at acceptable annual average and summer peak hour D or better under Existing plus Project conditions. Alternative D (PSR): All study arterial segments are projected to operate at annual average and summer peak hour D or better under Existing plus Project conditions. Alternative E (Skywalk): All study arterial segments are projected to operate at annual average and summer peak hour C or better under Existing plus Project conditions. WR# February 2015 Page 28
30 South Shore Community Revitalization Project Arterial Segment Arterial Class Dir Table 14 - Existing plus Project Arterial Segment Traffic Operations Alternative A (No-Build) Annual Average Summer Peak Alternative B (Triangle) Annual Average Summer Peak Alternative C (Triangle One-Way) Annual Summer Average Peak Alternative D (PSR) Annual Average Summer Peak Alternative E (Skywalk) Annual Average Summer Peak Spd Spd Spd Spd Spd Spd Spd Spd Spd Spd New (b/w Pioneer Trail & ) II EB C 25.8 C C 24.7 C New (b/w Pioneer Trail & ) II WB B 31.7 B B 31.2 B Old (b/w Pioneer Trail &, w/ 5- lane segment b/w III EB 22.2 C 19.1 C 20.0 C 17.3 D C 17.6 D 22.7 C 19.8 C Pioneer Trail & Park Ave) Old (b/w Pioneer Trail &, w/ 5- lane segment b/w III WB 21.6 C 20.5 C 16.6 D 15.1 D D 14.0 D 23.5 C 20.7 C Pioneer Trail & Park Ave) Old (b/w Pioneer Trail &, w/ 3- lane segment b/w III EB C 18.4 C Pioneer Trail & Park Ave) Old (b/w Pioneer Trail &, w/ 3- lane segment b/w III WB D 14.6 D Pioneer Trail & Park Ave) Old (b/w Pioneer Trail & Park Ave) III EB B 21.3 C Old (b/w Pioneer Trail & Park Ave) III WB E 13.8 E One-Way EB (b/w Park Ave & ) III EB C 15.8 D One-Way WB (b/w Pioneer Trail & Lake II WB C 21.1 D Pkwy) Notes: Spd = Average Travel Speed in miles per hour, EB = Eastbound, WB = Westbound, = Level of Service The study roadway segments with a free flow speed of approx mph are regarded as HCM-2010 Class III Arterial. The study roadway segments with a free flow speed of approx. 40 mph are regarded as HCM-2010 Class II Arterial. "-" Roadway segment does not exist under the specified alternative or otherwise operations "Not Applicable". WR# February 2016 Page 29
31 South Shore Community Revitalization Project YEAR 2020 WITH PROJECT (OPENING DAY) TRAFFIC OPERATIONS INTERSECTION OPERATIONS Table 15 summarizes Year 2020 with Project conditions intersection traffic operations under all project alternatives. Year 2020 with Project conditions should be regarded as if a proposed alternative had been constructed under Year 2020 conditions. Year 2020 plus Project traffic volumes for Alternatives B, C, D and E are illustrated in Appendix Figures 12, 13, 14 and 15, respectively. As shown in Table 15: Alternative B (Triangle): All study intersections are projected to operate at annual average and summer peak hour C or better under Year 2020 with Project conditions. Alternative C (Triangle One-Way): All study intersections are projected to operate at acceptable Year 2020 with Project peak hour operations except for the intersections with Pioneer Trail and Lake Parkway for the summer peak hour. The New / Pioneer Trail / Old intersection is projected to operate at summer peak hour F under Year 2020 with Project conditions. In order to improve at the New / Pioneer Trail / Old intersection to an acceptable ( E for four hours or less per day or better) level, a third dedicated left turn lane/pocket would need to be constructed on the eastbound approach, and a third receiving lane would need to be constructed on the Old leg of the intersection. However, these improvements are not feasible as they would necessitate significant additional right of way be acquired, and have significant impacts to TRPA thresholds, including water quality, soil conservation, vegetation, and scenic. The proposed signal and roundabout-controlled New / Lake Parkway / Old intersections are projected to operate at summer peak hour F under Year 2020 with Project conditions. In order to improve at the proposed signalized New / Lake Parkway / Old intersection to an acceptable ( E for four hours or less per day or better) level, a third dedicated left turn lane/pocket would need to be constructed on the westbound approach, and a third receiving lane would need to be constructed on the One-Way Westbound leg of the intersection. However, these improvements are not feasible as they would necessitate significant additional right of way be acquired, and have significant impacts to TRPA thresholds, including water quality, soil conservation, vegetation, and scenic. A SIDRA-software based roundabout concept-level analysis for the New / Lake Parkway / Old location under Alternative C has determined that a roundabout is not a feasible solution at this intersection due to the high volume of circulating left turns that would be made from westbound onto the new Loop. Adding additional lanes to the roundabout would have no significant effect on the because the high volume of westbound left turns already in the roundabout that would prevent eastbound through traffic from entering the roundabout without substantial delay. One possible mitigation for Alternative C is to reverse the directionality of the proposed one-way segments of (i.e. the old alignment of would carry westbound traffic and the new southern loop alignment of would carry eastbound traffic). This proposed reversal of directionality would reroute/eliminate the significant eastbound left-turn traffic entering the casino core that would be conflicting with the one-way westbound New through traffic at the / Pioneer Trail intersection. WR# February 2016 Page 30
32 South Shore Community Revitalization Project # Intersection Park Ave / Pine 1 Blvd / 2 New / 3 Pioneer Trail / Old 7 Old / Park 4 Ave / Heavenly Village Way 8 Old / Friday 5 Ave Old / New / Lake Pkwy / Old 4 New / Heavenly Village Way New / Harrah's Rd Control Type Alternative A (No Build) Table 15 - Year 2020 with Project Intersection Traffic Operations Alternative B (Triangle) Alternative C (Triangle One- Way) Alternative D (PSR) Alternative E (Skywalk) Annual Avg Summer Pk Annual Avg Summer Pk Annual Avg Summer Pk Annual Avg Summer Pk Annual Avg Summer Pk TWSC B 10.6 B 9.5 A 9.8 A 9.6 A 10.0 B 9.5 A 9.8 A 10.1 B 10.6 B AWSC A 8.7 A 8.3 A 8.7 A 8.5 A 8.9 A 8.3 A 8.7 A 8.3 A 8.7 A Signal A 18.9 B 46.1 D 19.9 B 24.5 C 60.1 E* 99.2 F 19.8 B 22.4 C 20.0 C 46.1 D Signal B C 23.6 C Signal A 13.3 B 39.4 D 17.4 B 21.2 C 13.6 B 16.7 B 18.1 B 22.2 C 17.2 B 31.9 C Signal B C 27.7 C Signal A 9.4 A 9.1 A 10.0 A 3.9 A 16.3 B 7.7 A 9.9 A 5.0 A 6.9 A Signal 27.9 C 56.9 E* 16.1 B 22.4 C 7.0 A 54.5 D 16.7 B 20.5 C 8.6 A 11.2 B Signal 18.1 B 22.7 C 16.3 B 20.0 B 40.5 D 82.4 F 16.1 B 19.8 B 16.3 B 25.7 C Rndabt 5, B 13.0 B Signal (AWSC 9 ) Signal (TWSC 10 ) 7.4 (13.9) A (B) 7.9 (15.5) A (C) 21.5 (41.7) C (219.6) F (F) 7.4 (13.9) A (B) 7.9 (15.5) A (C) B 17.5 C 8.9 A 11.1 B 4.4 A 5.1 A 9.3 A 10.3 B 10.7 B 13.0 B 5.1 A 9.4 A 4.3 A 4.8 A 1.6 A 4.9 A 4.4 A 4.9 A 14.5 B 17.5 C Notes: 1. "Average" control delays (in seconds/vehicle ) are indicated for signal-controlled and All way stop control (AWSC) intersections. 2. "Worst-case" delays are indicated for Two-way-stop (TWSC) controlled intersections. 3. Wrnt = MUTCD based Peak-hour-Volume Signal Warrant #3. 4. / intersection is controlled by a signal under "Skywalk Alternative" and by either a roundabout or a signal under "Triangle Alternative", "Triangle One-Way Alternative", and "PSR Alternative". 5. A layout drawing of the roundabout option for the / Lake Parkway intersection is provided in Appendix Exhibit "Average" and "Worst-case" control delays are indicated for roundabout intersection in avg (w.c.) format. 7. Signal A assumes a 5-lane cross-section of Old b/w Pioneer Trail and Park Avenue. Pioneer Trail intersection SB approach: 1 through lane, 1 free-right lane, 1 left turn pocket. Signal B assumes a 3-lane cross-section of Old b/w Pioneer Trail and Park Avenue. Pioneer Trail intersection SB approach: 1 through lane, 1 free-right turn pocket, 1 left turn pocket. 8. Signal A assumes a 5-lane cross-section of Old b/w Pioneer Trail and Park Avenue. Park Avenue intersection EB approach: 1 through lane, 1 right turn trap lane, 1 left turn pocket. NB approach: dual left turn pockets. Signal B assumes a 3-lane cross-section of Old b/w Pioneer Trail and Park Avenue. Park Avenue intersection EB approach: 1 through-right lane, 1 left turn pocket. NB approach: single left turn pocket. 9. Control Type for this intersection is AWSC under "Alternative A (No-Build)" and "Alternative E (Skywalk)" conditions. 10. Control Type for this intersection is TWSC under "Alternative A (No-Build)" and "Alternative E (Skywalk)" conditions. "-" Intersection does not exist under the specified alternative or otherwise "Not Applicable". * Projected to operate at E for 4 hours or less per day based on analysis of 5 th highest hour, which is considered acceptable per TRPA standards. WR# February 2016 Page 31
33 South Shore Community Revitalization Project Similarly, this proposed reversal of directionality would reroute/eliminate the significant westbound left-turn traffic entering the one-way westbound New that would be conflicting with the one-way eastbound through traffic at the / Lake Parkway intersection. Rerouting these left turns would lead to a significant improvement in delays and throughout the project study area, particularly at the New / Pioneer Trail / Old and New / Lake Parkway / Old intersections. Alternative D (PSR): All study intersections are projected to operate at annual average and summer peak hour C or better under Year 2020 with Project conditions. Alternative E (Skywalk): All study intersections are projected to operate at annual average and summer peak hour D or better under Year 2020 with Project conditions. MUTCD based traffic signal peak hour volume warrant 3 is not projected to be met at any of the unsignalized study intersections under all Year 2020 with Project alternatives. ROADWAY OPERATIONS Table 16 shows the peak hour arterial/highway directional segment operations under Year 2020 with Project conditions for all project alternatives. As shown in Table 16: Alternative B (Triangle): All study arterial segments are projected to operate at annual average and summer peak hour D or better under Year 2020 with Project conditions, including the Old arterial segment with a three-lane cross-section between Pioneer Trail and Lake Parkway. Alternative C (Triangle One-Way): Westbound Old between Pioneer Trail and Park Avenue are projected to operate at annual average and summer peak hour E (and is projected to operate at E for more than four hours per day) under Year 2020 with Project conditions. All other study arterial segments are projected to operate at acceptable annual average and summer peak hour E for four hours or less per day or better under Existing plus Project conditions. Alternative D (PSR): All study arterial segments are projected to operate at annual average and summer peak hour D or better under Year 2020 with Project conditions. Alternative E (Skywalk): All study arterial segments are projected to operate at annual average and summer peak hour C or better under Year 2020 with Project conditions. WR# February 2016 Page 32
34 South Shore Community Revitalization Project Arterial Segment Arterial Class Dir Table 16 - Year 2020 with Project Arterial Segment Traffic Operations Alternative A (No-Build) Annual Average Summer Peak Alternative B (Triangle) Annual Average Summer Peak Alternative C (Triangle One-Way) Annual Summer Average Peak Alternative D (PSR) Annual Average Summer Peak Alternative E (Skywalk) Annual Average Summer Peak Spd Spd Spd Spd Spd Spd Spd Spd Spd Spd New (b/w Pioneer Trail & ) II EB C 24.2 C C 24.2 C New (b/w Pioneer Trail & ) II WB B 31.8 B B 31.1 B Old (b/w Pioneer Trail &, w/ 5- lane segment b/w III EB 20.1 C 17.3 D 18.8 C 17.4 D C 15.7 D 23.2 C 19.5 C Pioneer Trail & Park Ave) Old (b/w Pioneer Trail &, w/ 5- lane segment b/w III WB 20.2 C 13.3 E* 16.7 D 14.0 D D 14.9 D 22.4 C 20.7 C Pioneer Trail & Park Ave) Old (b/w Pioneer Trail &, w/ 3- lane segment b/w III EB C 17.7 D Pioneer Trail & Park Ave) Old (b/w Pioneer Trail &, w/ 3- lane segment b/w III WB D 14.9 D Pioneer Trail & Park Ave) Old (b/w Pioneer Trail & Park Ave) III EB B 20.2 C Old (b/w Pioneer Trail & Park Ave) III WB E 13.1 E One-Way EB (b/w Park Ave & ) III EB C 12.9 E* One-Way WB (b/w Pioneer Trail & Lake II WB D 19.8 D Pkwy) Notes: Spd = Average Travel Speed in miles per hour, EB = Eastbound, WB = Westbound, = Level of Service The study roadway segments with a free flow speed of approx mph are regarded as HCM-2010 Class III Arterial. The study roadway segments with a free flow speed of approx. 40 mph are regarded as HCM-2010 Class II Arterial. "-" Roadway segment does not exist under the specified alternative or otherwise operations "Not Applicable". * Projected to operate at E for 4 hours or less per day based on analysis of 5 th highest hour, which is considered acceptable per TRPA standards. WR# February 2016 Page 33
35 South Shore Community Revitalization Project YEAR 2040 WITH PROJECT TRAFFIC OPERATIONS INTERSECTION OPERATIONS Table 17 summarizes Year 2040 with Project conditions intersection traffic operations under all project alternatives. Year 2040 with Project conditions should be regarded as if a proposed alternative had been constructed under Year 2040 conditions. Year 2040 with Project traffic volumes for Alternatives B, C, D and E are illustrated in Appendix Figures 17, 18, 19 and 20, respectively. As shown in Table 17: Alternative B (Triangle): All study intersections are projected to operate at annual average and summer peak hour C or better under Year 2040 with Project conditions. Alternative C (Triangle One-Way): All study intersections are projected to operate at acceptable Year 2040 with Project peak hour operations except for the intersections with Pioneer Trail, nue, and Lake Parkway. The New / Pioneer Trail / Old intersection is projected to operate at annual average and summer peak hour E/F (and projected to operate at E for more than four hours per day) under Year 2040 with Project conditions. In order to improve at the New / Pioneer Trail / Old intersection to an acceptable ( E for four hours or less per day or better) level, a third dedicated left turn lane/pocket would need to be constructed on the eastbound approach, and a third receiving lane would need to be constructed on the Old leg of the intersection. However, these improvements are not feasible as they would necessitate significant additional right of way be acquired, and have significant impacts to TRPA thresholds, including water quality, soil conservation, vegetation, and scenic. The Old / nue intersection is projected to operate at summer peak hour F under Year 2040 with Project conditions. A possible improvement for the Old / Stateline Avenue intersection, that is projected to result in acceptable operations of E for four hours or less per day or better, would be to construct an eastbound right turn pocket. The proposed signal and roundabout-controlled / Lake Parkway intersections are projected to operate at summer peak hour F under Year 2040 with Project conditions. For the annual average peak hour, the proposed roundabout at the / Lake Parkway intersection is projected to operate at F for the worst case movement. In order to improve at the proposed signalized New / Lake Parkway / Old intersection to an acceptable ( E for four hours or less per day or better) level, a third dedicated left turn lane/pocket would need to be constructed on the westbound approach, and a third receiving lane would need to be constructed on the One-Way Westbound leg of the intersection. However, these improvements are not feasible as they would necessitate significant additional right of way be acquired, and have significant impacts to TRPA thresholds, including water quality, soil conservation, vegetation, and scenic. A SIDRA-software based roundabout concept-level analysis for the / Lake Parkway location under Alternative C has determined that a roundabout is not a feasible solution at this intersection due to the high volume of circulating left turns that would be made from westbound onto the new Loop. Adding additional lanes to the roundabout would have no significant effect on the because the high volume of westbound left turns already in the roundabout that would prevent eastbound through traffic from entering the roundabout without substantial delay. WR# February 2016 Page 34
36 South Shore Community Revitalization Project # Intersection Park Ave / Pine 1 Blvd / 2 New / 3 Pioneer Trail / Old 7 Old / Park 4 Ave / Heavenly Village Way 8 Old / Friday 5 Ave Old / New / Lake Pkwy / Old 4 New / Heavenly Village Way New / Harrah's Rd Control Type Alternative A (No Build) Table 17 Year 2040 with Project Intersection Traffic Operations Alternative B (Triangle) Alternative C (Triangle One- Way) Alternative D (PSR) Alternative E (Skywalk) Annual Avg Summer Pk Annual Avg Summer Pk Annual Avg Summer Pk Annual Avg Summer Pk Annual Avg Summer Pk TWSC B 10.6 B 9.5 A 9.8 A 9.8 A 10.2 B 9.5 A 9.8 A 10.1 B 10.6 B AWSC A 8.7 A 8.3 A 8.7 A 8.6 A 9.2 A 8.3 A 8.7 A 8.3 A 8.7 A Signal A 23.7 C 64.5 E 21.6 C 25.2 C 70.3 E F 21.5 C 24.6 C 24.0 C 64.8 E* Signal B C 25.0 C Signal A 15.8 B 52.4 D 20.6 C 27.3 C 15.1 B 38.6 D 19.6 B 23.4 C 17.7 B 61.2 E* Signal B C 32.9 C Signal A 19.1 B 10.8 B 14.9 B 5.7 A 31.1 C 14.6 B 14.8 B 7.6 A 17.8 B Signal 35.9 D 90.6 F 18.7 B 20.6 C 13.3 B 81.6 F 19.4 B 22.9 C 10.7 B 12.9 B Signal 19.9 B 27.6 C 18.5 B 25.4 C 50.9 D F 23.7 C 26.6 C 22.2 C 30.1 C Rndabt 5, B 15.3 C Signal (AWSC 9 ) Signal (TWSC 10 ) 7.6 (14.6) A (B) 8.7 (17.2) A (C) 45.4 (93.1) E* (F) (340.1) F (F) 7.6 (14.6) A (B) 8.7 (17.2) A (C) C 18.8 C 10.7 B 12.5 B 2.1 A 7.6 A 11.9 B 11.2 B 11.5 B 15.3 C 6.6 A 19.1 B 4.4 A 4.9 A 9.8 A 6.5 A 4.1 A 4.3 A 15.1 C 18.8 C Notes: 1. "Average" control delays (in seconds/vehicle ) are indicated for signal-controlled and All way stop control (AWSC) intersections. 2. "Worst-case" delays are indicated for Two-way-stop (TWSC) controlled intersections. 3. Wrnt = MUTCD based Peak-hour-Volume Signal Warrant #3. 4. / intersection is controlled by a signal under "Skywalk Alternative" and by either a roundabout or a signal under "Triangle Alternative", "Triangle One-Way Alternative", and "PSR Alternative". 5. A layout drawing of the roundabout option for the / Lake Parkway intersection is provided in Appendix Exhibit "Average" and "Worst-case" control delays are indicated for roundabout intersection in avg(w.c.) format. 7. Signal A assumes a 5-lane cross-section of Old b/w Pioneer Trail and Park Avenue. Pioneer Trail intersection SB approach: 1 through lane, 1 free-right lane, 1 left turn pocket. Signal B assumes a 3-lane cross-section of Old b/w Pioneer Trail and Park Avenue. Pioneer Trail intersection SB approach: 1 through lane, 1 free-right turn pocket, 1 left turn pocket. 8. Signal A assumes a 5-lane cross-section of Old b/w Pioneer Trail and Park Avenue. Park Avenue intersection EB approach: 1 through lane, 1 right turn trap lane, 1 left turn pocket. NB approach: dual left turn pockets. Signal B assumes a 3-lane cross-section of Old b/w Pioneer Trail and Park Avenue. Park Avenue intersection EB approach: 1 through-right lane, 1 left turn pocket. NB approach: single left turn pocket. 9. Control Type for this intersection is AWSC under "Alternative A (No-Build)" and "Alternative E (Skywalk)" conditions. 10. Control Type for this intersection is TWSC under "Alternative A (No-Build)" and "Alternative E (Skywalk)" conditions. "-" Intersection does not exist under the specified alternative or otherwise "Not Applicable". * Projected to operate at E for 4 hours or less per day based on analysis of 5 th highest hour, which is considered acceptable per TRPA standards. WR# February 2016 Page 35
37 South Shore Community Revitalization Project One possible mitigation for Alternative C is to reverse the directionality of the proposed one-way segments of (i.e. the old alignment of would carry westbound traffic and the new southern loop alignment of would carry eastbound traffic). This proposed reversal of directionality would reroute/eliminate the significant eastbound left-turn traffic entering the casino core that would be conflicting with the one-way westbound New through traffic at the / Pioneer Trail intersection. Similarly, this proposed reversal of directionality would reroute/eliminate the significant westbound left-turn traffic entering the one-way westbound New that would be conflicting with the one-way eastbound through traffic at the / Lake Parkway intersection. Rerouting these left turns would lead to a significant improvement in delays and throughout the project study area, particularly at the New / Pioneer Trail / Old and New / Lake Parkway / Old intersections. Alternative D (PSR): All study intersections are projected to operate at annual average and summer peak hour C or better under Year 2040 with Project conditions. Alternative E (Skywalk): The New / Pioneer Trail / Old intersection is projected to operate at summer peak hour F under Year 2040 with Project conditions. MUTCD based traffic signal peak hour volume warrant 3 is not projected to be met at any of the unsignalized study intersections under all Year 2040 with Project alternatives. ROADWAY OPERATIONS Table 18 shows peak hour arterial/highway directional segment operations under Year 2040 with Project conditions for all project alternatives. As shown in Table 18: Alternative B (Triangle): All study arterial segments are projected to operate at annual average and summer peak hour E for four hours or less per day or better under Year 2040 with Project conditions. Alternative C (Triangle One-Way): Westbound Old between Pioneer Trail and Park Avenue is projected to operate at annual average and summer peak hour E (and is projected to operate at E for more than four hours per day) under Year 2040 with Project conditions. One-Way Eastbound between Park Avenue and Lake Parkway is projected to operate at summer peak hour F under Year 2040 with Project conditions. All other study arterial segments are projected to operate at acceptable annual average and summer peak hour E for four hours or less per day or better under Existing plus Project conditions. Alternative D (PSR): All study arterial segments are projected to operate at annual average and summer peak hour D or better under Year 2040 with Project conditions. Alternative E (Skywalk): All study arterial segments are projected to operate at annual average and summer peak hour E for four hours or less per day or better under Year 2040 with Project conditions. WR# February 2016 Page 36
38 South Shore Community Revitalization Project Arterial Segment Arterial Class Dir Table 18 - "Year 2040 with Project Arterial Segment Traffic Operations Alternative A (No-Build) Annual Average Summer Peak Alternative B (Triangle) Annual Average Summer Peak Alternative C (Triangle One-Way) Annual Summer Average Peak Alternative D (PSR) Annual Average Summer Peak Alternative E (Skywalk) Annual Average Summer Peak Spd Spd Spd Spd Spd Spd Spd Spd Spd Spd New (b/w Pioneer Trail & ) II EB C 24.2 C C 26.0 C New (b/w Pioneer Trail & ) II WB B 31.4 B B 30.6 B Old (b/w Pioneer Trail &, w/ 5- lane segment b/w III EB 19.3 C 13.8 E* 17.3 D 14.9 D D 15.1 D 21.6 C 16.8 D Pioneer Trail & Park Ave) Old (b/w Pioneer Trail &, w/ 5- lane segment b/w III WB 18.7 C 10.5 E 15.6 D 14.0 D D 14.1 D 21.8 C 12.7 E* Pioneer Trail & Park Ave) Old (b/w Pioneer Trail &, w/ 3- lane segment b/w III EB D 16.4 D Pioneer Trail & Park Ave) Old (b/w Pioneer Trail &, w/ 3- lane segment b/w III WB D 13.4 E* Pioneer Trail & Park Ave) Old (b/w Pioneer Trail & Park Ave) III EB C 11.2 E* Old (b/w Pioneer Trail & Park Ave) III WB E 13.1 E One-Way EB (b/w Park Ave & ) III EB C 9.4 F One-Way WB (b/w Pioneer Trail & Lake II WB E* 15.1 E* Pkwy) Notes: Spd = Average Travel Speed in miles per hour, EB = Eastbound, WB = Westbound, = Level of Service The study roadway segments with a free flow speed of approx mph are regarded as HCM-2010 Class III Arterial. The study roadway segments with a free flow speed of approx. 40 mph are regarded as HCM-2010 Class II Arterial. "-" Roadway segment does not exist under the specified alternative or otherwise operations "Not Applicable". * Projected to operate at E for 4 hours or less per day based on analysis of 5 th highest hour, which is considered acceptable per TRPA standards. WR# February 2016 Page 37
39 South Shore Community Revitalization Project PROPOSED DEVELOPMENT TRAFFIC IMPACTS The proposed Alternatives B, C, and D would all require some existing residences and businesses to be acquired and removed to provide right of way for the proposed new alignment of. In order to mitigate the lost residences and business space, three (3) sites have been identified from the remaining slivers of acquired right of way that could be used for the construction of up to three (3) new developments in order to essentially replace those existing land uses that will be removed. It is anticipated that each of the three (3) proposed developments would contain a mixture of multi-family residential and commercial land uses, and each proposed site size, description, and location would vary slightly under each of the three build alternatives in question. All three proposed development sites combined could contain up to approximately 150 more residential units and 40,000 square feet more commercial area than would be removed because the new developments would be built at a higher unit density than the removed properties (see Appendix Tables 5A-7B for more detail). The following section analyzes how much additional traffic would be generated by the proposed developments, assuming all three sites are built to accommodate the maximum size/density allowed by current City of South Lake Tahoe land use and zoning ordinances and TRPA thresholds, and what, if any, traffic impacts the developments would have on study area roadway facilities. Proposed development land uses and locations presented at the December 2015 Open House are shown in Table 19. The latest available commercial, housing, and hotel unit take numbers are shown in Table 20. Alternative / Development Alternative B (Triangle): Apartments (DU 2 ) Table 19 Proposed Developments Commercial (KSF) Location Site NW corner of realigned / Pioneer Trail intersection. Site NE corner of realigned / Pioneer Trail intersection. Site NW 1 corner of New / Heavenly Village Parkway intersection. Alternative C (Triangle One-Way): Site NW corner of realigned / Pioneer Trail intersection. Site NE corner of realigned / Pioneer Trail intersection. Site NW 1 corner of New / Heavenly Village Parkway intersection. Alternative D (PSR): Site SW and SE corners of realigned / Pioneer Trail intersection. Site NE corner of realigned / Pioneer Trail intersection. Site NW 1 corner of New / Heavenly Village Parkway intersection. 1 NW corner assuming is the east-west direction. (i.e. south of Heavenly Village Parkway and west of New ). 2 Assumed max units allowed per site instead of currently planned number of units to be conservative. WR# February 2016 Page 38
40 South Shore Community Revitalization Project Table 20 Proposed Housing and Hotel Take Numbers Alternative Land Use Unit Quantity Alternative B (Triangle) Alternative C (Triangle One- Way) Alternative D (PSR) General Housing DU 28 Affordable Housing DU 65 Commercial KSF 4 Motel Rooms 155 General Housing DU 18 Affordable Housing DU 60 Commercial KSF 4 Motel Rooms 155 General Housing DU 4 Affordable Housing DU 74 Commercial KSF 15.5 Motel Rooms 41 Trip generation rates from the Institute of Transportation Engineers (ITE) Trip Generation Manual, 9 th Edition were used to estimate trips generated by the proposed developments, as well as those that were generated by the land uses that will be removed with the construction of the project. Trips generated by the land uses to be removed were subtracted from the trips generated by the closest proposed developments in order to calculate net new trips generated by the proposed developments. It was determined that the proposed new developments would generate between approximately 1,400 and 1,700 net new trips per day. Appendix Tables 5A-7B include detailed trip generation calculations and assumptions for each project alternative. Net new trips generated by the proposed developments were assigned to the worst case scenario analyzed (i.e. Year 2040 with Project summer peak hour conditions) under Alternatives B, C, and D. New Development Only turning movement volumes at study area intersections as well as percent distributions are shown in Appendix Figures 21, 22, and 23. Year 2040 plus New Development turning movement volumes at study area intersections are shown in Appendix Figures 24, 25, and 26. Intersection and roadway delays and were obtained for Year 2040 with Project and Proposed Developments conditions using Synchro software. The proposed new developments are not anticipated to be fully constructed until after 2020; therefore, this study analyzes the impact of the proposed developments under Year 2040 conditions only. Furthermore, this study assumes any deficiencies resulting from the addition of these new developments under Year 2040 conditions to be worst case, i.e. if a study facility is projected to operate acceptably under Year 2040 With Project and Proposed Developments conditions, it can be assumed to operate the same or better under Existing/Year 2020 With Project and Proposed Developments conditions. INTERSECTION OPERATIONS Year 2040 with Project and Proposed Developments intersection operations are summarized in Table 21 under Alternatives B, C, and D. WR# February 2016 Page 39
41 # Intersection Park Ave / Pine Blvd / New / Pioneer Trail / Old 7 Old / Park Ave / Heavenly Village Way 8 Old / Friday Ave Old / New / / Old 4 South Shore Community Revitalization Project Table 21 - Year 2040 with Project and Proposed Developments Intersection Traffic Operations Control Type Alternative B (Triangle) Alternative C (Triangle One-Way) Alternative D (PSR) Before Developments Summer Peak Summer Peak Summer Peak With Developments Before Developments With Developments Before Developments With Developments TWSC A 9.8 A 10.2 B 10.2 B 9.8 A 9.8 A AWSC A 8.7 A 9.2 A 9.2 A 8.7 A 8.7 A Signal A 25.2 C 25.1 C F F 24.6 C 29.3 C Signal B 25.0 C 25.5 C Signal A 27.3 C 25.3 C 38.6 D 41.5 D 23.4 C 24.0 C Signal B 32.9 C 31.2 C Signal 14.9 B 14.6 B 31.1 C 36.8 D 14.8 B 18.8 B Signal 20.6 C 23.7 C 81.6 F 89.4 F 22.9 C 23.1 C Signal 25.4 C 26.4 C F F 26.6 C 25.4 C Rndabt 5,6 8.7 (17.2) A (C) 8.9 (17.9) A (C) (340.1) F (F) (399.6) F (F) 8.7 (17.2) New / 8 Heavenly Signal 12.5 B 12.7 B 6.6 A 7.9 A 11.2 B 13.3 B Village Way New / 9 Signal 4.9 A 5.0 A 7.6 A 6.8 A 4.3 A 5.0 A Harrah's Rd Notes: 1. "Average" control delays (in seconds/vehicle ) are indicated for signal-controlled and All way stop control (AWSC) intersections. 2. "Worst-case" delays are indicated for Two-way-stop (TWSC) controlled intersections. 3. Wrnt = MUTCD based Peak-hour-Volume Signal Warrant #3. 4. / intersection is controlled by a signal under "Skywalk Alternative" and by either a roundabout or a signal under "Triangle Alternative", "Triangle One-Way Alternative", and "PSR Alternative". 5. A layout drawing of the roundabout option for the / Lake Parkway intersection is provided in Appendix Exhibit "Average" and "Worst-case" control delays are indicated for roundabout intersection in avg(w.c.) format. 7. Signal A assumes a 5-lane cross-section of Old b/w Pioneer Trail and Park Avenue. Pioneer Trail intersection SB approach: 1 through lane, 1 free-right lane, 1 left turn pocket. Signal B assumes a 3-lane cross-section of Old b/w Pioneer Trail and Park Avenue. Pioneer Trail intersection SB approach: 1 through lane, 1 free-right turn pocket, 1 left turn pocket. 8. Signal A assumes a 5-lane cross-section of Old b/w Pioneer Trail and Park Avenue. Park Avenue intersection EB approach: 1 through lane, 1 right turn trap lane, 1 left turn pocket. NB approach: dual left turn pockets. Signal B assumes a 3-lane cross-section of Old b/w Pioneer Trail and Park Avenue. Park Avenue intersection EB approach: 1 through-right lane, 1 left turn pocket. NB approach: single left turn pocket. "-" Intersection does not exist under the specified alternative or otherwise "Not Applicable". * Projected to operate at E for 4 hours or less per day based on analysis of 5 th highest hour, which is considered acceptable per TRPA standards. As shown in Table 21: A (C) 8.9 (17.9) Alternative B (Triangle): All study intersections are projected to operate at summer peak hour C or better under Year 2040 With Project and Proposed Developments conditions. The addition of new development project trips from all three proposed sites is not projected to create any deficiencies at study area roadway facilities. Alternative C (Triangle One-Way): The New / Pioneer Trail / Old, Old / nue, and New / Lake Parkway / Old intersections are projected to operate at unacceptable summer peak hour F under Year 2040 With Project and Proposed Developments conditions. All of the failing intersections are projected to fail before the addition of new development project trips. Alternative D (PSR): All study intersections are projected to operate at summer peak hour C or better under Year 2040 With Project and Proposed Developments conditions. The addition of A (C) WR# February 2016 Page 40
42 South Shore Community Revitalization Project new development project trips from all three proposed sites is not projected to create any deficiencies at study area roadway facilities. MUTCD based traffic signal peak hour volume warrant 3 is not projected to be met at any of the unsignalized study intersections under all Year 2040 plus Project and Proposed Development alternatives. ROADWAY OPERATIONS Table 22 shows peak hour arterial/highway directional segment operations under Year 2040 with Project and Proposed Developments conditions for Alternatives B, C, and D. As shown in Table 22: Alternative B (Triangle): All directional arterial study segments are projected to operate at summer peak hour E for four hours or less per day or better under Year 2040 With Project and Proposed Developments conditions. The addition of new development project trips from all three proposed sites is not projected to create any deficiencies at study area roadway facilities. Alternative C (Triangle One-Way): Westbound Old between Pioneer Trail and Park Avenue is projected to operate at summer peak hour E (and is projected to operate at E for more than four hours per day) under Year 2040 with Project and Proposed Developments conditions. One-Way Eastbound between Park Avenue and Lake Parkway is projected to operate at summer peak hour F under Year 2040 with Project and Proposed Developments conditions. All of the failing arterial segments are projected to fail before the addition of new development project trips. Alternative D (PSR): All study arterial segments are projected to operate at summer peak hour E for four hours or less per day or better under Year 2040 With Project and Proposed Developments conditions. The addition of new development project trips from all three proposed sites is not projected to create any deficiencies at study area roadway facilities. PARKING IMPACTS The proposed new development Site 3 would be located on the southeast end of the Village Center Shopping Center adjacent to Montreal Road under Alternatives B, C, and D. The southeast end of the shopping center is currently an employee parking lot with capacity for several hundred vehicles. If Site 3 were constructed at the proposed location, the existing employee parking would either be maintained, with the proposed new mixed-use development constructed above the existing lot, or a new parking solution would be developed and constructed at the time of buildout of the proposed new development. All proposed new development sites would include enough parking spaces to meet or exceed City of South Lake Tahoe and TRPA requirements. WR# February 2016 Page 41
43 South Shore Community Revitalization Project Arterial Segment New (b/w Pioneer Trail & ) Table 22 - "Year 2040 with Project and Proposed Developments Arterial Segment Traffic Operations Arterial Class Direction Alternative B (Triangle) Alternative C (Triangle One-Way) Alternative D (PSR) Summer Peak Summer Peak Summer Peak Before Development With Developments Before Development With Developments Before Development With Developments Speed Speed Speed Speed Speed Speed II EB 24.2 C 24.2 C C 22.7 C New (b/w Pioneer Trail & ) Old (b/w Pioneer Trail &, w/ 5-lane segment b/w Pioneer Trail & Park Ave) Old (b/w Pioneer Trail &, w/ 5-lane segment b/w Pioneer Trail & Park Ave) Old (b/w Pioneer Trail &, w/ 3-lane segment b/w Pioneer Trail & Park Ave) Old (b/w Pioneer Trail &, w/ 3-lane segment b/w Pioneer Trail & Park Ave) Old (b/w Pioneer Trail & Park Ave) Old (b/w Pioneer Trail & Park Ave) One-Way EB (b/w Park Ave & ) II WB 31.4 B 31.1 B B 27.2 C III EB 14.9 D 14.4 D D 13.4 E* III WB 14.0 D 14.6 D D 14.7 D III EB 16.4 D 15.7 D III WB 13.4 E* 13.5 E* III EB E* 11.2 E* III WB E 12.0 E III EB F 8.3 F One-Way WB (b/w Pioneer Trail & ) II WB E* 15.1 E* Notes: Speed = Average Travel Speed in miles per hour, EB = Eastbound, WB = Westbound, = Level of Service The study roadway segments with a free flow speed of approx mph are regarded as HCM-2010 Class III Arterial. The study roadway segments with a free flow speed of approx. 40 mph are regarded as HCM-2010 Class II Arterial. "-" Roadway segment does not exist under the specified alternative or otherwise operations "Not Applicable". * Projected to operate at E for 4 hours or less per day based on analysis of 5 th highest hour, which is considered acceptable per TRPA standards. WR# February 2016 Page 42
44 South Shore Community Revitalization Project VMT ANALYSIS Vehicle miles traveled (VMT) is the total miles traveled by vehicles within a specific region over a certain time period. VMT per capita is defined as total VMT in a region dived by the total population of the region. VMT and VMT per capita are both measures of efficiency of the transportation system. As stated in the Analysis Methodology section of this document, TRPA has a general VMT standard of reducing overall VMT within the TRPA region to 10% below 1981 levels. Therefore, any projects that result in an increase in regional VMT (or VMT per capita) are generally regarded as having a negative impact, while any projects that result in a decrease in regional VMT (or VMT per capita) are generally regarded as having a beneficial impact. PROPOSED TRANSPORTATION IMPROVEMENTS VMT ANALYSIS Alternative A (No-Build): The No-Build Alternative would make no changes to the existing roadway network. Therefore, there would be no change to existing regional VMT and the project would have no significant impact. Alternative B (Triangle): Alternative B would lengthen through the Stateline area for both eastbound and westbound traffic by approximately 0.4 miles. This increase in roadway length would lead to vehicles on having to travel a longer distance through the Stateline area, which would lead to a small increase in Regional VMT. The project would have a small negative impact. While the proposed Alternative B would have a small negative impact on VMT when analyzed on its own, the South Shore Revitalization Project has also been assumed as a part of several transportation strategy packages and alternatives proposed/analyzed in the Mobility 2035 Regional Transportation Plan / Sustainable Communities Strategy Draft EIR / EIS (Ascent Environmental, April 25, 2012) (RTP EIR/EIS) for the Tahoe Metropolitan Planning Organization and the Tahoe Regional Planning Agency. The RTP EIR/EIS assumed a version of the South Shore Revitalization Project similar to the proposed Alternatives B and D considered in this document, which would both have similar effects on regional VMT. According to the RTP EIR/EIS, Alternative 3 is the RTP alternative that most closely reflects the preliminary recommendation of the TRPA Governing Board s Regional Plan Update Committee. Additionally, RTP EIR/EIS Alternative 3 has since been selected and approved by the TRPA Governing Board as the alternative that would best achieve TRPA s regional objectives. The RTP EIR/EIS Alternative 3 assumes construction of a number of transportation improvement projects, including the South Shore Revitalization Project, as well as reduced development in the region plus highly incentivized redevelopment in Town Centers, Regional Center, and the High Density Tourist District. The RTP EIR/EIS found that Alternative 3 would have a beneficial impact on VMT as it would cause VMT per capita to decrease from 36.4 in 2010 to 35.3 in 2035, a 3.1 percent reduction. Therefore, since a version of the South Shore Revitalization Project similar to Alternative B was assumed under RTP EIR/EIS Alternative 3, and RTP EIR/EIS Alternative 3 was assumed to have a beneficial impact on VMT, it can be assumed that construction of the proposed Alternative B would not prevent the TRPA region from reaching its goal of reducing VMT below 1981 levels, and Alternative B would have no significant impact. Alternative C (Triangle One-Way): Alternative C would lengthen through the Stateline area for westbound traffic only by approximately 0.4 miles. This increase in roadway length would lead to westbound vehicles on having to travel a longer distance through the Stateline area, which would lead to a very small increase in Regional VMT. The project would have a very small negative impact. WR# February 2016 Page 43
45 South Shore Community Revitalization Project While the proposed Alternative C would have a very small negative impact on VMT when analyzed on its own, the South Shore Revitalization Project has also been assumed as a part of several transportation strategy packages and alternatives proposed/analyzed in the Mobility 2035 Regional Transportation Plan / Sustainable Communities Strategy Draft EIR / EIS (Ascent Environmental, April 25, 2012) (RTP EIR/EIS) for the Tahoe Metropolitan Planning Organization and the Tahoe Regional Planning Agency. The RTP EIR/EIS assumed a version of the South Shore Revitalization Project similar to the proposed Alternatives B and D considered in this document, which would both have similar effects on regional VMT. According to the RTP EIR/EIS, Alternative 3 is the RTP alternative that most closely reflects the preliminary recommendation of the TRPA Governing Board s Regional Plan Update Committee. Additionally, RTP EIR/EIS Alternative 3 has since been selected and approved by the TRPA Governing Board as the alternative that would best achieve TRPA s regional objectives. The RTP EIR/EIS Alternative 3 assumes construction of a number of transportation improvement projects, including the South Shore Revitalization Project, as well as reduced development in the region plus highly incentivized redevelopment in Town Centers, Regional Center, and the High Density Tourist District. The RTP EIR/EIS found that Alternative 3 would have a beneficial impact on VMT as it would cause VMT per capita to decrease from 36.4 in 2010 to 35.3 in 2035, a 3.1 percent reduction. Therefore, since a version of the South Shore Revitalization Project was assumed under RTP EIR/EIS Alternative 3 that would have a slightly larger negative impact on regional VMT than Alternative C would (i.e. would increase regional VMT by a slightly larger amount), and RTP EIR/EIS Alternative 3 was assumed to have a beneficial impact on VMT, it can be assumed that construction of the proposed Alternative C would not prevent the TRPA region from reaching its goal of reducing VMT below 1981 levels, and Alternative C would have no significant impact. Alternative D (PSR): Alternative D would lengthen through the Stateline area for both eastbound and westbound traffic by approximately 0.4 miles. This increase in roadway length would lead to vehicles on having to travel a longer distance through the Stateline area, which would lead to a small increase in Regional VMT. The project would have a small negative impact. While the proposed Alternative D would have a small negative impact on VMT when analyzed on its own, the South Shore Revitalization Project has also been assumed as a part of several transportation strategy packages and alternatives proposed/analyzed in the Mobility 2035 Regional Transportation Plan / Sustainable Communities Strategy Draft EIR / EIS (Ascent Environmental, April 25, 2012) (RTP EIR/EIS) for the Tahoe Metropolitan Planning Organization and the Tahoe Regional Planning Agency. The RTP EIR/EIS assumed a version of the South Shore Revitalization Project similar to the proposed Alternatives B and D considered in this document, which would both have similar effects on regional VMT. According to the RTP EIR/EIS, Alternative 3 is the RTP alternative that most closely reflects the preliminary recommendation of the TRPA Governing Board s Regional Plan Update Committee. Additionally, RTP EIR/EIS Alternative 3 has since been selected and approved by the TRPA Governing Board as the alternative that would best achieve TRPA s regional objectives. The RTP EIR/EIS Alternative 3 assumes construction of a number of transportation improvement projects, including the South Shore Revitalization Project, as well as reduced development in the region plus highly incentivized redevelopment in Town Centers, Regional Center, and the High Density Tourist District. The RTP EIR/EIS found that Alternative 3 would have a beneficial impact on VMT as it would cause VMT per capita to decrease from 36.4 in 2010 to 35.3 in 2035, a 3.1 percent reduction. Therefore, since a version of the South Shore Revitalization Project similar to Alternative D was assumed under RTP EIR/EIS Alternative 3, and RTP EIR/EIS Alternative 3 was assumed to have a beneficial impact on VMT, it can be assumed that construction of the proposed WR# February 2016 Page 44
46 South Shore Community Revitalization Project Alternative D would not prevent the TRPA region from reaching its goal of reducing VMT below 1981 levels, and Alternative D would have no significant impact. Alternative E (Skywalk): Alternative E would only make pedestrian facility changes to the existing transportation network. Therefore, there would be no change to existing regional VMT and the project would have no impact. PROPOSED NEW DEVELOPMENTS VMT ANALYSIS The proposed new developments under Alternatives B, C, and D would all generate slightly more trips than the land uses they would replace (approximately 1,400 1,700 additional daily trips), which could potentially lead to a slight increase in regional VMT. However, buildout of the TRPA region was considered under the RTP EIR/EIS and VMT impacts were analyzed. Since the proposed new developments are actually redevelopments (they are essentially replacing existing land uses) and would all occur within the City of South Lake Tahoe near the casinos, which is one of the areas designated by the RTP as a Town Center / High Density Tourist District, it can be assumed that the proposed new developments were accounted for under RTP EIR/EIS Alternative 3, which assumed construction of the South Shore Community Revitalization Project and incentivized redevelopment in Town Centers, Regional Center, and the High Density Tourist District. The RTP EIR/EIS found that VMT per capita would decrease under RTP EIR/EIS Alternative 3 from 36.4 in 2010 to 35.3 in 2035, a 3.1 percent reduction, due to trip reductions from incentivizing redevelopment in centralized areas (Town Centers, High Density Tourist District, etc.). RTP EIR/EIS Alternative 3 was found to have a beneficial impact on VMT. Therefore, since the proposed new developments were accounted for in RTP EIR/EIs Alternative 3, it can be assumed that the proposed new developments under Alternatives B, C, and D would have no significant impact. WR# February 2016 Page 45
47 South Shore Community Revitalization Project APPENDIX List of Figures Figure 1 Existing Traffic Volumes (Year 2015) Figure 2 Alternative A (No-Build) Lane Geometrics Figure 3A Alternative B (Triangle) Lane Geometrics Figure 3B Alternative B (Triangle) with 3-Lane Option Lane Geometrics Figure 4 Alternative C (Triangle One-Way) Lane Geometrics Figure 5 Alternative D (PSR) Lane Geometrics Figure 6 Alternative E (Skywalk) Lane Geometrics Figure 7 Year 2015 Alternative B (Triangle) Traffic Volumes Figure 8 Year 2015 Alternative C (Triangle One-Way) Traffic Volumes Figure 9 Year 2015 Alternative D (PSR) Traffic Volumes Figure 10 Year 2015 Alternative E (Skywalk) Traffic Volumes Figure 11 Year 2020 Alternative A (No-Build) Traffic Volumes Figure 12 Year 2020 Alternative B (Triangle) Traffic Volumes Figure 13 Year 2020 Alternative C (Triangle One-Way) Traffic Volumes Figure 14 Year 2020 Alternative D (PSR) Traffic Volumes Figure 15 Year 2020 Alternative E (Skywalk) Traffic Volumes Figure 16 Year 2040 Alternative A (No-Build) Traffic Volumes Figure 17 Year 2040 Alternative B (Triangle) Traffic Volumes Figure 18 Year 2040 Alternative C (Triangle One-Way) Traffic Volumes Figure 19 Year 2040 Alternative D (PSR) Traffic Volumes Figure 20 Year 2040 Alternative E (Skywalk) Traffic Volumes Figure 21 Alternative B (Triangle) New Development Only Traffic Volumes Figure 22 Alternative C (Triangle One-Way) New Development Only Traffic Volumes Figure 23 Alternative D (PSR) New Development Only Traffic Volumes Figure 24 Year 2040 Alternative B (Triangle) Plus New Development Traffic Volumes Figure 25 Year 2040 Alternative C (Triangle One-Way) Plus New Development Traffic Volumes Figure 26 Year 2040 Alternative D (PSR) Plus New Development Traffic Volumes List of Exhibits Exhibit 1 Alternative A (No-Build) Conceptual Layout Exhibit 2 Alternative B (Triangle) Conceptual Layout Exhibit 3 Alternative C (Triangle One-Way) Conceptual Layout Exhibit 4 Alternative D (PSR) Conceptual Layout Exhibit 5 Alternative E (Skywalk) Conceptual Layout Exhibit 6 / Lake Parkway Roundabout Layout WR# February 2016 Page 46
48 South Shore Community Revitalization Project Exhibit 7 Project Development Team Meeting for Bypass Project Study Report Development, March 18, 2009 Meeting Minutes List of Tables Appendix Table 1A Near-Term and Long-Term Developments Trip Generation Rates Appendix Table 1B Near-Term and Long-Term Developments Trip Generation Volumes Appendix Table 2 ADT Volume Summary (All Scenarios) Appendix Table 3 ADT-Based Arterial Segment Level of Service () Appendix Table 4 ADT-Based Level of Service () Capacity Thresholds Appendix Table 5A Alternative B Proposed New Developments Trip Generation Rates Appendix Table 5B Alternative B Proposed New Developments Trip Generation Volumes Appendix Table 6A Alternative C Proposed New Developments Trip Generation Rates Appendix Table 6B Alternative C Proposed New Developments Trip Generation Volumes Appendix Table 7A Alternative D Proposed New Developments Trip Generation Rates Appendix Table 7B Alternative D Proposed New Developments Trip Generation Volumes List of Attachments (Separate Cover) Intersection and Arterial Synchro Outputs Roundabout Sidra Outputs MUTCD Signal Warrant Worksheets WR# February 2016 Page 47
49 «7 «2 Legend XXX (XXX) = Annual Average (Summer) Peak Hour Volumes «1 «3 «4 «5 «6 «8 « (51) 7 (9) 25 (31) 62 (77) Park Ave / Park Ave 6 (8) 99 (122) ,500 2 NORTH / Feet 3 / Pioneer Trail 4 / Park Ave/ 5 / Friday Ave 11 (14) 11 (13) 12 (15) 19 (24) 94 (116) 7 (9) 1 (1) 2 (3) Driveway 4 (5) 983 (1213) 109 (135) 11 (14) 5 (6) Park Ave 6 (8) 875 (1080) 19 (24) 11 (13) Friday Ave 6 (8) 906 (1119) 2 (3) 6 (8) 251 (310) 64 (79) 63 (78) 19 (23) 81 (100) 10 (12) 15 (19) 12 (15) 23 (28) 886 (1094) 15 (19) Pioneer Trail 13 (16) 353 (436) 981 (1211) 82 (101) 233 (288) 11 (14) 81 (100) 1033 (1275) 6 / 7 / 8 / 9 / Harrah's Rd 113 (140) 2 (2) 34 (42) 19 (23) 814 (1005) 23 (29) 14 (17) 112 (138) 81 (100) 812 (1003) 55 (68) 5 (6) 92 (114) 140 (173) 181 (223) 41 (50) 41 (50) Harrah's Rd 20 (25) 267 (330) 102 (126) 21 (26) 147 (181) 29 (36) 10 (12) 20 (25) 901 (1112) 26 (32) Driveway 761 (940) 28 (34) 49 (61) 14 (17) 257 (317) 165 (204) 6 (7) Minor Street 7 (9) 5 (6) 267 (330) Figure 1 - Existing Traffic Volumes (Year 2015) State PR Traffic Operations Analysis South Lake Tahoe, CA January 2016 \\woodrodgers.loc\productiondata\jobs\jobs\8436_tahoe\01_us50_pr\gis\tasks\turningmovements_lanegeometrics\turningmovements\fig_2015_np_2015_np.mxd 1/20/2016 2:42:16 PM kmorgan
50 «7 «2 Legend XXX (XXX) = Annual Average (Summer) Peak Hour Volumes «1 «3 «4 «5 «6 «8 «9 I½ (new) 1 41 (51) 7 (9) Pine Ave 25 (31) 62 (77) Park Ave / Park Ave 6 (8) 99 (122) ,500 2 NORTH / Feet 3 New / Pioneer Trail/Old 4 Old / Park Ave/ 5 Old / Friday Ave 11 (14) 11 (13) 12 (15) 19 (24) 94 (116) 369 (456) 134 (166) 4 (5) Old 694 (857) 109 (135) 11 (14) 5 (6) Park Ave 6 (8) 262 (323) 19 (24) 11 (13) Friday Ave 6 (8) 312 (385) 2 (3) 339 (418) 266 (329) New Old 64 (79) 63 (78) Old Old 19 (23) Old 81 (100) 10 (12) 15 (19) 12 (15) 23 (28) 651 (804) 15 (19) Pioneer Trail 13 (16) 70 (87) 380 (469) 206 (254) 32 (40) 117 (144) 11 (14) 81 (100) 273 (337) 6 Old / 7 New / /Old 8 New / 9 New / Harrah's Rd 113 (140) 2 (2) 34 (42) 19 (23) 205 (253) 23 (29) 14 (17) 112 (138) 81 (100) 203 (251) 172 (212) 5 (6) 92 (114) 140 (173) 790 (975) 41 (50) 41 (50) Harrah's Rd 20 (25) 876 (1082) Old 51 (63) Old Old 21 (26) 756 (933) New 79 (97) 10 (12) New New 83 (102) New 207 (255) 26 (32) Driveway 130 (160) 28 (34) New 49 (61) 65 (80) 895 (1105) 951 (1174) 6 (7) Minor Street 7 (9) 5 (6) 969 (1196) Figure 2 - Year 2015 "Alternative B (Triangle)" Traffic Volumes State PR Traffic Operations Analysis South Lake Tahoe, CA January 2016 \\woodrodgers.loc\productiondata\jobs\jobs\8436_tahoe\01_us50_pr\gis\tasks\turningmovements_lanegeometrics\turningmovements\fig_2015_tri_2015_tri.mxd 1/20/2016 2:39:57 PM kmorgan
51 «7 «2 Legend XXX (XXX) = Annual Average (Summer) Peak Hour Volumes «1 «3 «4 «5 «6 «8 «9 I½ (new) 1 41 (51) 7 (9) 25 (31) 62 (77) Park Ave / Park Ave 6 (8) 109 (134) ,500 2 NORTH / Feet 3 / Pioneer Trail 4 EB / Park Ave/ 5 EB / Friday Ave 11 (14) 11 (13) 12 (15) 19 (24) 104 (128) 280 (346) 99 (122) EB 787 (972) 242 (299) 11 (14) 5 (6) Park Ave 11 (13) Friday Ave 2 (3) 38 (47) 993 (1226) 299 (369) WB EB 64 (79) EB EB 19 (23) EB 81 (100) 10 (12) 15 (19) 12 (15) 23 (28) 15 (19) Pioneer Trail 13 (16) 454 (560) 1159 (1431) 117 (144) 117 (144) 11 (14) 173 (214) 1319 (1628) 6 EB / 7 / 8 WB / 9 WB / Harrah's Rd 2 (2) 34 (42) 37 (46) 112 (138) 113 (139) 172 (212) 11 (13) 203 (251) 914 (1128) 41 (50) Harrah's Rd 28 (35) 1064 (1313) EB 102 (126) EB EB 35 (43) 927 (1145) WB 10 (12) WB WB WB 1181 (1458) 46 (57) Driveway 1019 (1258) 28 (34) WB Minor Street 7 (9) 13 (16) Figure 3 - Year 2015 "Alternative C (Triangle One-Way)" Traffic Volumes State PR Traffic Operations Analysis South Lake Tahoe, CA January 2016 \\woodrodgers.loc\productiondata\jobs\jobs\8436_tahoe\01_us50_pr\gis\tasks\turningmovements_lanegeometrics\turningmovements\fig_2015_t1w_2015_t1w.mxd 1/20/2016 2:38:05 PM kmorgan
52 «7 «2 Legend XXX (XXX) = Annual Average (Summer) Peak Hour Volumes «1 «3 «4 «5 «6 «8 «9 I½ (new) 1 41 (51) 7 (9) Pine Ave 25 (31) 62 (77) Park Ave / Park Ave 6 (8) 99 (122) ,500 2 NORTH / Feet 3 New / Pioneer Trail/Old 4 Old / Park Ave/ 5 Old / Friday Ave 11 (14) 11 (13) 12 (15) 19 (24) 94 (116) 369 (456) 134 (166) 4 (5) Old 694 (857) 109 (135) 11 (14) 5 (6) Park Ave 6 (8) 262 (323) 19 (24) 11 (13) Friday Ave 6 (8) 312 (385) 2 (3) 339 (418) 266 (329) New Old 64 (79) 63 (78) Old Old 19 (23) Old 81 (100) 10 (12) 15 (19) 12 (15) 23 (28) 651 (804) 15 (19) Pioneer Trail 13 (16) 70 (87) 380 (469) 206 (254) 32 (40) 117 (144) 11 (14) 81 (100) 273 (337) 6 Old / 7 New / /Old 8 New / 9 New / Harrah's Rd 113 (140) 2 (2) 34 (42) 19 (23) 205 (253) 23 (29) 14 (17) 112 (138) 81 (100) 203 (251) 172 (212) 5 (6) 92 (114) 140 (173) 790 (975) 41 (50) 41 (50) Harrah's Rd 20 (25) 876 (1082) Old 51 (63) Old Old 21 (26) 756 (933) New 79 (97) 10 (12) New New 83 (102) New 207 (255) 26 (32) Driveway 130 (160) 28 (34) New 49 (61) 65 (80) 895 (1105) 951 (1174) 6 (7) Minor Street 7 (9) 5 (6) 969 (1196) Figure 4 - Year 2015 "Alternative D (PSR)" Traffic Volumes State PR Traffic Operations Analysis South Lake Tahoe, CA January 2016 \\woodrodgers.loc\productiondata\jobs\jobs\8436_tahoe\01_us50_pr\gis\tasks\turningmovements_lanegeometrics\turningmovements\fig_2015_2_2015_2.mxd 1/20/2016 2:39:34 PM kmorgan
53 «7 «2 Legend XXX (XXX) = Annual Average (Summer) Peak Hour Volumes «1 «3 «4 «5 «6 «8 « (51) 7 (9) 25 (31) 62 (77) Park Ave / Park Ave 6 (8) 99 (122) ,500 2 NORTH / Feet 3 / Pioneer Trail 4 / Park Ave/ 5 / Friday Ave 11 (14) 11 (13) 12 (15) 19 (24) 94 (116) 7 (9) 1 (1) 2 (3) Driveway 4 (5) 983 (1213) 109 (135) 11 (14) 5 (6) Park Ave 6 (8) 875 (1080) 19 (24) 11 (13) Friday Ave 6 (8) 906 (1119) 2 (3) 6 (8) 251 (310) 64 (79) 63 (78) 19 (23) 81 (100) 10 (12) 15 (19) 12 (15) 23 (28) 886 (1094) 15 (19) Pioneer Trail 13 (16) 353 (436) 981 (1211) 82 (101) 233 (288) 11 (14) 81 (100) 1033 (1275) 6 / 7 / 8 / 9 / Harrah's Rd 113 (140) 2 (2) 34 (42) 19 (23) 814 (1005) 23 (29) 14 (17) 112 (138) 81 (100) 812 (1003) 55 (68) 5 (6) 92 (114) 140 (173) 181 (223) 41 (50) 41 (50) Harrah's Rd 20 (25) 267 (330) 102 (126) 21 (26) 147 (181) 29 (36) 10 (12) 20 (25) 901 (1112) 26 (32) Driveway 761 (940) 28 (34) 49 (61) 14 (17) 257 (317) 165 (204) 6 (7) Minor Street 7 (9) 5 (6) 267 (330) Figure 5 - Year 2015 "Alternative E (Skywalk)" Traffic Volumes State PR Traffic Operations Analysis South Lake Tahoe, CA January 2016 \\woodrodgers.loc\productiondata\jobs\jobs\8436_tahoe\01_us50_pr\gis\tasks\turningmovements_lanegeometrics\turningmovements\fig_2015_sky_2015_sky.mxd 1/20/2016 2:42:39 PM kmorgan
54 «7 «2 Legend XXX (XXX) = Annual Average (Summer) Peak Hour Volumes «1 «3 «4 «5 «6 «8 « (51) 7 (9) 25 (31) 79 (97) Park Ave / Park Ave 6 (8) 113 (139) ,500 2 NORTH / Feet 3 / Pioneer Trail 4 / Park Ave/ 5 / Friday Ave 11 (14) 11 (13) 12 (15) 19 (24) 108 (133) 7 (9) 1 (1) 2 (3) Driveway 4 (5) 1037 (1280) 123 (152) 11 (14) 5 (6) Park Ave 6 (8) 923 (1140) 33 (41) 24 (30) Friday Ave 22 (27) 941 (1162) 2 (3) 6 (8) 269 (332) 80 (99) 63 (78) 34 (42) 97 (120) 10 (12) 15 (19) 12 (15) 23 (28) 934 (1153) 15 (19) Pioneer Trail 13 (16) 369 (456) 1021 (1261) 89 (110) 243 (300) 11 (14) 81 (100) 1058 (1306) 6 / 7 / 8 / 9 / Harrah's Rd 113 (140) 2 (2) 34 (42) 19 (23) 864 (1067) 30 (37) 14 (17) 130 (161) 108 (133) 856 (1057) 55 (68) 5 (6) 100 (123) 150 (185) 181 (223) 41 (50) 41 (50) Harrah's Rd 20 (25) 276 (341) 102 (126) 30 (37) 156 (192) 29 (36) 10 (12) 20 (25) 940 (1160) 26 (32) Driveway 791 (977) 28 (34) 49 (61) 14 (17) 264 (326) 165 (204) 6 (7) Minor Street 7 (9) 5 (6) 275 (339) Figure 6 - Year 2018 "Alternative A (No-Build)" Traffic Volumes State PR Traffic Operations Analysis South Lake Tahoe, CA January 2016 \\woodrodgers.loc\productiondata\jobs\jobs\8436_tahoe\01_us50_pr\gis\tasks\turningmovements_lanegeometrics\turningmovements\fig_2018_np_2018_np.mxd 1/20/2016 2:43:02 PM kmorgan
55 «7 «2 Legend XXX (XXX) = Annual Average (Summer) Peak Hour Volumes «1 «3 «4 «5 «6 «8 «9 I½ (new) 1 41 (51) 7 (9) Pine Ave 25 (31) 79 (97) Park Ave / Park Ave 6 (8) 113 (139) ,500 2 NORTH / Feet 3 New / Pioneer Trail/Old 4 Old / Park Ave/ 5 Old / Friday Ave 11 (14) 11 (13) 12 (15) 19 (24) 108 (133) 394 (487) 143 (177) 4 (5) Old 722 (891) 123 (152) 11 (14) 5 (6) Park Ave 6 (8) 277 (342) 33 (41) 24 (30) Friday Ave 22 (27) 313 (387) 2 (3) 356 (440) 277 (342) New Old 80 (99) 63 (78) Old Old 34 (42) Old 97 (120) 10 (12) 15 (19) 12 (15) 23 (28) 681 (841) 15 (19) Pioneer Trail 13 (16) 74 (91) 393 (485) 207 (256) 36 (44) 122 (150) 11 (14) 81 (100) 259 (320) 6 Old / 7 New / /Old 8 New / 9 New / Harrah's Rd 113 (140) 2 (2) 34 (42) 19 (23) 222 (274) 30 (37) 14 (17) 130 (161) 108 (133) 214 (264) 177 (218) 5 (6) 100 (123) 150 (185) 823 (1016) 41 (50) 41 (50) Harrah's Rd 20 (25) 919 (1134) Old 51 (63) Old Old 30 (37) 798 (985) New 83 (102) 10 (12) New New 83 (102) New 207 (255) 26 (32) Driveway 121 (149) 28 (34) New 49 (61) 65 (80) 941 (1162) 990 (1222) 6 (7) Minor Street 7 (9) 5 (6) 1015 (1253) Figure 7 - Year 2018 "Alternative B (Triangle)" Traffic Volumes State PR Traffic Operations Analysis South Lake Tahoe, CA January 2016 \\woodrodgers.loc\productiondata\jobs\jobs\8436_tahoe\01_us50_pr\gis\tasks\turningmovements_lanegeometrics\turningmovements\fig_2018_tri_2018_tri.mxd 1/20/2016 2:40:41 PM kmorgan
56 «7 «2 Legend XXX (XXX) = Annual Average (Summer) Peak Hour Volumes «1 «3 «4 «5 «6 «8 «9 I½ (new) 1 41 (51) 7 (9) 25 (31) 79 (97) Park Ave / Park Ave 6 (8) 130 (161) ,500 2 NORTH / Feet 3 / Pioneer Trail 4 EB / Park Ave/ 5 EB / Friday Ave 11 (14) 11 (13) 12 (15) 19 (24) 126 (155) 304 (375) 108 (133) EB 816 (1007) 270 (333) 11 (14) 5 (6) Park Ave 24 (30) Friday Ave 2 (3) 46 (57) 1041 (1285) 309 (382) WB EB 80 (99) EB EB 34 (42) EB 97 (120) 10 (12) 15 (19) 12 (15) 23 (28) 15 (19) Pioneer Trail 13 (16) 470 (580) 1200 (1481) 124 (153) 122 (150) 11 (14) 181 (223) 1351 (1668) 6 EB / 7 / 8 WB / 9 WB / Harrah's Rd 2 (2) 34 (42) 44 (54) 130 (161) 155 (191) 177 (218) 11 (13) 213 (263) 949 (1171) 41 (50) Harrah's Rd 28 (35) 1107 (1367) EB 102 (126) EB EB 44 (54) 965 (1191) WB 10 (12) WB WB WB 1227 (1515) 46 (57) Driveway 1056 (1304) 28 (34) WB Minor Street 7 (9) 13 (16) Figure 8 - Year 2018 "Alternative C (Triangle One-Way)" Traffic Volumes State PR Traffic Operations Analysis South Lake Tahoe, CA January 2016 \\woodrodgers.loc\productiondata\jobs\jobs\8436_tahoe\01_us50_pr\gis\tasks\turningmovements_lanegeometrics\turningmovements\fig_2018_t1w_2018_t1w.mxd 1/20/2016 2:38:28 PM kmorgan
57 «7 «2 Legend XXX (XXX) = Annual Average (Summer) Peak Hour Volumes «1 «3 «4 «5 «6 «8 «9 I½ (new) 1 41 (51) 7 (9) Pine Ave 25 (31) 79 (97) Park Ave / Park Ave 6 (8) 113 (139) ,500 2 NORTH / Feet 3 New / Pioneer Trail/Old 4 Old / Park Ave/ 5 Old / Friday Ave 11 (14) 11 (13) 12 (15) 19 (24) 108 (133) 394 (487) 143 (177) 4 (5) Old 722 (891) 123 (152) 11 (14) 5 (6) Park Ave 6 (8) 277 (342) 33 (41) 24 (30) Friday Ave 22 (27) 313 (387) 2 (3) 356 (440) 277 (342) New Old 80 (99) 63 (78) Old Old 34 (42) Old 97 (120) 10 (12) 15 (19) 12 (15) 23 (28) 681 (841) 15 (19) Pioneer Trail 13 (16) 74 (91) 393 (485) 207 (256) 36 (44) 122 (150) 11 (14) 81 (100) 259 (320) 6 Old / 7 New / /Old 8 New / 9 New / Harrah's Rd 113 (140) 2 (2) 34 (42) 19 (23) 222 (274) 30 (37) 14 (17) 130 (161) 108 (133) 214 (264) 177 (218) 5 (6) 100 (123) 150 (185) 823 (1016) 41 (50) 41 (50) Harrah's Rd 20 (25) 919 (1134) Old 51 (63) Old Old 30 (37) 798 (985) New 83 (102) 10 (12) New New 83 (102) New 207 (255) 26 (32) Driveway 121 (149) 28 (34) New 49 (61) 65 (80) 941 (1162) 990 (1222) 6 (7) Minor Street 7 (9) 5 (6) 1015 (1253) Figure 9 - Year 2018 "Alternative D (PSR)" Traffic Volumes State PR Traffic Operations Analysis South Lake Tahoe, CA January 2016 \\woodrodgers.loc\productiondata\jobs\jobs\8436_tahoe\01_us50_pr\gis\tasks\turningmovements_lanegeometrics\turningmovements\fig_2018_2_2018_2.mxd 1/20/2016 2:40:19 PM kmorgan
58 «7 «2 Legend XXX (XXX) = Annual Average (Summer) Peak Hour Volumes «1 «3 «4 «5 «6 «8 « (51) 7 (9) 25 (31) 79 (97) Park Ave / Park Ave 6 (8) 113 (139) ,500 2 NORTH / Feet 3 / Pioneer Trail 4 / Park Ave/ 5 / Friday Ave 11 (14) 11 (13) 12 (15) 19 (24) 108 (133) 7 (9) 1 (1) 2 (3) Driveway 4 (5) 1037 (1280) 123 (152) 11 (14) 5 (6) Park Ave 6 (8) 923 (1140) 33 (41) 24 (30) Friday Ave 22 (27) 941 (1162) 2 (3) 6 (8) 269 (332) 80 (99) 63 (78) 34 (42) 97 (120) 10 (12) 15 (19) 12 (15) 23 (28) 934 (1153) 15 (19) Pioneer Trail 13 (16) 369 (456) 1021 (1261) 89 (110) 243 (300) 11 (14) 81 (100) 1058 (1306) 6 / 7 / 8 / 9 / Harrah's Rd 113 (140) 2 (2) 34 (42) 19 (23) 864 (1067) 30 (37) 14 (17) 130 (161) 108 (133) 856 (1057) 55 (68) 5 (6) 100 (123) 150 (185) 181 (223) 41 (50) 41 (50) Harrah's Rd 20 (25) 276 (341) 102 (126) 30 (37) 156 (192) 29 (36) 10 (12) 20 (25) 940 (1160) 26 (32) Driveway 791 (977) 28 (34) 49 (61) 14 (17) 264 (326) 165 (204) 6 (7) Minor Street 7 (9) 5 (6) 275 (339) Figure 10 - Year 2018 "Alternative E (Skywalk)" Traffic Volumes State PR Traffic Operations Analysis South Lake Tahoe, CA January 2016 \\woodrodgers.loc\productiondata\jobs\jobs\8436_tahoe\01_us50_pr\gis\tasks\turningmovements_lanegeometrics\turningmovements\fig_2018_sky_2018_sky.mxd 1/20/2016 2:43:26 PM kmorgan
59 «7 «2 Legend XXX (XXX) = Annual Average (Summer) Peak Hour Volumes «1 «3 «4 «5 «6 «8 « (51) 7 (9) 25 (31) 79 (97) Park Ave / Park Ave 6 (8) 113 (139) ,500 2 NORTH / Feet 3 / Pioneer Trail 4 / Park Ave/ 5 / Friday Ave 11 (14) 11 (13) 12 (15) 19 (24) 108 (133) Driveway 1119 (1381) 136 (168) 32 (40) Park Ave 990 (1222) 46 (57) 58 (71) Friday Ave 54 (67) 1034 (1277) 2 (3) 301 (371) 96 (119) 69 (85) 51 (63) 97 (120) 10 (12) 15 (19) 12 (15) 23 (28) 1007 (1243) Pioneer Trail 404 (499) 1093 (1349) 100 (123) 277 (342) 19 (24) 94 (116) 1116 (1378) 6 / 7 / 8 / 9 / Harrah's Rd 126 (156) 45 (56) 32 (40) 940 (1161) 30 (37) 130 (161) 114 (141) 946 (1168) 58 (71) 116 (143) 162 (200) 188 (232) 52 (64) 45 (56) Harrah's Rd 24 (30) 277 (342) 117 (144) 30 (37) 185 (228) 32 (40) 28 (34) 1010 (1247) 32 (40) Driveway 873 (1078) 32 (40) 58 (71) 278 (343) 172 (212) Minor Street 284 (350) Figure 11 - Year 2038 "Alternative A (No-Build)" Traffic Volumes State PR Traffic Operations Analysis South Lake Tahoe, CA January 2016 \\woodrodgers.loc\productiondata\jobs\jobs\8436_tahoe\01_us50_pr\gis\tasks\turningmovements_lanegeometrics\turningmovements\fig_2038_np_2038_np.mxd 1/20/2016 2:43:49 PM kmorgan
60 «7 «2 Legend XXX (XXX) = Annual Average (Summer) Peak Hour Volumes «1 «3 «4 «5 «6 «8 «9 I½ (new) 1 41 (51) 7 (9) Pine Ave 25 (31) 79 (97) Park Ave / Park Ave 6 (8) 113 (139) ,500 2 NORTH / Feet 3 New / Pioneer Trail/Old 4 Old / Park Ave/ 5 Old / Friday Ave 11 (14) 11 (13) 12 (15) 19 (24) 108 (133) 416 (514) 151 (186) 4 (5) Old 791 (976) 136 (168) 32 (40) Park Ave 272 (336) 46 (57) 58 (71) Friday Ave 54 (67) 303 (374) 2 (3) 386 (476) 303 (374) New Old 96 (119) 69 (85) Old Old 51 (63) Old 97 (120) 10 (12) 15 (19) 12 (15) 23 (28) 731 (903) Pioneer Trail 89 (110) 425 (525) 216 (267) 40 (49) 139 (171) 19 (24) 94 (116) 267 (330) 6 Old / 7 New / /Old 8 New / 9 New / Harrah's Rd 126 (156) 45 (56) 32 (40) 231 (285) 30 (37) 130 (161) 114 (141) 237 (292) 196 (242) 116 (143) 162 (200) 897 (1108) 52 (64) 45 (56) Harrah's Rd 24 (30) 987 (1218) Old 58 (72) Old Old 30 (37) 894 (1104) New 92 (114) New New 87 (108) New 234 (289) 32 (40) Driveway 157 (194) 32 (40) New 58 (71) 75 (92) 1018 (1257) 1060 (1309) Minor Street 1105 (1364) Figure 12 - Year 2038 "Alternative B (Triangle)" Traffic Volumes State PR Traffic Operations Analysis South Lake Tahoe, CA January 2016 \\woodrodgers.loc\productiondata\jobs\jobs\8436_tahoe\01_us50_pr\gis\tasks\turningmovements_lanegeometrics\turningmovements\fig_2038_tri_2038_tri.mxd 1/20/2016 2:41:27 PM kmorgan
61 «7 «2 Legend XXX (XXX) = Annual Average (Summer) Peak Hour Volumes «1 «3 «4 «5 «6 «8 «9 I½ (new) 1 41 (51) 7 (9) 25 (31) 79 (97) Park Ave / Park Ave 6 (8) 148 (183) ,500 2 NORTH / Feet 3 / Pioneer Trail 4 EB / Park Ave/ 5 EB / Friday Ave 11 (14) 11 (13) 12 (15) 19 (24) 143 (177) 348 (430) 123 (152) EB 855 (1056) 309 (381) 32 (40) Park Ave 58 (71) Friday Ave 2 (3) 76 (94) 1121 (1384) 325 (401) WB EB 96 (119) EB EB 51 (63) EB 97 (120) 10 (12) 15 (19) 12 (15) 23 (28) Pioneer Trail 518 (640) 1281 (1581) 140 (173) 139 (171) 19 (24) 210 (259) 1447 (1787) 6 EB / 7 / 8 WB / 9 WB / Harrah's Rd 45 (56) 46 (57) 130 (161) 209 (258) 196 (242) 231 (285) 984 (1215) 52 (64) Harrah's Rd 41 (50) 1142 (1410) EB 117 (144) EB EB 46 (57) 1036 (1279) WB WB WB WB 1328 (1640) 60 (74) Driveway 1163 (1436) 32 (40) WB Minor Street 24 (30) Figure 13 - Year 2038 "Alternative C (Triangle One-Way)" Traffic Volumes State PR Traffic Operations Analysis South Lake Tahoe, CA January 2016 \\woodrodgers.loc\productiondata\jobs\jobs\8436_tahoe\01_us50_pr\gis\tasks\turningmovements_lanegeometrics\turningmovements\fig_2038_t1w_2038_t1w.mxd 1/20/2016 2:38:54 PM kmorgan
62 «7 «2 Legend XXX (XXX) = Annual Average (Summer) Peak Hour Volumes «1 «3 «4 «5 «6 «8 «9 I½ (new) 1 41 (51) 7 (9) Pine Ave 25 (31) 79 (97) Park Ave / Park Ave 6 (8) 113 (139) ,500 2 NORTH / Feet 3 New / Pioneer Trail/Old 4 Old / Park Ave/ 5 Old / Friday Ave 11 (14) 11 (13) 12 (15) 19 (24) 108 (133) 416 (514) 151 (186) 4 (5) Old 791 (976) 136 (168) 32 (40) Park Ave 272 (336) 46 (57) 58 (71) Friday Ave 54 (67) 303 (374) 2 (3) 386 (476) 303 (374) New Old 96 (119) 69 (85) Old Old 51 (63) Old 97 (120) 10 (12) 15 (19) 12 (15) 23 (28) 731 (903) Pioneer Trail 89 (110) 425 (525) 216 (267) 40 (49) 139 (171) 19 (24) 94 (116) 267 (330) 6 Old / 7 New / /Old 8 New / 9 New / Harrah's Rd 126 (156) 45 (56) 32 (40) 231 (285) 30 (37) 130 (161) 114 (141) 237 (292) 196 (242) 116 (143) 162 (200) 897 (1108) 52 (64) 45 (56) Harrah's Rd 24 (30) 987 (1218) Old 58 (72) Old Old 30 (37) 894 (1104) New 92 (114) New New 87 (108) New 234 (289) 32 (40) Driveway 157 (194) 32 (40) New 58 (71) 75 (92) 1018 (1257) 1060 (1309) Minor Street 1105 (1364) Figure 14 - Year 2038 "Alternative D (PSR)" Traffic Volumes State PR Traffic Operations Analysis South Lake Tahoe, CA January 2016 \\woodrodgers.loc\productiondata\jobs\jobs\8436_tahoe\01_us50_pr\gis\tasks\turningmovements_lanegeometrics\turningmovements\fig_2038_2_2038_2.mxd 1/20/2016 2:41:04 PM kmorgan
63 «7 «2 Legend XXX (XXX) = Annual Average (Summer) Peak Hour Volumes «1 «3 «4 «5 «6 «8 « (51) 7 (9) 25 (31) 79 (97) Park Ave / Park Ave 6 (8) 113 (139) ,500 2 NORTH / Feet 3 / Pioneer Trail 4 / Park Ave/ 5 / Friday Ave 11 (14) 11 (13) 12 (15) 19 (24) 108 (133) Driveway 1119 (1381) 136 (168) 32 (40) Park Ave 990 (1222) 46 (57) 58 (71) Friday Ave 54 (67) 1034 (1277) 2 (3) 301 (371) 96 (119) 69 (85) 51 (63) 97 (120) 10 (12) 15 (19) 12 (15) 23 (28) 1007 (1243) Pioneer Trail 404 (499) 1093 (1349) 100 (123) 277 (342) 19 (24) 94 (116) 1116 (1378) 6 / 7 / 8 / 9 / Harrah's Rd 126 (156) 45 (56) 32 (40) 940 (1161) 30 (37) 130 (161) 114 (141) 946 (1168) 58 (71) 116 (143) 162 (200) 188 (232) 52 (64) 45 (56) Harrah's Rd 24 (30) 277 (342) 117 (144) 30 (37) 185 (228) 32 (40) 28 (34) 1010 (1247) 32 (40) Driveway 873 (1078) 32 (40) 58 (71) 278 (343) 172 (212) Minor Street 284 (350) Figure 15 - Year 2038 "Alternative E (Skywalk)" Traffic Volumes State PR Traffic Operations Analysis South Lake Tahoe, CA January 2016 \\woodrodgers.loc\productiondata\jobs\jobs\8436_tahoe\01_us50_pr\gis\tasks\turningmovements_lanegeometrics\turningmovements\fig_2038_sky_2038_sky.mxd 1/20/2016 2:44:14 PM kmorgan


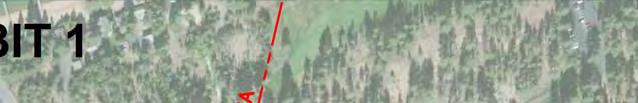


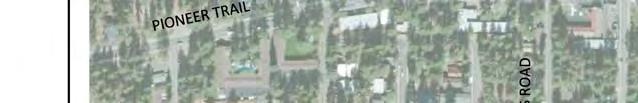
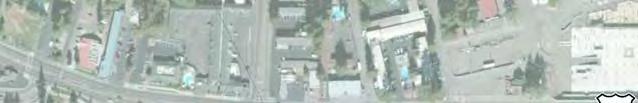
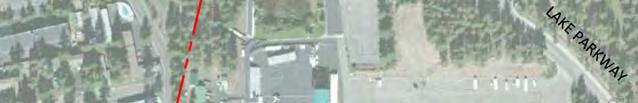
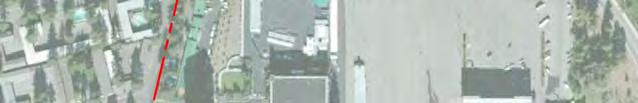
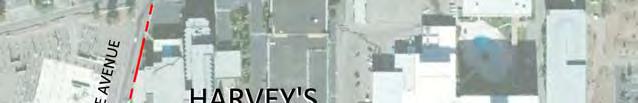
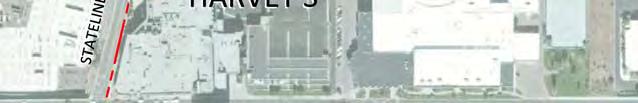
64

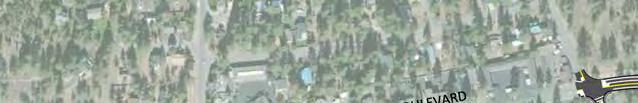
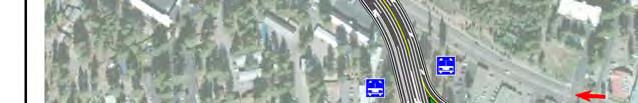
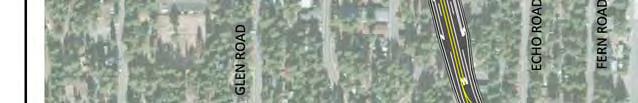
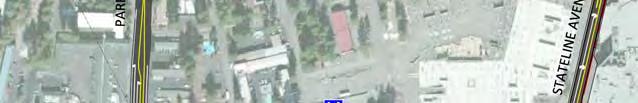
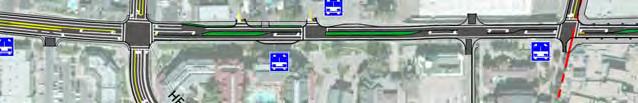
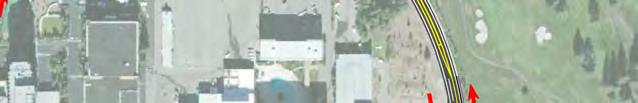
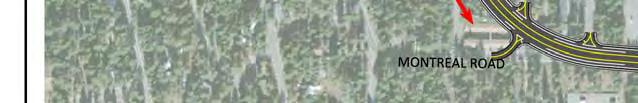


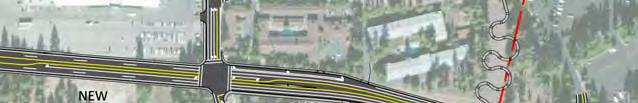


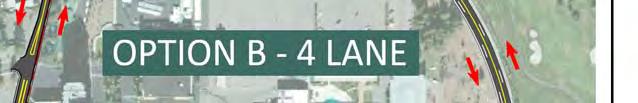
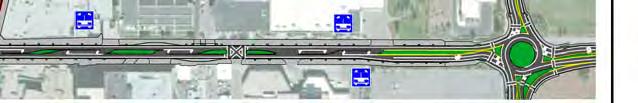
65


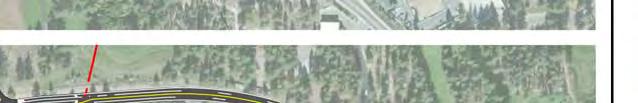


66


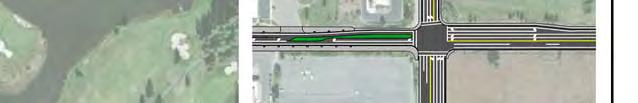


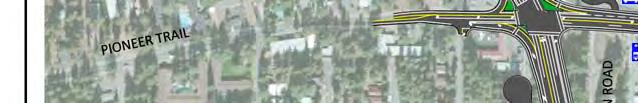
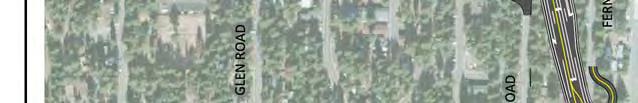


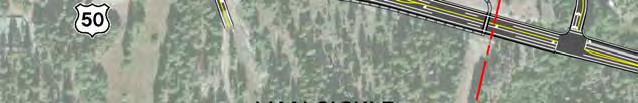

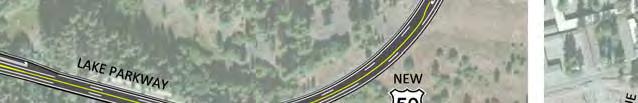


67


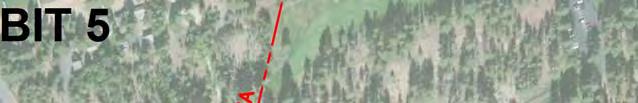
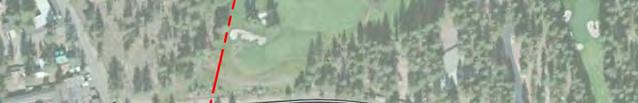


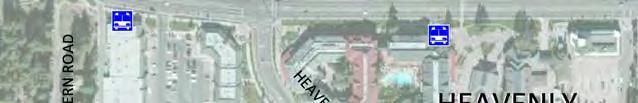
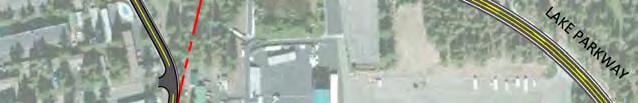
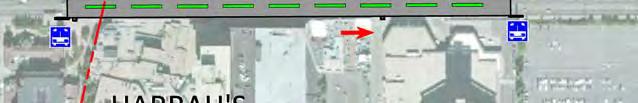
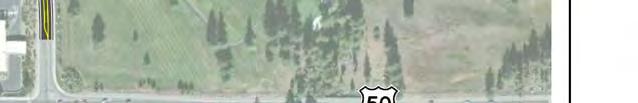
68
NOTICE OF AVAILABILITY/NOTICE OF COMMENT PERIOD OF A DRAFT EIR/EIS/EIS FOR PUBLIC REVIEW AND HEARINGS
 Tahoe Transportation District 128 Market Street, Suite 3F Stateline, NV 89449 Phone: (775) 589-5500 www.tahoetransportation.org Federal Highway Administration 650 Capitol Mall, Suite 4-100 Sacramento,
Traffic Impact Analysis Walton Acres at Riverwood Athletic Club Clayton, NC
 Traffic Impact Analysis Walton Acres at Riverwood Athletic Club Clayton, NC 1. TABLE OF CONTENTS INTRODUCTION...1 1.1. Site Location and Study Area...1 1.2. Proposed Land Use and Site Access...2 1.3.
TABLE OF CONTENTS TABLE OF CONTENTS... I APPENDICES... III LIST OF EXHIBITS... V LIST OF TABLES... VII LIST OF ABBREVIATED TERMS...
 TABLE OF CONTENTS TABLE OF CONTENTS... I APPENDICES... III LIST OF EXHIBITS... V LIST OF TABLES... VII LIST OF ABBREVIATED TERMS... IX 1 INTRODUCTION... 1 1.1 Project Overview... 1 1.2 Analysis Scenarios...
TRAFFIC IMPACT ANALYSIS
 TRAFFIC IMPACT ANALYSIS FOR THE CHAMPAIGN UNIT#4 SCHOOL DISTRICT PROPOSED HIGH SCHOOL (SPALDING PARK SITE) IN THE CITY OF CHAMPAIGN Final Report Champaign Urbana Urbanized Area Transportation Study 6/24/2014
Complete Street Analysis of a Road Diet: Orange Grove Boulevard, Pasadena, CA
 Complete Street Analysis of a Road Diet: Orange Grove Boulevard, Pasadena, CA Aaron Elias, Bill Cisco Abstract As part of evaluating the feasibility of a road diet on Orange Grove Boulevard in Pasadena,
Figure 1: Vicinity Map of the Study Area
 ARIZONA TEXAS NEW MEXICO OKLAHOMA May 5, 2016 Mr. Anthony Beach, P.E. BSP Engineers 4800 Lakewood Drive, Suite 4 Waco, Texas 76710 Re: Intersection and Access Analysis along Business 190 in Copperas Cove
TRANSPORTATION ANALYSIS REPORT US Route 6 Huron, Erie County, Ohio
 TRANSPORTATION ANALYSIS REPORT US Route 6 Huron, Erie County, Ohio December 12, 2012 Prepared for: The City of Huron 417 Main Huron, OH 44839 Providing Practical Experience Technical Excellence and Client
DUNBOW ROAD FUNCTIONAL PLANNING
 DUNBOW ROAD FUNCTIONAL PLANNING Final Report August 3, 216 #31, 316 5th Avenue NE Calgary, AB T2A 6K4 Phone: 43.273.91 Fax: 43.273.344 wattconsultinggroup.com Dunbow Road Functional Planning Final Report
Traffic Impact Analysis Chatham County Grocery Chatham County, NC
 Chatham County Grocery Chatham County, NC TABLE OF CONTENTS 1. INTRODUCTION... 1 1.1. Location and Study Area... 1 1.2. Proposed Land Use and Access... 2 1.3. Adjacent Land Uses... 2 1.4. Existing ways...
Project Report. South Kirkwood Road Traffic Study. Meadows Place, TX October 9, 2015
 Meadows Place, TX October 9, 2015 Contents 1 Introduction... 1 2 Data Collection... 1 3 Existing Roadway Network... 2 4 Traffic Volume Development... 2 5 Warrant Analysis... 3 6 Traffic Control Alternative
Chapter 4 Traffic Analysis
 Chapter 4 Traffic Analysis PURPOSE The traffic analysis component of the K-68 Corridor Management Plan incorporates information on the existing transportation network, such as traffic volumes and intersection
TRAFFIC IMPACT STUDY And A TRAFFIC SIGNAL WARRANT ANALYSIS FOR A SENIOR LIVING AND APARTMENT DEVELOPMENT
 TRAFFIC IMPACT STUDY And A TRAFFIC SIGNAL WARRANT ANALYSIS FOR A SENIOR LIVING AND APARTMENT DEVELOPMENT DEERFIELD TOWNSHIP, WARREN COUNTY, OHIO Nantucket Circle and Montgomery Road () Prepared for: ODLE
4. ENVIRONMENTAL IMPACT ANALYSIS 9. TRANSPORTATION AND TRAFFIC
 4. ENVIRONMENTAL IMPACT ANALYSIS 9. TRANSPORTATION AND TRAFFIC 4.9.1 INTRODUCTION The following section addresses the Proposed Project s impact on transportation and traffic based on the Traffic Study
Traffic Circulation Study for Neighborhood Southwest of Mockingbird Lane and Airline Road, Highland Park, Texas
 ARIZONA TEXAS NEW MEXICO OKLAHOMA February 13, 2015 Mr. Meran Dadgostar P.E., R.S. Town of Highland Park 4700 Drexel Dr. Highland Park, Texas 75205 Re: Traffic Circulation Study for Neighborhood Southwest
TRAFFIC IMPACT STUDY COMPREHENSIVE UPDATE TOWN OF THOMPSON S STATION, TENNESSEE PREPARED FOR: THE TOWN OF THOMPSON S STATION
 TRAFFIC IMPACT STUDY COMPREHENSIVE UPDATE TOWN OF THOMPSON S STATION, TENNESSEE PREPARED FOR: THE TOWN OF THOMPSON S STATION Transportation Consultants, LLC 1101 17 TH AVENUE SOUTH NASHVILLE, TN 37212
Evaluation of M-99 (Broad Street) Road Diet and Intersection Operational Investigation
 Road Diet and Intersection Operational Investigation") Evaluation of M-99 (Broad Street) Road Diet and Intersection Operational Investigation City of Hillsdale, Hillsdale County, Michigan June 16, 2016 Final Report Prepared for City of Hillsdale 97 North Broad
Evaluation of M-99 (Broad Street) Road Diet and Intersection Operational Investigation City of Hillsdale, Hillsdale County, Michigan June 16, 2016 Final Report Prepared for City of Hillsdale 97 North Broad
Shockoe Bottom Preliminary Traffic and Parking Analysis
 Shockoe Bottom Preliminary Traffic and Parking Analysis Richmond, Virginia August 14, 2013 Prepared For City of Richmond Department of Public Works Prepared By 1001 Boulders Pkwy Suite 300, Richmond, VA
Traffic Impact Study WestBranch Residential Development Davidson, NC March 2016
 Traffic Impact Study WestBranch Residential Development Davidson, NC March 216 TRAFFIC IMPACT STUDY FOR THE WestBranch Residential Development LOCATED IN DAVIDSON, NC Prepared For: Lennar Carolinas, LLC
Planning Committee STAFF REPORT March 7, 2018 Page 2 of 4 The following MTSOs are being used across the five subregions: Intersection Level of Service
 Planning Committee STAFF REPORT Meeting Date: March 7, 2018 Subject Summary of Issues Recommendations Financial Implications Options Attachments Changes from Committee Review Draft 2017 Multimodal Transportation
5.16 TRAFFIC AND CIRCULATION
 5.16 TRAFFIC AND CIRCULATION This section is based upon the Tierra Robles Traffic Impact Study (May 2015) and Supplemental Traffic Impact Analysis (August 2017) prepared by Omni-Means Engineering Solutions,
List of Attachments. Location Map... Site Plan... City of Lake Elsinore Circulation Element... City of Lake Elsinore Roadway Cross-Sections...
 List of Attachments Exhibits Location Map... Site Plan... City of Lake Elsinore Circulation Element... City of Lake Elsinore Roadway Cross-Sections... Existing Lane Geometry and Traffic Controls... Existing
Lincoln Avenue Road Diet Trial
 Lincoln Avenue Road Diet Trial Data Collection Report June 1, 2015 Department of Transportation Table of Contents I. Introduction...... 3 II. Data Collection Methodology & Results...... 5 A. Traffic Volume
Bridge Street Corridor Study Report
 Bridge Street Corridor Study Report Prepared for: Prepared by: BRIDGE STREET CORRIDOR STUDY REPORT PREPARED FOR: CITY OF ARROYO GRANDE COMMUNITY DEVELOPMENT DEPARTMENT 300 EAST BRANCH STREET ARROYO GRANDE,
METHODOLOGY. Signalized Intersection Average Control Delay (sec/veh)
") Chapter 5 Traffic Analysis 5.1 SUMMARY US /West 6 th Street assumes a unique role in the Lawrence Douglas County transportation system. This principal arterial street currently conveys commuter traffic
Chapter 5 Traffic Analysis 5.1 SUMMARY US /West 6 th Street assumes a unique role in the Lawrence Douglas County transportation system. This principal arterial street currently conveys commuter traffic
Abrams Associates. Transportation Impact Analysis. City of Rocklin. Prepared for: David Mohlenbrok City of Rocklin 4081 Alvis Court Rocklin, CA 95677
 Transportation Impact Analysis Sierra College Boulevard Commercial Project City of Rocklin Prepared for: David Mohlenbrok City of Rocklin 081 Alvis Court Rocklin, CA 95677 Prepared by: 1875 Olympic Boulevard,
D.13 Transportation and Traffic
 This section addresses transportation and traffic issues and impacts related to the Proposed Project. Section D.13.1 provides a description of the affected environment for the Proposed Project. Applicable
Lyons Avenue/Dockweiler Road Extension Project Draft Environmental Impact Report. Appendix I Traffic Impact Study
 Lyons Avenue/Dockweiler Road Extension Project Draft Environmental Impact Report Appendix I Traffic Impact Study Street 0 80-1947 500.4501 RITA ld Court 0 91355-1096 400.7401 LA n Avenue 0 590-3745 300-9301
TRAFFIC ASSESSMENT River Edge Colorado
 TRAFFIC ASSESSMENT River Edge Colorado Submitted by: Fehr & Peers 621 17th Street, Ste. 231 Denver, CO 8293 (33) 296-43 December, 21 App. M-2 Traffic Assessment River Edge Colorado December 21 TABLE OF
3.9 - Transportation and Traffic
 Transportation and Traffic 3.9 - Transportation and Traffic This section describes the potential transportation and traffic effects of project implementation on the project site and its surrounding area.
Waterford Lakes Small Area Study
 Waterford Lakes Small Area Study Existing Traffic Conditions PREPARED FOR: ORANGE COUNTY PUBLIC WORKS DEPARTMENT TRAFFIC ENGINEERING DIVISION ORLANDO, FLORIDA PREPARED WITH: INWOOD CONSULTING ENGINEERS
Clay Street Realignment Project Traffic Study
 Final Clay Street Realignment Project Traffic Study November 24, 2009 Prepared for: City of Placerville RS07-2466 2990 Lava Ridge Court, Suite 200 Roseville, CA 95661 (916) 773-1900 Fax (916) 773-2015
Highway 111 Corridor Study
 Highway 111 Corridor Study June, 2009 LINCOLN CO. HWY 111 CORRIDOR STUDY Draft Study Tea, South Dakota Prepared for City of Tea Sioux Falls Metropolitan Planning Organization Prepared by HDR Engineering,
APPENDIX F SUPPLEMENTAL TRAFFIC DATA
 APPENDIX F SUPPLEMENTAL TRAFFIC DATA Environmental and Planning Consultants 440 Park Avenue South 7th Floor New York, NY 10016 tel: 212 696-0670 fax: 212 213-3191 www.akrf.com Draft Memorandum To: Michael
OFFICE/RETAIL DEVELOPMENT 1625 BANK STREET OTTAWA, ONTARIO TRANSPORTATION BRIEF. Prepared for: Canada Inc.
 OFFICE/RETAIL DEVELOPMENT 1625 BANK STREET OTTAWA, ONTARIO TRANSPORTATION BRIEF Prepared for: 9402209 Canada Inc. December 15, 2015 115-625 Report_2.doc D. J. Halpenny & Associates Ltd. Consulting Transportation
INDUSTRIAL BUILDING 3009 HAWTHORNE ROAD CITY OF OTTAWA TRANSPORTATION OVERVIEW REVISED. Prepared for: Canada Inc.
 INDUSTRIAL BUILDING 3009 HAWTHORNE ROAD CITY OF OTTAWA TRANSPORTATION OVERVIEW REVISED Prepared for: 7849648 Canada Inc. Octiober 1, 2015 114-598 Overview_2.doc D. J. Halpenny & Associates Ltd. Consulting
Walmart (Store # ) 60 th Street North and Marion Road Sioux Falls, South Dakota
 60 th Street North and Marion Road Sioux Falls, South Dakota") Walmart (Store #4865-00) 60 th Street North and Marion Road Sioux Falls, South Dakota Prepared for: Wal-Mart Stores, Inc. Bentonville, Arkansas Prepared by: Kimley-Horn and Associates, Inc. ã2013 Kimley-Horn
Walmart (Store #4865-00) 60 th Street North and Marion Road Sioux Falls, South Dakota Prepared for: Wal-Mart Stores, Inc. Bentonville, Arkansas Prepared by: Kimley-Horn and Associates, Inc. ã2013 Kimley-Horn
4.12 TRANSPORTATION Executive Summary. Setting
 4.12 TRANSPORTATION 4.12.1 Executive Summary This section is based on the Multimodal Transportation Impact Study (TIS; 2016) prepared by Omni-Means, Ltd. to evaluate projected transportation impact conditions
THIS PAGE LEFT BLANK INTENTIONALLY
 GA SR 25 Spur at Canal Road Transportation Impact Analysis PREPARED FOR GLYNN COUNTY, GEORGIA 1725 Reynolds Street, Suite 300 Brunswick, Georgia 31520 PREPARED BY 217 Arrowhead Boulevard Suite 26 Jonesboro,
TECHNICAL MEMORANDUM
 TECHNICAL MEMORANDUM DATE: January 17, 2005 TO: Ted Idlof, URS FROM: Jeff Clark, Fehr & Peers RE: U.S. 50 Interchange Planning Study 1042-2011 This memorandum describes conceptual improvements for the
REDEVELOPMENT TRAFFIC IMPACT STUDY
 REDEVELOPMENT TRAFFIC IMPACT STUDY For Wendy s Parker, Colorado January 215 Prepared for: Sterling Design Associates, LLC 29 W. Littleton Boulevard #3 Littleton, Colorado 812 Prepared by: 1233 Airport
Truck Climbing Lane Traffic Justification Report
 ROUTE 7 (HARRY BYRD HIGHWAY) WESTBOUND FROM WEST MARKET STREET TO ROUTE 9 (CHARLES TOWN PIKE) Truck Climbing Lane Traffic Justification Report Project No. 6007-053-133, P 101 Ι UPC No. 58599 Prepared by:
Roundabout Feasibility Memorandum
 Roundabout Feasibility Memorandum To From Gwen Pipkin Bill Howell Date June 18, 2013 Subject Roundabout Feasibility Study SR 29 PD&E Study From Oil Well Road to SR 82 Collier County, FL FPID 417540-1-22-01
3.0 PROJECT DESCRIPTION
 The following section of the Draft EIR contains a description of the proposed Elk Grove Boulevard/SR 99 Interchange Modification project, consistent with the requirements of CEQA Guidelines Section 15124.
Existing Conditions. Date: April 16 th, Dan Holderness; Coralville City Engineer Scott Larson; Coralville Assistant City Engineer
 Date: April 16 th, 2015 To: From: Re: Dan Holderness; Coralville City Engineer Scott Larson; Coralville Assistant City Engineer Darian Nagle-Gamm, Traffic Engineering Planner Highway 6 (2 nd Street) /
133 rd Street and 132 nd /Hemlock Street 132 nd Street and Foster Street MINI ROUNDABOUTS. Overland Park, Kansas
 133 rd Street and 132 nd /Hemlock Street 132 nd Street and Foster Street MINI ROUNDABOUTS Overland Park, Kansas September 1, 2017 TABLE OF CONTENTS 1. INTRODUCTION... 1 2. LITERATURE REVIEW... 1 3. CONCEPT
Multimodal Through Corridors and Placemaking Corridors
 68 Multimodal Through Corridors and Placemaking Corridors Corridors have different functions in a region. Some corridors are used to get smoothly and rapidly through a region or to get quickly to major
HILTON GARDEN INN HOTEL HOTEL EXPANSION 2400 ALERT ROAD, OTTAWA TRANSPORTATION BRIEF. Prepared for:
 HILTON GARDEN INN HOTEL HOTEL EXPANSION 2400 ALERT ROAD, OTTAWA TRANSPORTATION BRIEF Prepared for: Bona Building & Management Co. Ltd. Place Vanier, 333 North River Road Vanier, Ontario K1L 8B9 October
M-58 HIGHWAY ACCESS MANAGEMENT STUDY Mullen Road to Bel-Ray Boulevard. Prepared for CITY OF BELTON. May 2016
 M-58 HIGHWAY ACCESS MANAGEMENT STUDY Prepared for CITY OF BELTON By May 2016 Introduction Missouri State Highway 58 (M-58 Highway) is a major commercial corridor in the City of Belton. As development has
FAIRFIELD INN & SUITES HOTEL 135 THAD JOHNSON PRIVATE OTTAWA TRANSPORTATION BRIEF. Prepared for:
 FAIRFIELD INN & SUITES HOTEL 135 THAD JOHNSON PRIVATE OTTAWA TRANSPORTATION BRIEF Prepared for: Bona Building & Management Co. Ltd. Place Vanier, 333 North River Road Vanier, Ontario K1L 8B9 August 12,
Harrah s Station Square Casino
 Transportation Analysis Harrah s Station Square Casino Pittsburgh, Pennsylvania Submitted To: City of Pittsburgh and Pennsylvania Gaming Control Board Prepared By: DKS Associates GAI Consultants December
Traffic Impact Study. Roderick Place Columbia Pike Thompson s Station, TN. Transportation Group, LLC Traffic Engineering and Planning
 F i s c h b a c h Transportation Group, LLC Traffic Engineering and Planning Traffic Impact Study Roderick Place Columbia Pike Thompson s Station, TN Prepared March 2016 Ms. Gillian L. Fischbach, P.E.,
Gateway Transportation Study
 Gateway Transportation Study Amherst, Massachusetts SUBMITTED TO University of Massachusetts Amherst Town of Amherst SUBMITTED BY Vanasse Hangen Brustlin, Inc. Watertown, Massachusetts March 213 Back of
Traffic Study of Fuller Street, Cady Street, West Street and West Avenue. Final Report
 Traffic Study of Fuller Street, Cady Street, West Street and West Avenue Final Report July 2005 Prepared for: Town of Ludlow Prepared by: Pioneer Valley Planning Commission 26 Central Street West Springfield,
TRAFFIC STUDY GUIDELINES Clarksville Street Department
 TRAFFIC STUDY GUIDELINES Clarksville Street Department 9/1/2009 Introduction Traffic studies are used to help the city determine potential impacts to the operation of the surrounding roadway network. Two
Chapter 16: Traffic and Parking A. INTRODUCTION
 Chapter 6: Traffic and Parking A. ITRODUCTIO This chapter examines the potential traffic and parking impacts of the proposed Fresh Kills Park roads. The analysis of transit and pedestrians is presented
FINAL DESIGN TRAFFIC TECHNICAL MEMORANDUM
 FINAL DESIGN TRAFFIC TECHNICAL MEMORANDUM July 2014 FINAL (SR 43) Project Development and Environment Study From State Road 60 (Adamo Drive) to I-4 (SR 400) Hillsborough County, Florida Work Program Item
ALLEY 24 TRAFFIC STUDY
 ALLEY 24 TRAFFIC STUDY in City of Frostburg, Maryland January 2013 3566 Teays Valley Road Hurricane, WV Office: (304) 397-5508 www.denniscorporation.com Alley 24 Traffic Study January 2013 Frostburg, Maryland
5858 N COLLEGE, LLC N College Avenue Traffic Impact Study
 5858 N COLLEGE, LLC nue Traffic Impact Study August 22, 2016 Contents Traffic Impact Study Page Preparer Qualifications... 1 Introduction... 2 Existing Roadway Conditions... 5 Existing Traffic Conditions...
Figure 1: East West Connector Alignment Alternatives Concept Drawing
 Page 2 of 9 Figure 1: East West Connector Alignment Alternatives Concept Drawing The Montebello Drive extension will run north south and connect Wilsonville Road to the Boones Ferry Road to Brown Road
TABLE TRAFFIC ANALYSIS SCENARIOS
 4.11 TRANSPORTATION The potential traffic impacts of the proposed project are evaluated in the Buena Park Beach/Orangethorpe Mixed Use Project Traffic Analysis (Traffic Analysis) by Austin-Foust Associates
STILLWATER AVENUE CORRIDOR STUDY Old Town, Maine
 Draft Study STILLWATER AVENUE CORRIDOR STUDY Old Town, Maine SUBMITTED TO: BANGOR AREA COMPREHENSIVE TRANSPORTATION SYSTEM SUBMITTED BY: I MAY 23, 2017 DRAFT STILLWATER AVENUE STUDY FINAL REPORT Table
5.3 TRAFFIC, CIRCULATION AND PARKING
 5.3 TRAFFIC, CIRCULATION AND PARKING This section is based upon the Downtown Lancaster Specific Plan Traffic Impact Analysis (April 2, 2008) and the Downtown Lancaster Specific Plan Parking Analysis (May
TRAFFIC IMPACT STUDY CRITERIA
 Chapter 6 - TRAFFIC IMPACT STUDY CRITERIA 6.1 GENERAL PROVISIONS 6.1.1. Purpose: The purpose of this document is to outline a standard format for preparing a traffic impact study in the City of Steamboat
SECTION 1 - TRAFFIC PLANNING
 SECTION 1 - TRAFFIC PLANNING 1.1 TRAFFIC OPERATIONS 1.1.1 Roadway Functional Classification The Multnomah County Comprehensive Framework Plan s Policy 34: Trafficways and the Functional Classification
Glenn Avenue Corridor Traffic Operational Evaluation
 Glenn Avenue Corridor Traffic Operational Evaluation PREPARED FOR: THE CITY OF AUBURN PREPARED BY: DECEMBER 2007 Glenn Avenue Corridor Study--Auburn, Alabama TABLE OF CONTENTS Introduction... 1 Background
Magnolia Place. Traffic Impact Analysis. Prepared for: City of San Mateo. Prepared by: Hexagon Transportation Consultants, Inc.
 Magnolia Place Traffic Impact Analysis Prepared for: City of San Mateo Prepared by: Hexagon Transportation Consultants, Inc. Updated January 4, 2010 Table of Contents 1. Introduction...1 2. Existing Conditions...6
Appendix B: Forecasting and Traffic Operations Analysis Framework Document
 Existing Conditions Report - Appendix Appendix B: Forecasting and Traffic Operations Analysis Framework Document This document defines the methodology and assumptions that will be used in the traffic forecasting
Henderson Avenue Mixed-Use Development
 Zoning Case: Z145-3 Traffic Impact Analysis Henderson Avenue Mixed-Use Development Dallas, TX October 26 th, 216 Kimley-Horn and Associates, Inc. Dallas, Texas Project #644827 Registered Firm F-928 Traffic
Grant Avenue Streetscape
 REPORT TYPE GOES HERE Grant Avenue Streetscape PREPARED FOR City of Manassas 9027 Center Street Manassas, VA 20110 PREPARED BY 8300 Boone Boulevard Suite 700 Vienna, Virginia 22182 571.389.8121 July 31,
Capital Region Council of Governments
 March 23, 2018 Capital Region Council of Governments PROJECT CONCEPT REPORT Realignment of Swamp and Northfield Road s approaches to Route 44 (Boston Turnpike) Town of Coventry SUMMARY: The Town of Coventry
MEDICAL/OFFICE BUILDING 1637 BANK STREET OTTAWA, ONTARIO TRANSPORTATION OVERVIEW. Prepared for:
 MEDICAL/OFFICE BUILDING 1637 BANK STREET OTTAWA, ONTARIO TRANSPORTATION OVERVIEW Prepared for: 2434984 Ontario Inc. 13-5510 Canotek Road Ottawa, Ontario K1J 9J5 June 4, 2015 115-613 Report_2.doc D. J.
DOWNTOWN TUPELO MAIN STREET: ROAD DIET STUDY
 DOWNTOWN TUPELO MAIN STREET: ROAD DIET STUDY Since mid-2009, RPM Transportation Consultants (RPM) has worked with the Downtown Tupelo Main Street Association to evaluate traffic conditions and potential
Traffic Impact Study for Rolling Ridge Redevelopment
 Traffic Impact Study for Rolling Ridge Redevelopment Webster Groves, Missouri October 19, 2018 Prepared For: Gershman Commercial Real Estate 150 North Meramec Avenue Suite 500 St. Louis, Missouri 63105
J Street and Folsom Boulevard Lane Conversion Project (T ) Before and After Traffic Evaluation
 Before and After Traffic Evaluation") J Street and Folsom Boulevard Lane Conversion Project (T15125400) Before and After Traffic Evaluation Prepared by Transportation Division June 2014 Executive Summary On February 12, 2013, the City of Sacramento
J Street and Folsom Boulevard Lane Conversion Project (T15125400) Before and After Traffic Evaluation Prepared by Transportation Division June 2014 Executive Summary On February 12, 2013, the City of Sacramento
Traffic Study North Shore School District 112
 Traffic Study North Shore School District 112 Proposed Expansion of Northwood Junior High School Prepared By: May 1, 2015 1. Introduction Kenig, Lindgren, O Hara, Aboona, Inc. (KLOA, Inc.) has been retained
Subject: Solberg Avenue / I-229 Grade Separation: Traffic Analysis
 MEMORANDUM Transportation Bill Troe, AICP Jason Carbee, AICP 12120 Shamrock Plaza Suite 300 Omaha, NE 68154 (402) 334-8181 (402) 334-1984 (Fax) To: Project File Date: Subject: Solberg Avenue / I-229 Grade
MEETING FACILITY 2901 GIBFORD DRIVE CITY OF OTTAWA TRANSPORTATION BRIEF. Prepared for: Holiday Inn Express 2881 Gibford Drive Ottawa, ON K1V 2L9
 MEETING FACILITY 2901 GIBFORD DRIVE CITY OF OTTAWA TRANSPORTATION BRIEF Prepared for: Holiday Inn Express 2881 Gibford Drive Ottawa, ON K1V 2L9 December 18, 2012 112-566 Brief_1.doc D. J. Halpenny & Associates
EAST AND SOUTH STREET CITY OF ANAHEIM, CALIFORNIA
 T R A F F I C I M P A C T A N A LY S I S EAST AND SOUTH STREET CITY OF ANAHEIM, CALIFORNIA April 217 T R A F F I C I M P A C T A N A LY S I S EAST AND SOUTH STREET CITY OF ANAHEIM, CALIFORNIA Submitted
INDUSTRIAL BUILDING 1660 COMSTOCK ROAD CITY OF OTTAWA TRANSPORTATION OVERVIEW. Prepared for:
 INDUSTRIAL BUILDING 1660 COMSTOCK ROAD CITY OF OTTAWA TRANSPORTATION OVERVIEW Prepared for: Simluc Contractors Limited 2550 Blackwell Street, Ottawa K1B 5R1 October 18, 2013 113-584 Overview_1.doc D. J.
Table of Contents FIGURES TABLES APPENDICES. Traffic Impact Study Hudson Street Parking Garage MC Project No.: A Table of Contents
 Traffic Impact Study Hudson Street Parking Garage MC Project No.: 151714A Table of Contents Table of Contents I. INTRODUCTION... 2 II. EXISTING CONDITIONS... 5 III. 215 EXISTING TRAFFIC CONDITIONS... 6
Traffic Impact Study. Westlake Elementary School Westlake, Ohio. TMS Engineers, Inc. June 5, 2017
 TMS Engineers, Inc. Traffic Impact Study Westlake Elementary School Westlake, Ohio June 5, 2017 Prepared for: Westlake City Schools - Board of Education 27200 Hilliard Boulevard Westlake, OH 44145 TRAFFIC
TRAFFIC OPERATIONS ANALYSIS REPORT. Pacheco Boulevard Alignment Study and Alternatives Analysis
 TRAFFIC OPERATIONS ANALYSIS REPORT Pacheco Boulevard Alignment Study and Alternatives Analysis PREPARED FOR: CITY OF MARTINEZ AND CONTRA COSTA COUNTY OCTOBER 2016 FINAL REPORT Prepared By: under contract
CarMax Auto Superstore/ Reconditioning Center #6002 Murrieta, California
 CarMax Auto Superstore/ Reconditioning Center #6002 Murrieta, California TUSTIN 17782 17th Street Suite 200 Tustin, CA 92780-1947 714.665.4500 Fax: 714.665.4501 LOS ANGELES 145 S. Spring Street Suite 120
Defining Purpose and Need
 Advanced Design Flexibility Pilot Workshop Session 4 Jack Broz, PE, HR Green May 5-6, 2010 Defining Purpose and Need In your agency s project development process, when do design engineers typically get
Caltrans Sloat Boulevard Pedestrian Safety Project Response to Community Questions, Comments & Concerns
 Caltrans Sloat Boulevard Pedestrian Safety Project Response to Community Questions, Comments & Concerns Revised: May 10, 2016 The California Department of Transportation (Caltrans) is planning various
Project Development & Environment (PD&E) Study. November 17, SR 90 (SW 8th Street and SW 7th Street) SW 8 th Street/SW 7 th Street PD&E Study 1
 Study. November 17, SR 90 (SW 8th Street and SW 7th Street) SW 8 th Street/SW 7 th Street PD&E Study 1") Financial Management Number: 432639-6-22-01 Federal Aid Project Number: 0202-054-P Efficient Transportation Decision Making Number: 14230 Project Development & Environment (PD&E) Study SR 90 (SW 8th Street
Financial Management Number: 432639-6-22-01 Federal Aid Project Number: 0202-054-P Efficient Transportation Decision Making Number: 14230 Project Development & Environment (PD&E) Study SR 90 (SW 8th Street
REVIEW OF LOCAL TRAFFIC FLOW / LONG RANGE PLANNING SOLUTIONS STUDY
 ITEM Town of Atherton TRANSPORTATION COMMITTEE STAFF REPORT TO: FROM: MEMBERS OF THE COMMITTEE ROBERT OVADIA, PUBLIC WORKS DIRECTOR DATE: FEBRUARY 12, 2019 SUBJECT: REVIEW OF LOCAL TRAFFIC FLOW / LONG
Transportation Impact Study for Abington Terrace
 Transportation Impact Study for Abington Terrace Abington Township, Montgomery County, PA Sandy A. Koza, P.E., PTOE PA PE License Number PE059911 Prepared by McMahon Associates, Inc. 425 Commerce Drive,
Highway 49, Highway 351 and Highway 91 Improvements Feasibility Study Craighead County
 Highway 49, Highway 351 and Highway 91 Improvements Feasibility Study Craighead County Executive Summary March 2015 Highway 49, Highway 351 and Highway 91 Improvements Feasibility Study Craighead County
DRAFT. Corridor study. Honeysuckle Road. October Prepared for the City of Dothan, AL. Prepared by Gresham, Smith and Partners
 DRAFT Corridor study Honeysuckle Road October 2017 Prepared for the City of Dothan, AL Prepared by TABLE OF CONTENTS SECTION I... 1 STUDY SUMMARY... 1 INTRODUCTION... 1 CONCLUSIONS... 5 SECTION II... 7
Traffic Impact Study Little Egypt Road Development Denver, North Carolina June 2017
 Traffic Impact Study Little Egypt Road Development Denver, North arolina June 2017 N. Little Egypt Road DQ\ QDQFLQJ VDOHV RU RWKHU SHUIRUPDQFH EDVHG FULWHULD Proposed Site Driveways Site Driveway 1 TRAFFI
Traffic Analysis and Design Report. NW Bethany Boulevard. NW Bronson Road to NW West Union Road. Washington County, Oregon
 Traffic Analysis and Design Report NW Bethany Boulevard NW Bronson Road to NW West Union Road Washington County, Oregon May 2011 Table of Contents Table of Contents Section 1 Executive Summary... 2 Section
DEPARTMENT OF ENVIRONMENTAL SERVICES. North Harrison Street (Lee Highway to Little Falls Road) Comparative Analysis. Prepared for:
 Comparative Analysis. Prepared for:") DEPARTMENT OF ENVIRONMENTAL SERVICES North Harrison Street (Lee Highway to Little Falls Road) Comparative Analysis Prepared for: Arlington County Department of Environmental Services 2100 Clarendon Boulevard,
DEPARTMENT OF ENVIRONMENTAL SERVICES North Harrison Street (Lee Highway to Little Falls Road) Comparative Analysis Prepared for: Arlington County Department of Environmental Services 2100 Clarendon Boulevard,
TRAFFIC IMPACT STUDY. Creekside Thornton, Colorado. For. August 2015 November 2015 Revised: August Prepared for:
 TRAFFIC IMPACT STUDY For Creekside Thornton, Colorado August 215 November 215 Revised: August 216 Prepared for: Jansen Strawn Consulting Engineers 45 West 2 nd Avenue Denver, Colorado 8223 Prepared by:
Route 7 Corridor Study
 Route 7 Corridor Study Executive Summary Study Area The following report analyzes a segment of the Virginia State Route 7 corridor. The corridor study area, spanning over 5 miles in length, is a multi
MEMORANDUM. Charlotte Fleetwood, Transportation Planner
 MEMORANDUM Date: Updated August 22, 2017 To: Organization: Charlotte Fleetwood, Transportation Planner Boston Transportation Department From: Jason DeGray, P.E., PTOE, Regional Director of Engineering
9 Leeming Drive Redevelopment Ottawa, ON Transportation Brief. Prepared By: Stantec Consulting Ltd.
 9 Leeming Drive Redevelopment Ottawa, ON Transportation Brief Prepared By: Stantec Consulting Ltd. TIA GUIDELINES CHECKLIST Report Context Municipal Address Comment: Section 1.1 Location relative to major
DIMARCO CANANDAIGUA PROPERTIES HOUSING PROJECT CANANDAIGUA, ONTARIO COUNTY, NEW YORK
 TRAFFIC IMPACT STUDY FOR THE DIMARCO CANANDAIGUA PROPERTIES HOUSING PROJECT CANANDAIGUA, ONTARIO COUNTY, NEW YORK MARCH 14, 2017 PREPARED FOR: 1950 Brighton Henrietta Town Line Rd Rochester, NY 14623 PREPARED
EXECUTIVE SUMMARY. Page 1 of 6
 EXECUTIVE SUMMARY The purpose of this report is to identify conformance with the original traffic impact study for the proposed retail development on Lot 5 of Riverdale Retail Filing No. 1 located on the
CITY OF ALPHARETTA DOWNTOWN MASTER PLAN TRAFFIC EVALUATION
 CITY OF ALPHARETTA DOWNTOWN MASTER PLAN TRAFFIC EVALUATION June 2015 CITY OF ALPHARETTA DOWNTOWN MASTER PLAN TRAFFIC EVALUATION Introduction The Alpharetta Downtown Master Plan was developed in the fall