Water industry perspective on the main groundwater management challenges. Luke de Vial Head of Water Resources and Supply
|
|
|
- Gavin Green
- 5 years ago
- Views:
Transcription

1
2 Water industry perspective on the main groundwater management challenges Luke de Vial Head of Water Resources and Supply 2
3 Key 3
4 Natural History Museum Key Sources at risk from exceeding nitrate limits Water supply and sewerage services area Sewerage services only Water supply services only 4
5 Advantages of groundwater All being well groundwater provides Storage of water Clean water Low cost Low carbon 5
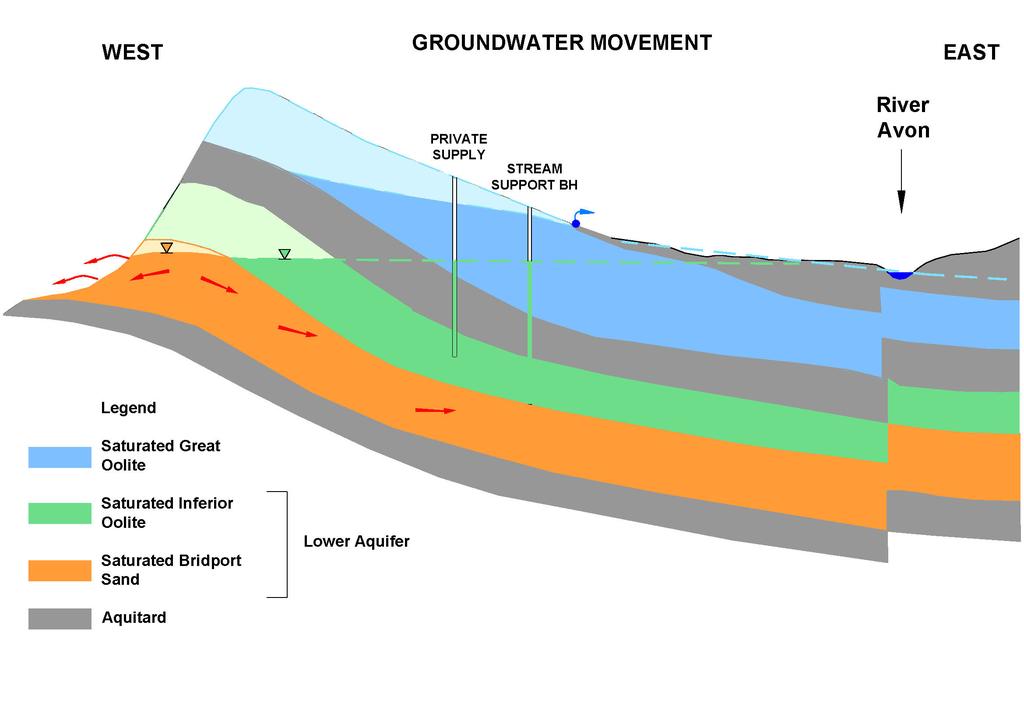
6 Management of groundwater Storage How much storage How do we manage our abstractions Relationship with river flows Clean Is it? Can we clean it up? 6
7 Groundwater storage 1km 2 10m thick 1% porosity 100 Ml 10km 2 10m thick 1% porosity 1000 Ml 50km 2 10m thick 1% porosity 5,000 Ml 1km 2 10m deep 100% porosity 10,000 Ml 7
8 Groundwater storage 1km 2 10m thick 1% porosity 100 Ml 10km 2 10m thick 1% porosity 1000 Ml 50km 2 10m thick 1% porosity 5,000 Ml 1km 2 10m deep 100% porosity 10,000 Ml 8
9 AQUIFER AQUICLUDE 9
10 AQUICLUDE AQUICLUDE 10
11 AQUICLUDE AQUICLUDE 11
12 Storage management Purpose of storage management Maximise yield Minimise impact on river flows 12
13 Maximise groundwater yield Use it or loose it A reservoir 13
14 Use it or lose it AQUIFER AQUICLUDE 14
15 Source output Ml/d Maximum source output for a given groundwater level Regional groundwater level (maod) 15
16 AQUICLUDE AQUICLUDE 16

17 17

18 Recharge Storage Base flows / overflows 18

19 19
20 Observed Model 20
21 Manage the groundwater Predict how much water we can take out through the year Cut back in winter to save for summer use Tough call if source is low cost 21
22 Minimise impact on river flows Distance from river T S Drawdown is good 22

23 23
24 Difficult slide ML/d Increase in Abstraction Rate (above 2 ML/d) Reduction in River Flow at South Newton PAYBACK -15 Jan 03 Feb 03 Mar 03 Apr 03 May 03 Jun 03 Jul 03 Aug 03 Sep 03 Oct 03 Nov 03 Dec 03 24
25 Simulated River Flow at South Newton Chitterne at 2 Ml/d PAYBACK Actual Chitterne Usage 25 Flow (ML/d) Jan 03 Jan 03 Feb 03 Mar 03 Mar 03 Apr 03 May 03 May 03 Jun 03 Jul 03 Jul 03 Aug 03 Sep 03 Sep 03 Oct 03 Nov 03 Nov 03 Dec 03
26 How far can we push this storage concept? Malmesbury 26
27
28
29
30
31 Clean water 31
32 Pollution Nitrate Concentrations at Diversbridge (mg/l N) 16 Diversbridge Raw Sps 14 Nitrate Concentration (mg/l N) Trend for Average of All Data 99.9%ile Peak Trend line 99%ile Peak Trend line 2 95%ile Peak Trend line Average for previous
33 Pollution Nitrate Concentrations at Shepherds Shore (mg/l N) 30 Shepherds Shore Bh 1 Shepherds Shore Bh 2 25 Shepherds Shore Trtd Nitrate Concentration (mg/l N) Trend for Average of All Data 99.9%ile Peak Trend line 5 99%ile Peak Trend line 95%ile Peak Trend line Average for previous
34 Pollution Nitrate Concentrations at Goodshill (mg/l N) 25 Goodshill Raw B/H 20 Nitrate Concentration (mg/l N) Trend for Average of All Data 99.9%ile Peak Trend line 5 99%ile Peak Trend line 95%ile Peak Trend line Average for previous
35 Pollution Nitrate Concentrations at Bradley Head (mg/l N) 25 Bradley Head 1 Raw Bradley Head 2 Raw Bradley Head Treated 20 Nitrate Concentration (mg/l N) Trend for Average of All Data 99.9%ile Peak Trend line 5 99%ile Peak Trend line 95%ile Peak Trend line Average for previous
36 Pollution Nitrate Concentrations at Milborne Wick (mg/l N) 20 Milborne Wick Bh Milborne Wick Bh2 Milborne Wick Treatd Nitrate Concentration (mg/l N) Trend for Average of All Data 99.9%ile Peak Trend line %ile Peak Trend line 95%ile Peak Trend line Average for previous
37 Pollution Nitrate Concentrations at Chirton (mg/l N) 16 Chirton B/H 4 Trt Chirton Bh No1 Raw 14 Chirton Bh No2 Raw Nitrate Concentration (mg/l N) Chirton Mixed Trtd Chirton No2 B/H Trtd Chirton No3 B/H Trtd Chirton Raw B/H 3 Chirton Raw Bh2 Chirton Raw Mxd B/Hs Trend for Average of All Data 99.9%ile Peak Trend line 99%ile Peak Trend line 2 95%ile Peak Trend line Average for previous
38 Pollution Nitrate Concentrations at Dunkerton (mg/l N) 18 Dunkerton Raw Sprgs 16 Dunkerton Trtd Nitrate Concentration (mg/l N) Trend for Average of All Data 99.9%ile Peak Trend line 99%ile Peak Trend line 2 95%ile Peak Trend line Average for previous
39 Pollution Nitrate Concentrations at Deans Farm (mg/l N) 16 Deans Farm Bh1 Deans Farm Bh2 14 Deans Farm Bh3 Nitrate Concentration (mg/l N) Deans Farm Raw Deans Farm Trtd_ Trend for Average of All Data 99.9%ile Peak Trend line 99%ile Peak Trend line 2 95%ile Peak Trend line Average for previous
40 Pollution Nitrate Concentrations at Bulbridge (mg/l N) 16 Bulbridge Raw Bulbridge Trtd_ 14 Nitrate Concentration (mg/l N) Trend for Average of All Data 99.9%ile Peak Trend line 99%ile Peak Trend line 2 95%ile Peak Trend line Average for previous
41 Pollution Nitrate Concentrations at Wylye (mg/l N) 18 Wylye 16 Wylye Bh1 Raw Wylye Bh2 Nitrate Concentration (mg/l N) Trend for Average of All Data 99.9%ile Peak Trend line 99%ile Peak Trend line 2 95%ile Peak Trend line Average for previous
42 Pollution Nitrate Concentrations at Belhuish (mg/l N) 16 Belhuish Bh1(Weld)Rw Belhuish Bh2 14 Belhuish Bh3 Raw Nitrate Concentration (mg/l N) Trend for Average of All Data 99.9%ile Peak Trend line 99%ile Peak Trend line 2 95%ile Peak Trend line Average for previous
43 Pollution Nitrate Concentrations at Milborne ST Andrew (mg/l N) 25 Milborne Bh1 Raw Milborne Bh2 Raw Milborne Bh3 Raw 20 Milborne St A No1Trt Nitrate Concentration (mg/l N) Milborne St A No2Trt Trend for Average of All Data 99.9%ile Peak Trend line 5 99%ile Peak Trend line 95%ile Peak Trend line Average for previous
44 Pollution Nitrate Concentrations at Shapwick (mg/l N) 20 Shapwick Shapwick Bh 3 Shapwick Bh1 Shapwick Bh2 Nitrate Concentration (mg/l N) Trend for Average of All Data 99.9%ile Peak Trend line %ile Peak Trend line 95%ile Peak Trend line Average for previous
45 Pollution Nitrate Concentrations at Eagle Lodge (mg/l N) 16 Eagle Lodge Eagle Lodge 2A Trtd 14 Eagle Lodge Bh1 Raw Nitrate Concentration (mg/l N) Eagle Lodge Bh2 Raw Eagle Lodge No1 Trtd Trend for Average of All Data 99.9%ile Peak Trend line 99%ile Peak Trend line 2 95%ile Peak Trend line Average for previous
46 Pollution Nitrate Concentrations at Empool (mg/l N) 16 Empool 1 Trtd Empool 2 Trtd 14 Empool B/H 4 (Raw) Nitrate Concentration (mg/l N) Empool Bh1 Empool Bh2 Empool Bh3 Empool Treated Trend for Average of All Data 99.9%ile Peak Trend line 99%ile Peak Trend line 2 95%ile Peak Trend line Average for previous
47 Pollution Nitrate Concentrations at Winterborne Abbas (mg/l N) 20 W'Borne Abbas Bh W'Borne Abbas Bh2Raw W'Borne Abbas Trtd_ Wntrbrne Abbas Raw Nitrate Concentration (mg/l N) Trend for Average of All Data 99.9%ile Peak Trend line %ile Peak Trend line 95%ile Peak Trend line Average for previous
48 Pollution Nitrate Concentrations at Sturminster Marshall (mg/l N) 16 St Marsh'L Well1 Raw Stur_Marshallbh2 Raw 14 Stur_Marshallbh3 Raw Nitrate Concentration (mg/l N) Stur_Marshallbh4 Raw Trend for Average of All Data 99.9%ile Peak Trend line 99%ile Peak Trend line 2 95%ile Peak Trend line Average for previous
49 Pollution Nitrate Concentrations at Langdon (mg/l N) 35 Langdon Raw Langdon Trtd_ 30 Nitrate Concentration (mg/l N) Trend for Average of All Data 99.9%ile Peak Trend line 99%ile Peak Trend line 5 95%ile Peak Trend line Average for previous
50 Pollution Nitrate Concentrations at Hooke (mg/l N) 18 Hooke Raw 16 Hooke Trtd_ Nitrate Concentration (mg/l N) Trend for Average of All Data 99.9%ile Peak Trend line 99%ile Peak Trend line 2 95%ile Peak Trend line Average for previous

51 Sources at risk of exceeding nitrate limits by 2020 Loss of 43 Ml/d of output in next 5 years 8% of capacity Key Sources at risk from exceeding nitrate limits Water supply and sewerage services area Sewerage services only Water supply services only 51
52 How do we deal with this problem Treatment Blending Solve problem at source 52
53 How long to solve the problem as source Hydrogeologists 53
54 Pollution Nitrate Concentrations at Hooke (mg/l N) 18 Hooke Raw 16 Hooke Trtd_ Nitrate Concentration (mg/l N) Trend for Average of All Data 99.9%ile Peak Trend line 99%ile Peak Trend line 2 95%ile Peak Trend line Average for previous
55 Ashford Reservoir Metaldehyde Levels Metaldehyde (micrograms/litre) 01-Sep Sep Sep Oct Oct Nov Nov Dec Dec Jan Jan Feb Feb Mar Mar Mar-09 Drinking Water Limit (0.1


56 Daily Sample Point FWAG Sample Point New Sample Point Legridge < Neville Farm Wood Hill West <80 Wood Hill E 125 Weston Wood < Wood Hill S 171 Wood Bridge Corscombe Farm <80
57 Conceptual model Nitrate level at time t = Function of historic application of nitrate / thickness of the unsaturated zone + Leachate concentration * function of groundwater level + Leachate concentration * function of recharge 57
58 Good calibration Eagle Lodge Calibration - Step 4 Add Bypass Flow Effect Nitrate Concentration (mg/l N) Drinking Water Standard Site Measured Nitrate 0 Min Long Term Trend (LTT) based on Legacy Nitrate
59 Good Calibration with a Number of Sites Friar Waddon at Step 4 Calibration Nitrate Concentration (mg/l N) Drinking Water Standard Site Measured Nitrate 0 Min Long Term Trend (LTT) based on Legacy Nitrate
60 Whoops! Dunkerton at Step Nitrate Concentration (mg/l N) Greensand Source so different unsat zone porosity and likely delayed flow and possible stratification in saturated zone Drinking Water Standard Note: No bypass flow predicted by recharge model 2 Site Measured Nitrate 0 Min Long Term Trend (LTT) based on Legacy Nitrate
61 But Generally Good for Chalk Sources Chirton at Step Nitrate Concentration (mg/l N) Drinking Water Standard Site Measured Nitrate 0 Min Long Term Trend (LTT) based on Legacy Nitrate
62 Modelled Scenarios Scenario 1 nitrate leaching at 2006/7 rates Scenario 3 nitrate leaching reduced to 50% of 2006/7 rates Scenario 2 nitrate leaching reduced to zero 62
63 Winterbourne Abbas Scenario 1 Forward Prediction of Nitrate at PWS Nitrate Concentration (mg/l N) Forward prediction based on repeating water levels and rainfall from 1992 to Drinking Water Standard Site Measured Nitrate Max Long Term Trend (LTT) Based on Legacy Nitrate (Max) and Unsat Zone Delay Mid Long Term Trend (LTT) Based on Legacy Nitrate (Av) and Unsat Zone Delay Min Long Term Trend (LTT) based on Legacy Nitrate (Min) and Unsat Zone Delay Predicted Nitrate using Function of Woodyates Monthly Water Level and LTT - plus lag Predicted Nitrate using Function of Rainfall, Ashton Farm Water Level and LTT - plus lag Predicted Nitrate using Function of Rainfall, Ashton Farm Water Level and LTT - plus lag
64 Winterbourne Abbas Scenario 3 Forward Prediction of Nitrate at PWS Nitrate Concentration (mg/l N) Forward prediction based on repeating water levels and rainfall from 1992 to Drinking Water Standard Site Measured Nitrate Max Long Term Trend (LTT) Based on Legacy Nitrate (Max) and Unsat Zone Delay Mid Long Term Trend (LTT) Based on Legacy Nitrate (Av) and Unsat Zone Delay Min Long Term Trend (LTT) based on Legacy Nitrate (Min) and Unsat Zone Delay Predicted Nitrate using Function of Woodyates Monthly Water Level and LTT - plus lag Predicted Nitrate using Function of Rainfall, Ashton Farm Water Level and LTT - plus lag Predicted Nitrate using Function of Rainfall, Ashton Farm Water Level and LTT - plus lag
65 Winterbourne Abbas Scenario 2 Forward Prediction of Nitrate at PWS Nitrate Concentration (mg/l N) Forward prediction based on repeating water levels and rainfall from 1992 to Drinking Water Standard Site Measured Nitrate Max Long Term Trend (LTT) Based on Legacy Nitrate (Max) and Unsat Zone Delay Mid Long Term Trend (LTT) Based on Legacy Nitrate (Av) and Unsat Zone Delay Min Long Term Trend (LTT) based on Legacy Nitrate (Min) and Unsat Zone Delay Predicted Nitrate using Function of Woodyates Monthly Water Level and LTT - plus lag Predicted Nitrate using Function of Rainfall, Ashton Farm Water Level and LTT - plus lag Predicted Nitrate using Function of Rainfall, Ashton Farm Water Level and LTT - plus lag
66 But how radical do you need to be? 66
67 That is great! But how do we achieve a 50% or 100% reduction in leaching? CSFOs? NVZ regulations? Catchment management based on advice and data? Catch-crops WAgrico? Growing grass? Growing trees? 67
68 Comparison of Average Nitrate Concentration (mgn/l) in Porous Pots Under different Crop types 25 Sutton Poyntz (SSSI Grassland) Lewell Plain (OSR) Acres (Grass) N itra te L e v e l (m g N /L ) Oct-07 Nov-07 Dec-07 Jan-08 Feb-08 Mar-08 Apr-08 68

69 Clarendon 69
70 Luke de Vial, MSc (Hydrogeology) 70
COMPARISON OF FIXED & VARIABLE RATES (25 YEARS) CHARTERED BANK ADMINISTERED INTEREST RATES - PRIME BUSINESS*
 CHARTERED BANK ADMINISTERED INTEREST RATES - PRIME BUSINESS*") COMPARISON OF FIXED & VARIABLE RATES (25 YEARS) Fixed Rates Variable Rates FIXED RATES OF THE PAST 25 YEARS AVERAGE RESIDENTIAL MORTGAGE LENDING RATE - 5 YEAR* (Per cent) Year Jan Feb Mar Apr May Jun Jul
COMPARISON OF FIXED & VARIABLE RATES (25 YEARS) Fixed Rates Variable Rates FIXED RATES OF THE PAST 25 YEARS AVERAGE RESIDENTIAL MORTGAGE LENDING RATE - 5 YEAR* (Per cent) Year Jan Feb Mar Apr May Jun Jul
Utility Debt Securitization Authority 2013 T/TE Billed Revenues Tracking Report
 Utility Debt Securitization Authority 2013 T/TE Billed Revenues Tracking Report Billing Budgeted Billed Dollar Percent Month Revenues Revenues Variance Variance Jan 2018 11,943,180.68 12,697,662.47 754,481.79
Wisconsin 511 Traveler Information Annual Usage Summary January 3, Wisconsin 511 Phone Usage ( )
") Wisconsin 511 Traveler Information 211 Annual Usage Summary January 3, 212 Overall to-date Summary 36 months of operation 1,16,63 total calls the 1 Million mark was passed on December 3, 212 3,627,527
Wisconsin 511 Traveler Information 211 Annual Usage Summary January 3, 212 Overall to-date Summary 36 months of operation 1,16,63 total calls the 1 Million mark was passed on December 3, 212 3,627,527
2018 HR & PAYROLL Deadlines
 th (by payment date) EPAF 3rd PARTY FEEDS WTE Approval 2018 HR & PAYROLL s Normal Payroll day s 2017 B1-26 3 * 13-Dec-17 15-Dec-17 n/a n/a n/a 28-Dec-17 29-Dec-17 11:00 AM 16-Dec-2017 29-Dec-2017 JAN 2018
Bluetongue Disease (BT)
") Bluetongue Disease (BT) Analysis of ADNS data since 01/2018 Reporting period: 2018-01-01 2018-12-09 Data query: 2018-12-10 AGES DSR Austrian Agency for Health and Food Safety www.ages.at Parameters Data
Bluetongue Disease (BT) Analysis of ADNS data since 01/2018 Reporting period: 2018-01-01 2018-12-09 Data query: 2018-12-10 AGES DSR Austrian Agency for Health and Food Safety www.ages.at Parameters Data
Groundwater Management Optimization. Dr. Issam NOUIRI
 Tenth Gulf Water Conference, 22-24 April 2012, Doha, Qatar Groundwater Management Optimization by ALL_WATER_gw New problem formulation & additional functionalities. Dr. Issam NOUIRI National Institute
Farm Energy IQ. Wind Energy on Farms. Objectives of this Module. How windy is it? How windy is it? How windy is it? 2/16/2015
 Farms Today Securing Our Energy Future Ed Johnstonbaugh, Penn State Extension Objectives of this Module At the conclusion of this module, you should: Understand wind requirements for power generation Be
MAR DASHBOARD MAR. Compliant % Breakdown Mar % Late % On-time MAR APR MAY JUN JUL AUG SEP OCT NOV DEC
 Positive Response Compliance 215 Compliant 215 Non-Compliant 216 Compliant 216 Non-Compliant 1% 87% 96% 86% 96% 88% 97% 89% 89% 88% 86% 92% 93% 94% 96% 94% 8% 6% 4% 2% 13% JAN 4% 14% FEB 4% 12% 3% 11%
September 2017 MLS Statistical Report. Residential Inventory
 September 217 MLS Statistical Report Residential Inventory 2 2 1 1 21 216 217 Summary Inventories: Residential inventory is down 1%, Lots / Land inventory is down 13% and commercial inventory was down
NEVADA SLOT MACHINES: HISTORICAL HOLD PERCENTAGE VARIATIONS ANNUAL AND MONTHLY HOLD PERCENTAGES, CENTER FOR GAMING RESEARCH, NOVEMBER 2017
 NEVADA SLOT MACHINES: HISTORICAL HOLD PERCENTAGE VARIATIONS ANNUAL AND MONTHLY HOLD PERCENTAGES, 2004-2017 CENTER FOR GAMING RESEARCH, NOVEMBER 2017 Executive Summary Hold percentage the portion of money
Drought: What is the Status?
 Drought: What is the Status? Nolan J. Doesken Colorado Climate Center Colorado State University http://ccc.atmos.colostate.edu Presented at 2005 Peak to Prairie Landscape Symposium, February 11, 2005,
May 2018 MLS Statistical Report
 Jan Feb Mar Apr May Jun Jul Aug Sep Oct Nov Dec January February March April May June July August Septem October Novem Decemb Days on Market The graph on the right illustrates the drastic decline in the
3. EXCEL FORMULAS & TABLES
 Fall 2017 CS130 - Excel Formulas & Tables 1 3. EXCEL FORMULAS & TABLES Fall 2017 Fall 2017 CS130 - Excel Formulas & Tables 2 Cell References Absolute reference - refer to cells by their fixed position.
Drought and the Climate of the Ogallala Aquifer
 Drought and the Climate of the Ogallala Aquifer Nolan J. Doesken Colorado Climate Center Colorado State University Presented at Ogallala Symposium, Wray, Colorado February 20, 2006 Prepared by Odie Bliss
CUPSIM Water Supply Variability Study All information subject to change.
 . 1 IN A NUTSHELL The CUP Water Supply Variability Study is an opportunistic, proactive example of responsible water system management The CUP is very complex and approaching full demand The study capitalizes
GAZIFÈRE INC. Prime Rate Forecasting Process 2015 Rate Case
 Overview A consensus forecast is used to estimate the prime rate charged by commercial banks. As the prime rate is subject to competitive pressures faced by individual lenders and is set on an individual
 A Brief Analysis of the Impact of the El Niño Southern Oscillation (ENSO) Cycle In specific areas around East Timor In the Climate Change section of Seeds of Life, we believe it would be beneficial for
Bicycle Crashes. Number of Bike Crashes. Total Bike Crashes. are down 21% and severe bike crashes down 8% since 2013 (5 years).
.") Bicycle Crashes The City of Fort Collins is well known for its bike culture, and there is a strong focus on encouraging increased riding. Bike safety is an important component of supporting these efforts.
Bicycle Crashes The City of Fort Collins is well known for its bike culture, and there is a strong focus on encouraging increased riding. Bike safety is an important component of supporting these efforts.
Hard Shoulder Running is a valuable tool July 14, Dean H. Gustafson, PE, PTOE State Operations Engineer VDOT Operations Division
 Hard Shoulder Running is a valuable tool July 14, 2016 Dean H. Gustafson, PE, PTOE State Operations Engineer VDOT Operations Division Virginia 2 VDOT s Statewide Operations Program Operations Statistics
Drought or Not? Nolan J. Doesken Colorado Climate Center Colorado State University
 Drought or Not? Nolan J. Doesken Colorado Climate Center Colorado State University http://ccc.atmos.colostate.edu Presented at Horticultural Art Society meeting, November 19, 2004, Colorado Springs, Colorado
SWISS reports stable load factors
 SWISS Corporate Communications Phone: +41 (0)848 773 773 Fax: +41 (0)44 564 2127 communications@swiss.com SWISS.COM Media release Zurich Airport, October 10, 2008 SWISS reports stable load factors SWISS
African swine fever in domestic pigs and wild boar (ASF)
") African swine fever in domestic pigs and wild boar (ASF) Analysis of ADNS data since 01/2018 Reporting period: 2018-01-01 2018-12-09 Data query: 2018-12-10 AGES DSR Austrian Agency for Health and Food
African swine fever in domestic pigs and wild boar (ASF) Analysis of ADNS data since 01/2018 Reporting period: 2018-01-01 2018-12-09 Data query: 2018-12-10 AGES DSR Austrian Agency for Health and Food
Orion In Situ Oil Sands 2014 Progress Update. Presented May 21, 2015
 Orion In Situ Oil Sands 2014 Progress Update Presented May 21, 2015 Agenda Osum Production Corp.. The Orion Project - History Osum Production Corp.. Geoscience Jack Pels Well Data Osum Production Corp.
1 PEW RESEARCH CENTER
 1 SEPTEMBER 2018 POLITICAL SURVEY FINAL TOPLINE SEPTEMBER 18-24, 2018 N=1,754 QUESTIONS 1-2, 7-8, 11-13, 28 PREVIOUSLY RELEASED NO QUESTIONS 3-6, 9-10, 14-27, 29-32, 34-43, 47-49 QUESTION 33 HELD FOR FUTURE
System Flexibility Indicators
 System Flexibility Indicators Place your chosen image here. The four corners must just cover the arrow tips. For covers, the three pictures should be the same size and in a straight line. Operational Forum
FREEDOM OF INFORMATION REQUEST
 FREEDOM OF INFORMATION REQUEST REQUEST NUMBER: FOI Request 003905-16 REQUEST DETAILS: As part of my research I am requesting information on the numbers of 'strip searches' that have taken place within
SWISS Traffic Figures May 2004
 SWISS Traffic Figures May 2004 SWISS continues seat load factor improvement in May SWISS s load factor for May was 4.8 percentage points better than for the same period last year. Seat load factor for
PUBLIC MEETINGS. Please see the City of Geneva Public Meeting Guide for more information regarding City Council and Committee of the Whole meetings.
 PUBLIC MEETINGS Citizens are welcome and encouraged to attend all City of Geneva public meetings. Public meeting guests are also urged to participate in any of the City s many public meetings that take
Hydrological Condition Report including the issues of High Flow Fluctuation in Chiang Saen
 Hydrological Condition Report including the issues of High Flow Fluctuation in Chiang Saen Technical Symposium for ESCIR and MRC on Social Impact Assessment in River Basin Management Sothea KHEM, HENG
Site Description: Tower Site
 Wind Resource Summary for Elizabeth Site Final Report Colorado Anemometer Loan Program Monitoring Period: 7/3/6 /15/7 Report Date: December 22, 7 Site Description: The site is.6 miles northeast of the
Properties. terc.ucdavis.edu 8
 Physical Properties 8 Lake surface level Daily since 1900 The lowest lake level on record was 6,220.26 feet on Nov. 30, 1992. Since 1900, lake level has varied by more than 10 feet. Lake level typically
Weather and Climate Impacts on Water Supply
 Weather and Climate Impacts on Water Supply Nolan Doesken Colorado Climate Center Atmospheric Science Department Colorado State University http://ccc.atmos.colostate.edu Presented at the South Platte Forum,
Farm Energy IQ. Farms Today Securing Our Energy Future. Wind Energy on Farms
 Farm Energy IQ Farms Today Securing Our Energy Future Wind Energy on Farms Farm Energy IQ Wind Energy on Farms Ed Johnstonbaugh, Penn State Extension Objectives of this Module At the conclusion of this
University of Guam Water and Environmental Research Institute of the Western Pacific GUAM S WATER ISSUES
 University of Guam Water and Environmental Research Institute of the Western Pacific GUAM S WATER ISSUES 1 0 WESTERN PACIFIC ISLANDS + + 400 MILES COMMONWEALTH OF THE NORTHERN MARIANA ISLANDS GUAM FEDERATED
A pheasant researcher notebook:
 A pheasant researcher notebook: what we are learning about pheasants and pheasant hunters in Nebraska TJ Fontaine Nebraska Cooperative Fish and Wildlife Research Unit Managing pheasants is challenging
Nolan Doesken. Colorado Climate Center.
 Nolan Doesken Colorado Climate Center Presented to: Colorado Conservation Tillage Association, Greeley, CO, February 1-2, 1 2005 http://ccc.atmos.colostate.edu Prepared by Odie Bliss 1 Key Features of
CCoWS. Central Coast Watershed Studies. Summary of Precipitation and Streamflow for Potrero and San Clemente Creeks in 2010
 Central Coast Watershed Studies CCoWS Summary of Precipitation and Streamflow for Potrero and San Clemente Creeks in Water-Year 2010 Santa Lucia Preserve Monterey County, California Publication No. WI-2011-01
Short-Term Transit Ridership and Revenue Forecasting
 Short-Term Transit Ridership and Revenue Forecasting presented to The 5 th Transportation Research Board Conference on Innovations in Travel Modeling presented by Cambridge Systematics, Inc. Feng Liu,
Drought! When Do We Know It s Over?
 Drought! When Do We Know It s Over? Nolan J. Doesken Colorado Climate Center Colorado State University http://ccc.atmos.colostate.edu Presented at the 2004 Peak to Prairie Landscape Symposium, February
SOLTRANS BOARD MEETING SUPPLEMENTAL REPORTS / HANDOUTS January 15, 2015 MEETING HANDOUTS
 SOLTRANS BOARD MEETING SUPPLEMENTAL REPORTS / HANDOUTS January 15, 2015 MEETING HANDOUTS Agenda Item 10 January 2015 System Improvements Update - PowerPoint Presentation Agenda Item 12 Construction Projects
Estimation of polluted area in case of potential leakage of the chemical munitions
 Estimation of polluted area in case of potential leakage of the chemical munitions Jaromir Jakacki Institute of Oceanology PAS, Sopot, Poland Science for the Environment 2015 ENVIRONMENTAL MONITORING AND
MBMG Butte Mine Flooding Monthly Report BMFOU Consent Decree BU-SEH Remedial Action Monitoring Program Contract No TO-35 September 2013
 MBMG Monthly Report BMFOU Consent Decree 02-35-BU-SEH Remedial Action Monitoring Program Contract No. 400022-TO-35 September 20 The Montana Bureau of Mines and Geology (MBMG) continued to perform monitoring
Site Description: LOCATION DETAILS Report Prepared By: Tower Site Report Date
 Wind Resource Summary for Holyoke Site Final Report Colorado Anemometer Loan Program Monitoring Period:: 6/21/26 /6/27 Report Date: December 2, 27 Site Description: The site is 17.4 miles south of the
Utah Ag Bankers Conference Alfalfa and Dairy Outlook
 Utah Ag Bankers Conference Alfalfa and Dairy Outlook Dillon M Feuz Utah State University Extension Feb 2018 Hay Market Most data provided by USDA- AMS, NASS & FAS 1990 1990 1991 1991 1992 1992 1993 1994
Encouraging Taxi Drivers to Behave: Grafton Bridge Taxi and Bus Lane Trial. Rob Douglas-Jones Tim Segedin, Edin Ltd.
 Encouraging Taxi Drivers to Behave: Grafton Bridge Taxi and Bus Lane Trial Rob Douglas-Jones Tim Segedin, Edin Ltd. 2.1km 12 mins Hospital 1.5km 9 mins To Newmarket 5 500 bikes per day 500 pedestrians
Tuesday, January 11, :11 AM (CST)
") Tuesday, January 11, 2011 11:11 AM (CST) -Assessment of current water conditions - Precipitation Forecast - Recommendations for Drought Monitor Upper Colorado Normal Precipitation Upper Colorado River
Tuesday, January 11, 2011 11:11 AM (CST) -Assessment of current water conditions - Precipitation Forecast - Recommendations for Drought Monitor Upper Colorado Normal Precipitation Upper Colorado River
3. EXCEL FORMULAS & TABLES
 Winter 2017 CS130 - Excel Formulas & Tables 1 3. EXCEL FORMULAS & TABLES Winter 2017 Winter 2017 CS130 - Excel Formulas & Tables 2 Cell References Absolute reference - refer to cells by their fixed position.
Key Feature and Challenges from Climate Change for Mekong River Basin
 1 Key Feature and Challenges from Climate Change for Mekong River Basin By Dr. Thanapon Piman Planning Division Basin Development Plan Pragramme Mekong River Commission Secretariat (MRCS) 2 Outline 1)
Implementation of an Asset Management Software for Proactive Management and Optimization of the Collection System Rehabilitation and Renewal Program
 Implementation of an Asset Management Software for Proactive Management and Optimization of the Collection System Rehabilitation and Renewal Program P. S. Arora, P.E. Joel Nickerson 2,591,286 linear feet
I 595 Express Corridor Improvements Project. February 2014 Update
 I 595 Express Corridor Improvements Project February 2014 Update PROJECT COMPONENTS Reversible Express Lanes Direct Connect to Florida s Turnpike Open Road Tolling SR 84 Continuous Connection Florida s
Analysis of 2015 Trail Usage Patterns along the Great Allegheny Passage
 Analysis of 2015 Trail Usage Patterns along the Great Allegheny Passage Prepared for the Allegheny Trail Alliance, August 2016 By Dr. Andrew R. Herr Associate Professor of Economics Saint Vincent College
Water Resources Planning Department. Projection Analysis Work Sheets for Bakersfield District. Printed on 4/12/2016 at 2:11 PM
 Water Resources Planning Department Projection Analysis Work Sheets for Bakersfield District 2015 Printed on 4/12/2016 at 2:11 PM Table of Contents for Worksheets Worksheet Title 1 Annual Services 2 Service
A STUDY OF PROSPECTS OF WIND RESOURCES FOR WATER PUMPING AND ELECTRICITY GENERATION IN BANGLADESH
 th International Conference on Mechanical Engineering, December -, 1, Dhaka, Bangladesh/pp. I 53-59 A STUDY OF PROSPECTS OF WIND RESOURCES FOR WATER PUMPING AND ELECTRICITY GENERATION IN BANGLADESH Sultan
91 Express Lanes Model Update 2006 State Route 91 Implementation Plan. Gerald V. Nielsten May 18, 2007
 91 Express Lanes Model Update 2006 State Route 91 Implementation Plan Gerald V. Nielsten May 18, 2007 1 Vollmer Associates LLP is now Stantec Inc. Stantec Inc. completed the acquisition of Vollmer Associates
Supplement of Multi-century lake area changes in the Southern Altiplano: a tree-ringbased reconstruction
 Supplement of Clim. Past,, 9, http://www.clim-past.net//9// doi:.94/cp--9--supplement Author(s). CC Attribution. License. Supplement of Multi-century lake area changes in the Southern Altiplano: a tree-ringbased
CoCoRaHS goes to the Colorado Farm Show
 CoCoRaHS goes to the Colorado Farm Show Nolan J. Doesken Colorado Climate Center, Atmospheric Science Dept, Colorado State University Presented January 25, 2006, Greeley, CO Prepared by Odie Bliss The
Mogden Sewage Treatment Works
 Mogden Sewage Treatment Works Residents Liaison Meeting 7 December 2011 Thames Water Agenda Review of previous minutes Operations and communications Mosquito talk and survey results Sewage Treatment Work
Preston s Edmond Market Report
 Preston s Edmond arket Report July 2 Prepared By Brian Preston RE/AX Associates obile: 45-826-5725 Office: 45-359-87 bpreston88@sbcglobal.net www.edmond4sale.com Realtor of the Year 1995 & 22 Lifetime
DEC DASHBOARD. Positive Response Compliance DEC. Compliant Tickets : On-Time Performance Analysis. December % Late.
 Positive Response Compliance 215 Compliant 215 Non-Compliant 216 Compliant 216 Non-Compliant 1% 87% 96% 86% 96% 88% 97% 89% 97% 89% 98% 88% 97% 86% 96% 92% 97% 93% 97% 94% 97% 96% 97% 94% 97% 8% 6% 4%
July 2015 Sept Cork City Pedestrian Counter Report
 July 2015 Sept 2015 Cork City Pedestrian Counter Report Disclaimer Cork City Council has produced this report based on information extracted from our Pedestrian Counter Monitoring System. Although care
Mutton Snapper Public Workshops February Florida Fish and Wildlife Conservation Commission Division of Marine Fisheries Management
 Mutton Snapper Public Workshops February 2016 Florida Fish and Wildlife Conservation Commission Division of Marine Fisheries Management Workshop Ground Rules All points of view are valid Behave with courtesy
Staying in Tune with South Florida s Water Cycle for Scientists, Managers, and Policy Makers in 5 Minutes per Week
 Staying in Tune with South Florida s Water Cycle for Scientists, Managers, and Policy Makers in 5 Minutes per Week Robert Sobczak (Big Cypress Nat l Pres), Todd Hopkins (FWS), Kevin Kotun (Everglades National
JAN DASHBOARD. Positive Response Compliance JAN. Compliant Tickets : On-Time Performance Analysis. January % Late.
 Positive Response Compliance 216 Compliant 216 Non-Compliant 217 Compliant 217 Non-Compliant 1% 96% 97% 8% 6% 4% 2% 4% 3% FEB MAR APR MAY JUN JUL AUG SEP OCT NOV DEC 8% Late Compliant Tickets : On-Time
Jacksonville & Terre Haute
 2013-14 Post Harvest Special Grain Market Outlook and Strategies for Jacksonville & Terre Haute Presented by: Joseph Aiello 12/06-07/13 Disclaimer: Futures/options trading involves substantial risk of
NCC Cable System Order
 Order # 62508883 Flight s 03/13/18-04/01/18 Syscode 2107 Agency Canal Partners Media System Name Spectrum/DISH- I+ Tampa-St. Pete, FL Advertiser Levine For Governor Phone (301) 951-2620 Credit Update 03/13/18
Instances of 1 Minute or Less Between Buses 4 5% 55% 3.9% 3.5% 3.5% 3.5% 2.9% 2.8% Sep- Sep 07 Oct-07 Nov-07 Dec-07 Jan- Jan 08 Feb- Feb 08 Mar-08
 President s Report Monthly Performance Matrix Meeting or exceeding target Within 10% of target Missing target by more than 10% Measure does not have target RIDERSHIP Total Ridership p( (in millions) Rail
Manufacturers Continue Capacity Expansion as Technology Orders Grow
 Contact: Penny Brown, AMT, 703-827-5275 pbrown@amtonline.org For Release: October 8th, 2018 Manufacturers Continue Capacity Expansion as Technology Orders Grow Manufacturing technology orders posted an
DG AGRI DASHBOARD: CITRUS FRUIT Last update:
 14 000 12 000 10 000 8 000 6 000 4 000 2 000 0 1996 1997 1998 1999 2000 2001 2002 2003 2004 2005 2006 2007 2008 2009 2010 2011 2012 2013 2014 2015 2016 Small citrus (group mandarines): clementines, satsumas
SEASONAL PRICES for TENNESSEE FEEDER CATTLE and COWS
 SEASONAL PRICES for TENNESSEE FEEDER CATTLE and COWS Tammy L. McKinley Extension Specialist Agricultural & Resource Economics economics.ag.utk.edu AE16-06 July 2016 TABLE OF CONTENTS Seasonal : Introduction...
Abel Tasman Birdsong Trust Trapping Report March 2017
 Abel Tasman Birdsong Trust Trapping Report March 2017 Introduction Traps are checked and baited by Abel Tasman Birdsong Trust volunteers approximately twice per month. The results for trap checking are
DG AGRI DASHBOARD: CITRUS FRUIT Last update:
 8.000 7.000 6.000 5.000 4.000 3.000 2.000 1.000 0 1996 1997 1998 1999 2000 2001 2002 2003 2004 2005 2006 2007 2008 2009 2010 2011 2012 2013 2014 2015 2016 2017 Small citrus (group mandarines): clementines,
Kodiak, Alaska Site 1 Wind Resource Report
 Kodiak, Alaska Site 1 Wind Resource Report Report written by: Douglas Vaught, P.E., V3 Energy LLC, Eagle River, AK Date of report: March 16, 2007 Photo by Doug Vaught, V3 Energy LLC Summary Information
Suburb Flyover Report
 Suburb Flyover Report NARRABEEN (House) Prepared By: Shelley Bakhuizen, Ray White Mona Vale NARRABEEN - Suburb Map NARRABEEN - Sales Statistics (Houses) Year # Sales Median Growth Low High 1998 188 $ 09,500
The State of the Climate Address
 The State of the Climate Address Nolan J. Doesken Colorado Climate Center, Atmospheric Science Dept, Colorado State University Presented to Colorado Water Officials Association, 2005 Annual Meeting, September
Progress Report on the Design and Planning of an Infrastructure Improvement Project for the Sunnyside TIF District (Phase II)
") Presentation to the CNRC Board of Directors Regular Meeting March 11, 2015 1 Agenda Preferred Alternate Refinement for University Avenue, 3rd Street, and Beverly Avenue Intersection Improvements validate
Presentation to the CNRC Board of Directors Regular Meeting March 11, 2015 1 Agenda Preferred Alternate Refinement for University Avenue, 3rd Street, and Beverly Avenue Intersection Improvements validate
Brian Cheuvront, Ph.D. SAFMC Deputy Executive Director for Management
 Brian Cheuvront, Ph.D. SAFMC Deputy Executive Director for Management
Cattle Market Outlook & Important Profit Factors for Cattle Producers
 Cattle Market Outlook & Important Profit Factors for Cattle Producers Dr. Scott Brown Agricultural Markets and Policy Division of Applied Social Sciences brownsc@missouri.edu http://amap.missouri.edu $
Don Pool and Jeff Kennedy, USGS Brian Conway, Arizona Dept. Water Resources
 USGS Arizona Water Science Center Gravity Program Don Pool and Jeff Kennedy, USGS Brian Conway, Arizona Dept. Water Resources Black Hills Limestone Aquifer Project DUSEL project Sagehen Creek Sierra Nevada
Rice Yield And Dangue Haemorrhagic Fever(DHF) Condition depend upon Climate Data
 Condition depend upon Climate Data") Rice Yield And Dangue Haemorrhagic Fever(DHF) Condition depend upon Climate Data Dr Lai Lai Aung, Assistant Director( Met Service) Dr Khaing Khaing Soe Assistant Director(Public Health) Dr Thin Nwe htwe
Rice Yield And Dangue Haemorrhagic Fever(DHF) Condition depend upon Climate Data Dr Lai Lai Aung, Assistant Director( Met Service) Dr Khaing Khaing Soe Assistant Director(Public Health) Dr Thin Nwe htwe
2017/18 Soybean Outlook
 217/18 Soybean Outlook 217 Ag Econ In service Training Dr. S. Aaron Smith, Assistant Professor, Department of Agricultural and Resource Economics, University of Tennessee https://ag.tennessee.edu/arec/pages/cropeconomics.aspx
Nolan Doesken Colorado Climate Center
 Nolan Doesken Colorado Climate Center Presented to: Colorado Cattleman s s Association, Pueblo, CO, June 19, 2006 http://ccc.atmos.colostate.edu Prepared by Odie Bliss 1 Let s s Talk About Precipitation
Foreign overnights in the Nordic countries 2015
 Foreign overnights in the Nordic countries 2015 Sources: Statistics Statistics Statistics Statistics July 2016 VISIT FINLAND STATISTICS Contents Foreign overnights in the Nordic countries.4 Overnights
2017/18 Corn Outlook
 217/18 Corn Outlook 217 Ag Econ In service Training Dr. S. Aaron Smith, Assistant Professor, Department of Agricultural and Resource Economics, University of Tennessee https://ag.tennessee.edu/arec/pages/cropeconomics.aspx
January 2019 FY Key Performance Report
 January 2019 FY 2019 - Key Performance Report Management Notes: The information in this report is based on the FY 2019 Operating Budget, adopted by the Board on June 11, 20. RT s farebox recovery ratio
Draft Kivalina Wind Resource Report
 Draft Kivalina Wind Resource Report Kivalina aerial photo by Doug Vaught, July 2011 May 31, 2012 Douglas Vaught, P.E. dvaught@v3energy.com V3 Energy, LLC Eagle River, Alaska Draft Kivalina Wind Resource
Montgomery County Pedestrian Safety. Seneca Valley High School PTSA November 20, 2012
 Montgomery County Pedestrian Safety Seneca Valley High School PTSA November 20, 2012 Pedestrian Safety Program - The 3 E s Objective: Improve safety for pedestrians and make Montgomery County a more walkable
Aspects and Case Studies of the Effects of Climate Change on Water Resources. Part II (Case Studies)
") Aspects and Case Studies of the Effects of Climate Change on Water Resources Part II (Case Studies) Manfred Koch Department of Geohydraulics and Engineering Hydrology, University of Kassel, Germany Email:
Aspects and Case Studies of the Effects of Climate Change on Water Resources Part II (Case Studies) Manfred Koch Department of Geohydraulics and Engineering Hydrology, University of Kassel, Germany Email:
Greater Las Vegas Snapshot by Sale Type Last Month's Sold
 Available Units Pending Units Las Vegas Market Update - February 2018 Greater Las Vegas Snapshot by Sale Type Last Month's Sold Units Median List Price Average List Price Median Sold Price Average Sold
b Number issued 200,000 (marked with * in the attached appendix) Exercise price is as set out in the appendix
 Exercise price is as set out in the appendix") www.sli-systems.com Level 1, EPIC 78 106 Manchester Street Christchurch New Zealand Phone: 0800 754 797 Fax:03 961 3262 22 May 2018 Client Market Services NZX Limited WELLINGTON By NZ MAP NOTIFICATION
www.sli-systems.com Level 1, EPIC 78 106 Manchester Street Christchurch New Zealand Phone: 0800 754 797 Fax:03 961 3262 22 May 2018 Client Market Services NZX Limited WELLINGTON By NZ MAP NOTIFICATION
Forecasting and Visualisation. Time series in R
 Time Series in R: Forecasting and Visualisation Time series in R 29 May 2017 1 Outline 1 ts objects 2 Time plots 3 Lab session 1 4 Seasonal plots 5 Seasonal or cyclic? 6 Lag plots and autocorrelation 7
Albeni Falls Dam Downstream Water Temperature Study Interim Results
 Albeni Falls Dam Downstream Water Temperature Study Interim Results Amy Reese, Chief Water Management Section Seattle District June 24, 2014 US Army Corps of Engineers What we hope to cover today Albeni
Using science to guide operations
 Environment Institute Using science to guide operations Capability and expertise in water addressing water management issues of national significance. Increasing capacity to deliver water for environmental
STRATEGY (ROLL - OUT PLAN) ASA MISSION STATEMENT
 ASA MISSION STATEMENT") ASA MISSION STATEMENT To make a contribution towards Nation Building and Healing of our land, South Africa, and the Transformation of our Society, through the Development of Athletics, from Grassroots
ASA MISSION STATEMENT To make a contribution towards Nation Building and Healing of our land, South Africa, and the Transformation of our Society, through the Development of Athletics, from Grassroots
Lake Taneycomo Fisheries Management. Shane Bush : Fisheries Management Biologist
 Lake Taneycomo Fisheries Management Shane Bush : Fisheries Management Biologist Lake Taneycomo Empire District Electric Company Impoundment Completed in 1913 2,8 acres 22 miles long Lake Taneycomo Table
Greater Las Vegas Snapshot by Sale Type Last Month's Sold
 Available Units Pending Units Las Vegas Market Update - April 2018 Greater Las Vegas Snapshot by Sale Type Last Month's Sold Units Median List Price Average List Price Median Sold Price Average Sold Price
Market Perspectives for the German and European Agricultural Machinery Industry
 Market Perspectives for the German and European Agricultural Machinery Industry Gerd Wiesendorfer VDMA Agricultural Machinery Association 2013-11-12 Agrievolution Economic Committee Page 1 Business climate
Cattle and Beef Markets: Short and Long Run Challenges and Opportunities
 Cattle and Beef Markets: Short and Long Run Challenges and Opportunities Derrell S. Peel Breedlove Professor of Agribusiness and Extension Livestock Marketing Specialist Oklahoma State University Major
Guam Future Hotel Supply Requirements. Presented By: Damien Little, Horwath HTL
 Guam Future Hotel Supply Requirements Presented By: Damien Little, Horwath HTL Outline Current Strengths/Weaknesses of Guam Seasonal Tourism Performance Tourism Growth Projections Future Hotel Supply Requirements
Beef Outlook. Regional Dealer Event. February 9, Dr. Scott Brown Agricultural Markets and Policy Division of Applied Social Sciences
 Beef Outlook Regional Dealer Event February 9, 2018 Dr. Scott Brown Agricultural Markets and Policy Division of Applied Social Sciences brownsc@missouri.edu http://amap.missouri.edu $ Per Cwt. MED. & LRG.
Greater Las Vegas Snapshot by Sale Type Last Month's Sold
 Available Units Pending Units Las Vegas Market Update - July 2018 Greater Las Vegas Snapshot by Sale Type Last Month's Sold Units Median List Price Average List Price Median Sold Price Average Sold Price