Top Incomes and the Great Recession: Recent Evolutions and Policy Implications
|
|
|
- Myrtle Shaw
- 5 years ago
- Views:
Transcription

1 13TH JACQUES POLAK ANNUAL RESEARCH CONFERENCE NOVEMBER 8 9, 2012 Top Incomes and the Great Recession: Recent Evolutions and Policy Implications Thomas Piketty Paris School of Economics Emmanuel Saez University of California, Berkeley Paper presented at the 13th Jacques Polak Annual Research Conference Hosted by the International Monetary Fund Washington, DC November 8 9, 2012 The views expressed in this paper are those of the author(s) only, and the presence of them, or of links to them, on the IMF website does not imply that the IMF, its Executive Board, or its management endorses or shares the views expressed in the paper.
2 Top Incomes and the Great Recession: Recent Trends & Policy Implications Thomas Piketty & Emmanuel Saez IMF Annual Research Conference November
3 General motivation: inequality in the long run Long run distributional trends = key question asked by 19 C economists Many came with apocalyptic answers Ricardo-Marx: a small group in society (land owners or capitalists) will capture an ever growing share of income & wealth no balanced development path can occur During 20 C, a more optimistic consensus emerged: growth is a rising tide that lifts all boats (Kuznets 1953; cold war context)
4 But inequality since 1970s destroyed this fragile consensus (US : 60% of total growth was absorbed by top 1%, 70% by top 10%) 19 C economists raised the right questions; we need to adress these questions again; we have no strong reason to believe in balanced development path world financial crisis also raised doubts about balanced devt path will stock options & bonuses, or oil-rich countries, or China, or tax havens, absorb an ever growing share of world ressources in 21 C capitalism?
5 Convergence vs divergence Convergence forces do exist: diffusion of knowledge btw countries (fostered by econ & fin integration) & wth countries (fostered by adequate educ institutions) But divergence forces can be stronger: (1) When top earners set their own pay, there s no limit to rent extraction top income shares can diverge (2) The wealth accumulation process contains several divergence forces, especially with low g ( high wealthincome ratio: β=s/g) & with r > g a lot depends on the net-of-tax global rate of return r on large diversified portfolios : if r=5%-6% in (=what we observe in for large Forbes fortunes, or Abu Dhabi sovereign fund, or Harvard endowment), then global wealth divergence is very likely
6 This paper: three points 1.The continuing rise of top income shares - Updated series from World Top Incomes Database (WTID); rebound of top shares in 10; Great Recession unlikely to reverse long run trend 2. How much should we use progressive tax to reverse the trend? - Cross-country & micro evidence suggests that rise of top shares has more to do with «grabbing hand» model (bargaining elasticity) than with technical change and rising return to talent - Socially optimal top tax rates might be larger than commonly assumed: say 70%-80% rather than 50%-60% (see Piketty-Saez-Stantcheva, «Optimal Taxation of Top Labor Income: A Tale of Three Elasticities», 12) 3. Does rising inequality exacerbate financial fragility? - Rising top shares & stagnant median incomes certainly did put extra pressure on financial systems; but modern finance is sufficiently fragile to crash by itself (without inequality ); see Europe vs US - Rising aggregate wealth-income ratios might be more relevant for macro fragility than rising top income shares: Spain (see Piketty-Zucman, «Capital is Back: Wealth-Income Ratios in Rich Countries », 12)
7 1. The Continuing Rise of Top Income Shares World top incomes database: 25 countries, annual series over most of 20 C, largest historical data set Two main findings: - The fall of rentiers: inequality during first half of 20 C = top capital incomes hit by capital shocks; did not fully recover so far (long lasting shock + progressive taxation) without war-induced economic & political shock, there would have been no long run decline of inequality; nothing to do with a Kuznets-type spontaneous process - The rise of working rich: inequality since 1970s; mostly due to top labor incomes, which rose to unprecedented levels; top wealth & capital incomes also recovering, though less fast; top shares 08-09, but 10; Great Recession is unlikely to reverse the long run trend what happened?
8
9 50% 45% 40% 35% 30% 25% Share of total income going to Top 10% FIGURE 1 The Top Decile Income Share in the United States, Source: Piketty and Saez (2003), series updated to Income is defined as market income including realized capital gains (excludes government transfers).
10 Share of total income going to Top 10% 50% 45% 40% 35% 30% 25% Including capital gains Excluding capital gains FIGURE 1 The Top Decile Income Share in the United States, Source: Piketty and Saez (2003), series updated to Income is defined as market income including realized capital gains (excludes government transfers).
11 25% 20% 15% 10% 5% 0% Top 1% (incomes above $352,000 in 2010) Top 5-1% (incomes between $150,000 and $352,000) Top 10-5% (incomes between $108,000 and $150,000) FIGURE 2 Decomposing the Top Decile US Income Share into 3 Groups, Share of total income accruing to each group
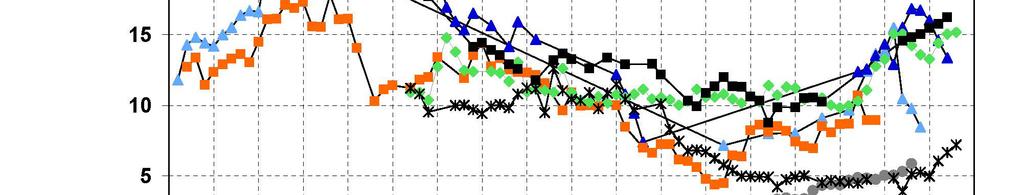
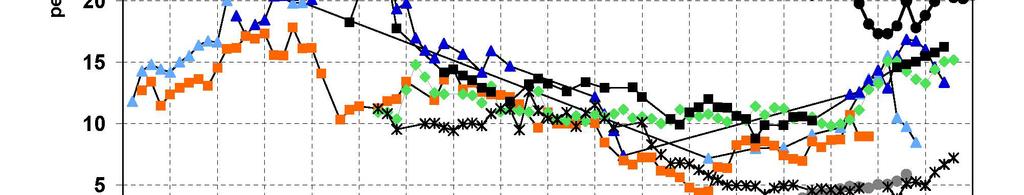
12 Top 1% share: English Speaking countries (U-shaped), Top Percentile Share (in percent) United States United Kingdom Canada Australia Ireland New Zealand
13 Top 1% share: Continental Europe and Japan (L-shaped), Top Percentile Share (in percent) France Germany Netherlands Switzerland Japan Sweden
14 Share of total income going to top 10% (incl. realized capital gains 50% 45% 40% 35% 30% Top Decile Income Shares U.S. U.K. Germany France 25% Source: World Top Incomes Database, Missing values interpolated using top 5% and top 1% series.
15 2. How much should we use progressive taxation to reverse the trend? Hard to account for observed cross-country variations with a pure technological, marginal-product story One popular view: US today = working rich get their marginal product (globalization, superstars); Europe today (& US 1970s) = market prices for high skills are distorted downwards (social norms, etc.) very naïve view of the top end labor market & very ideological: we have zero evidence on the marginal product of top executives; it may well be that prices are distorted upwards (more natural for price setters to bias their own price upwards rather than downwards)
16 A more realistic view: grabbing hand model = marginal products are unobservable; top executives have an obvious incentive to convince shareholders & subordinates that they are worth a lot; no market convergence because constantly changing corporate & job structure (& costs of experimentation competition not enough to converge to full information) when pay setters set their own pay, there s no limit to rent extraction... unless confiscatory tax rates at the very top (memo: US top tax rate (1m$+) = 82%) (no more fringe benefits than today) see Piketty-Saez-Stantcheva, NBER WP 2012 (macro & micro evidence on rising CEO pay for luck)
17 100% Top Income Tax Rates Top marginal income tax rate applying to top income 90% 80% 70% 60% 50% 40% 30% 20% 10% 0% U.S. U.K. Germany France Source: World Top Incomes Database, 2012.
18
19
20 Optimal Taxation of Top Labor Incomes Standard optimal top tax rate formula: τ = 1/(1+ae) With: e = elasticity of labor supply, a = Pareto coefficient τ as elasticity e : don t tax elastic tax base τ as inequality, i.e. as Pareto coefficient a (US: a 3 in 1970s 1.5 in 2010s; b=a/(a-1) 1.5 3) (memo: b = E(y y>y 0 )/y 0 = measures fatness of the top) Augmented formula: τ = (1+tae 2 +ae 3 )/(1+ae) With e = e 1 + e 2 + e 3 = labor supply elasticity + income shifting elasticity + bargaining elasticity (rent extraction) Key point: τ as elasticity e 3
21
22 3. Does inequality exacerbate financial fragility? Rising top shares & stagnant median incomes certainly did put extra pressure on financial systems In US, 15% Y transferred from bottom 90% to top 10% since 1970s; if C does not adjust, huge debt buildup; domestic imbalance = much bigger than global imbalance But modern finance is sufficiently fragile to crash by itself, even without inequality ; see Europe vs US Rising aggregate wealth-income ratios might be more relevant for macro fragility than rising top income shares See Piketty-Zucman, «Capital is Back: Wealth-Income Ratios in Rich Countries », 12: we put together new data set of national balance sheets to study long run evolution of wealth-income ratios
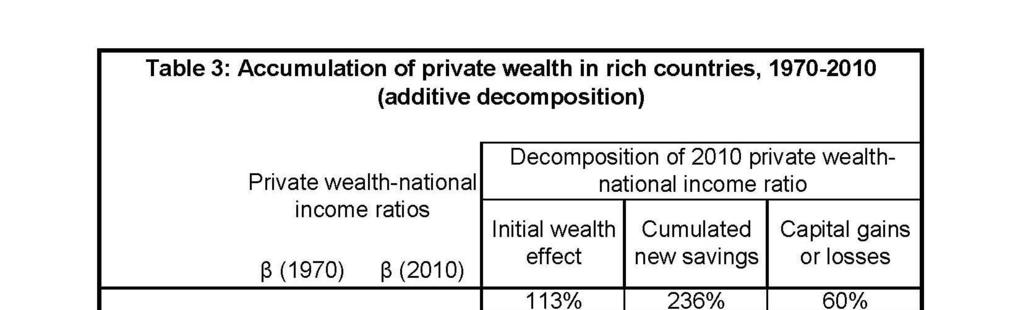
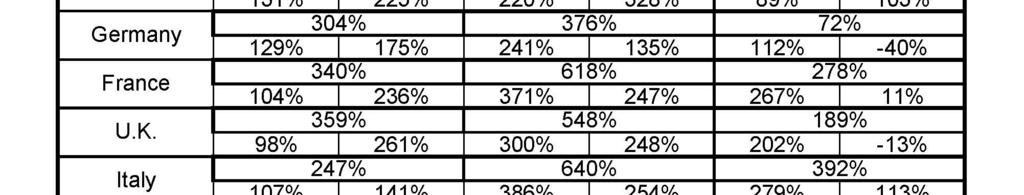
23 Result 1: we find in every country a gradual rise of wealth-income ratios over period, from about 200%-300% in 1970 to 400%-600% in 2010 Result 2: in effect, today s ratios seem to be returning towards the high values observed in 19 c Europe (600%-700%) This can be accounted for by a combination of factors: - Politics: long run asset price recovery effect (itself driven by changes in capital policies since WWs) - Economics: slowdown of productivity and pop growth Harrod-Domar-Solow: wealth-income ratio β = s/g If saving rate s=10% & growth rate g=3%, then β 300% But if s=10% & g=1.5%, then β 600% Explains long run change & level diff Europe vs US
24 800% Private wealth / national income ratios, % 600% USA Germany UK Canada Japan France Italy Australia 500% 400% 300% 200% 100% Authors' computations using country national accounts. Private wealth = non-financial assets + financial assets - financial liabilities (household & non-profit sectors)
25 Private wealth / national income ratios, (incl. Spain) 800% 700% USA Japan Germany France UK Italy Canada Spain Australia 600% 500% 400% 300% 200% 100% Authors' computations using country national accounts. Private wealth = non-financial assets + financial assets - financial liabilities (household & non-profit sectors)
26 800% 700% Private vs governement wealth, (% national income) USA Japan Germany France 600% UK Canada Italy Australia 500% 400% 300% 200% 100% Private wealth Government wealth 0% -100% Authors' computations using country national accounts. Government wealth = non-financial assets + financial assets - financial liabilities (govt sector)
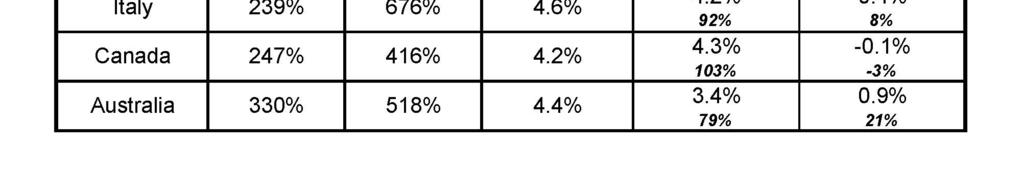
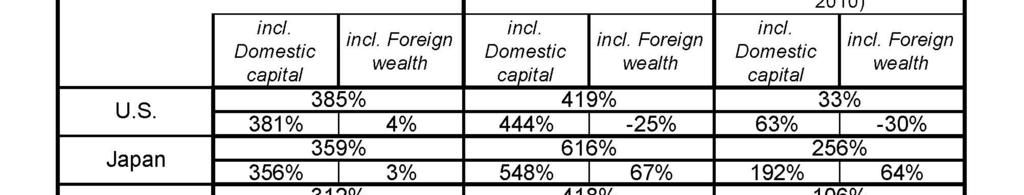
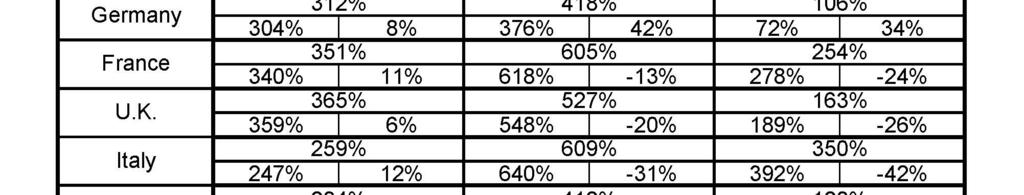
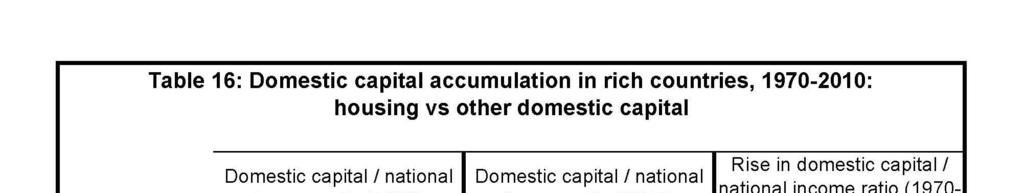
27 Lesson 1: one-good capital accumulation model with factor substitution works relatively well in very long run; but in short & medium run, volume effects (saving flows) can be vastly dominated by relative price effects (capital gains or losses) Lesson 2: long run wealth-income ratios β=s/g can vary a lot btw countries: s and g determined by diff. forces; countries with low g and high s naturally have high β; high β is not bad per se (capital is useful); but high β raises new issues about capital regulation and taxation: With integrated capital markets, this can generate large net foreign asset positions, even in the absence of income diff (or reverse to income diff); so far net positions are smaller than during colonial period; but some countries positions are rising fast (Japan, Germany,.) With limited capital mobility, and/or home portfolio biais, high β can lead to large domestic asset price bubbles: see Japan, UK, Italy, France, Spain,.
28 What have we learned? Rising top income shares & rising wealth-income ratios involve two different mechanisms that can reinforce each other; both have important implications for taxation & regulation Without international coordination (e.g. automated information exchange on cross border asset positions), it is hard to implement the proper policy It is high time to put distribution back at the center of economic analysis
29 Supplementary slides
30
31
32
33
34 Top 1% share: Continental Europe, North vs South (L-shaped), Top Percentile Share (in percent) France Germany Spain Italy Sweden
35
36
37
38
39
40 800% Private wealth / national income ratios in Europe, % Germany 600% France 500% UK 400% 300% 200% 100% Authors' computations using country national accounts. Private wealth = non-financial assets + financial assets - financial liabilities (household & non-profit sectors)
41 800% Private wealth / national income ratios % USA 600% Europe 500% 400% 300% 200% 100% Authors' computations using country national accounts. Private wealth = non-financial assets + financial assets - financial liabilities (household & non-profit sectors)
42 800% The changing nature of national wealth, UK (% national income) 700% 600% 500% 400% 300% 200% Net foreign assets Other domestic capital Housing Agricultural land 100% 0% National wealth = agricultural land + housing + other domestic capital goods + net foreign assets
43 Concepts & methods National income Y = domestic output Y d + r NFA Private wealth W = non-financial assets + financial assets financial liabilities (household & non-profit sector) β = W/Y = private wealth-national income ratio Govt wealth W g = non-fin + fin assets - fin liab (govt sector) National wealth W n = W + W g = K + NFA with K = domestic capital (= land + housing + other domestic k) NFA = net foreign assets β n = W n /Y = national wealth-national income ratio Domestic output Y d = F(K,L) (L = labor input) (e.g. K α L 1-α ) Capital share α = r β (r = average rate of return to wealth)
44 One-good capital accumulation model: W t+1 = W t + s t Y t β t+1 = β t (1+g wt )/(1+g t ) With 1+g wt = 1+s t /β t = saving-induced wealth growth rate) 1+g t = Y t+1 /Y t = exogenous output growth rate (productiv.+pop) With fixed saving rate s t =s and growth rate g t =g, then: β t β= s/g (Harrod-Domar-Solow steady-state formula) E.g. if s=10% & g=2%, then β = 500% Pure accounting formula: valid with any saving motive or utility function, i.e. wherever s comes from Wealth or bequest in the utility function: saving rate s set by u() (intensity of wealth or bequest taste) and/or demographic structure; then β=s/g follows Dynastic utility: rate or return r set by u(); if α set by technology, then β = α/r follows (s=αg/r, so β=α/r=s/g) With general utility functions, both s and r are jointly determined by u() and technology
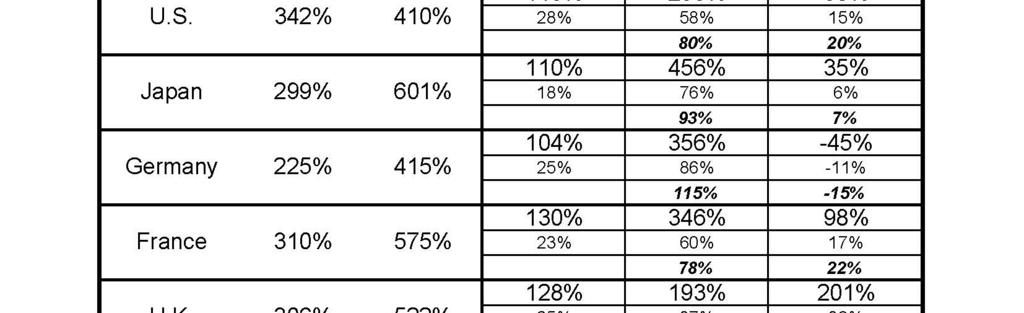
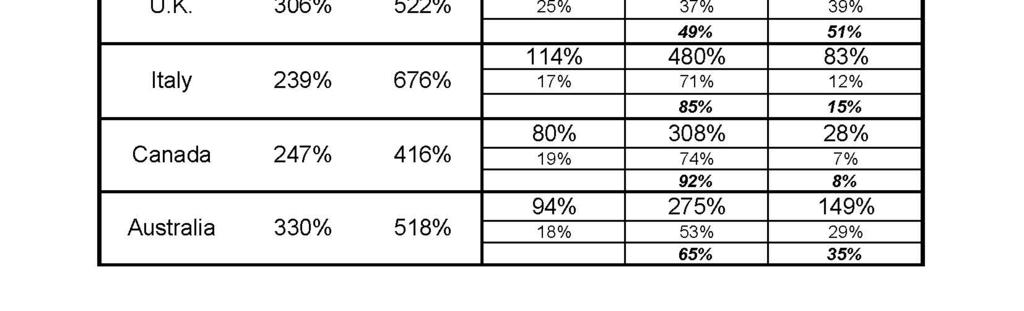
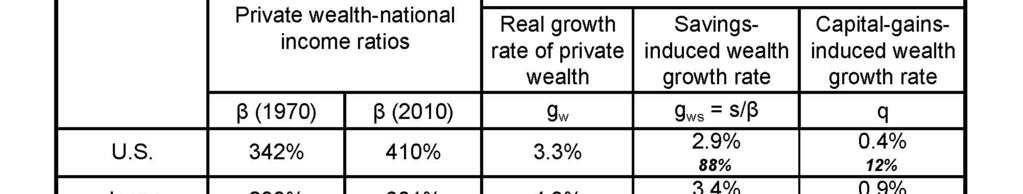
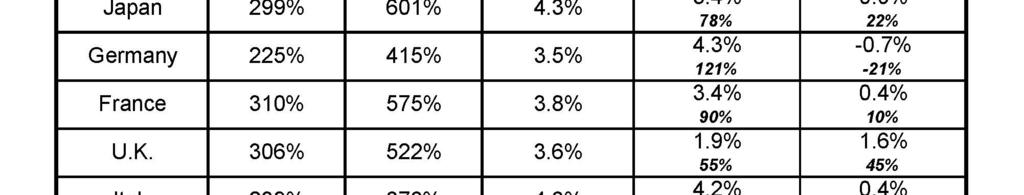
45 Two-good capital accumulation model: one capital good, one consumption good Define 1+q t = real rate of capital gain (or capital loss) = excess of asset price inflation over consumer price inflation Then β t+1 = β t (1+g wt )(1+q t )/(1+g t ) With 1+g wt = 1+s t /β t = saving-inducedwealthgrowthrate 1+q t = capital-gains-induced wealth growth rate Our empirical strategy: - we do not specify where q t come from (maybe stochastic production functions to produce capital vs consumption good, with diff. rates of technical progress); - we observe β t,..,β t+n, s t,..,s t+n, g t,..,g t+n, andwedecompose the wealth accumulation equation between years t and t+n into volume (saving) vs price effect (capital gain or loss)
46 Table 2: Growth rate vs private saving rate in rich countries, Real growth rate of national income Population growth rate Real growth rate of per capita national income Net private saving rate (personal + corporate) (% national income) U.S. 2.8% 1.0% 1.8% 7.7% Japan 2.5% 0.5% 2.0% 14.6% Germany 2.0% 0.2% 1.8% 12.2% France 2.2% 0.5% 1.7% 11.1% U.K. 2.2% 0.3% 1.9% 7.3% Italy 1.9% 0.3% 1.6% 15.0% Australia 3.2% 1.4% 1.7% 9.9%
47 Observed vs predicted private wealth / national income ratio (2010) Observed wealth / income ratio % 650% 600% 550% 500% 450% 400% 350% 300% Italy Japan France U.K. Australia U.S. Canada Germany 300% 350% 400% 450% 500% 550% 600% 650% 700% Predicted wealth / income ratio 2010 (on the basis of 1970 initial wealth and cumulated saving flows) (additive decomposition, incl. R&D)
48
49
50
51 900% National wealth / national income ratios, % 700% 600% USA Germany UK Canada Japan France Italy Australia 500% 400% 300% 200% 100% Authors' computations using country national accounts. National wealth = private wealth + government wealth
52 Observed vs predicted national wealth/national income ratio (2010) 700% Observed wealth / income ratio % 600% 550% 500% 450% 400% 350% 300% Italy France Japan Australia U.K. U.S. Canada Germany 300% 350% 400% 450% 500% 550% 600% 650% 700% Predicted wealth / income ratio 2010 (on the basis of 1970 initial wealth and cumulated saving flows) (additive decomposition, incl. R&D)
53
54 900% National vs foreign wealth, (% national income) 800% 700% 600% USA Germany UK Canada Japan France Italy Australia 500% 400% 300% 200% 100% National wealth Net foreign wealth 0% -100% Authors' computations using country national accounts. Net foreign wealth = net foreign assets owned by country residents in rest of the world (all sectors)

55
56 110% National income / domestic product ratios, % USA Germany UK Canada Japan France Italy Australia 100% 95% 90% Authors' computations using country national accounts. National income = domestic product + net foreign income
57 900% 800% 700% 600% USA Germany UK Canada Domestic capital / output ratios, Japan France Italy Australia 500% 400% 300% 200% 100% Authors' computations using country national accounts. Domestic capital/output ratio = (national wealth - foreign wealth)/domestic product


58
Inequality in America : The 1% in International and Historical Perspective
 Inequality in America : The 1% in International and Historical Perspective Thomas Piketty Paris School of Economics Columbia University, September 27 2012 Inequality & capitalism in the long run Long run
Top incomes in historical and international perspective: Recent developments
 Top incomes in historical and international perspective: Recent developments Facundo Alvaredo EMod/Nuffield College & Conicet & Paris School of Economics Inequality in the and Europe Top Incomes, Poverty
44 Economic Perspectives
 44 Economic Perspectives Source: Kotlikoff (1988), p. 44 In Hundreds 70 Of Dollars 60 50.. 40. 30 ;-*** * s EARNINGS 20 -CONSUMPTION 10 10 20 30 40 50 60 70 Age 1910 1920 1930 1940 1950 1960 Year Fig.
Seven Lean Years Explaining Persistent Global Economic Weakness
 Seven Lean Years Explaining Persistent Global Economic Weakness 9 June 2015 Bank of Canada and European Central Bank Conference Tim Lane Deputy Governor Bank of Canada The global economy remains weak and
Rising Income Inequality
 Rising Income Inequality Prof. Lutz Hendricks Econ520 February 21, 2017 1 / 37 The issues Income inequality has been rising for the past 35 years. Why has this happened? What could be done about it? We
Distributional National Accounts: Methods and Estimates for the United States
 Distributional National Accounts: Methods and Estimates for the United States Thomas Piketty (PSE) Emmanuel Saez (UC Berkeley) Gabriel Zucman (UC Berkeley) November 2016 There is a large disconnect today
Figure 1a. Top 1% income share: China vs USA vs France
 22% 20% 18% 16% Figure 1a. Top 1% income share: China vs USA vs China USA 14% 12% 10% 8% 6% 4% 1978 1982 1986 1990 1994 1998 2002 2006 2010 2014 Distribution of pretax national income (before taxes and
Wealth Inequality in the United States since 1913
 Wealth Inequality in the United States since 1913 Emmanuel Saez (UC Berkeley) Gabriel Zucman (LSE) JRCPPF 4 th Annual Conference 19 February 2015 Is rising inequality in the United States only a labor
Figure 1: Gini coefficient
 0.50 Figure 1: Gini coefficient Gini coefficient 0.45 0.40 0.35 0.30 All Workers Men Women 1940 1950 1960 1970 1980 1990 2000 Source: Kopczuk, Saez, Song QJE'10: Wage earnings inequality Year Top 10% Pre-
Rossana Merola ILO, Research Department
 Raising tax revenues without harming equity and employment Rossana Merola ILO, Research Department G-24 Special Workshop on Growth and Reducing Inequality Geneva, 5 th - 6 th September 2017 The views expressed
Grasshoppers, Ants and Locusts: the future of the world economy
 Ralph Miliband Series on the Restructuring of World Power Grasshoppers, Ants and Locusts: the future of the world economy Martin Wolf Associate editor and chief economics commentator, Financial Times Professor
The Economic Outlook. Economic Policy Division
 The Economic Outlook Economic Policy Division Glass Half Full Six years of steady growth Real GDP Outlook Percent Change, Annual Rate 10 5 0-5 -10 1980 1985 1990 1995 2000 2005 2010 2015 Glass Half Full
The Shifts and the Shocks Martin Wolf, Associate Editor & Chief Economics Commentator, Financial Times
 The Shifts and the Shocks Martin Wolf, Associate Editor & Chief Economics Commentator, Financial Times Peterson Institute for International Economics 9 th October 2014 Washington DC The Shifts and the
The U.S. Economic Recovery: Why so weak and what should be done? William J. Crowder Ph.D.
 The U.S. Economic Recovery: Why so weak and what should be done? William J. Crowder Ph.D. Weak Recovery? It s no secret that the U.S. economy has still not fully recovered from the financial crisis and
The structure of the euro area recovery
 The structure of the euro area recovery Rolf Strauch, Chief Economist JPMorgan Investor Seminar, IMF Annual Meetings Washington, October 2017 The euro area: a systemic player in global trade Trade openness
Session 4. Growth. The World Economy Share of Global GDP Year 2011 (PPP)
") Session 4. Growth Stylized Facts on Standards of Living across Countries Characterizing Growth over 1 Years: The US Economy Growth Dynamics of the G7 Countries and the OECD Economies Characterizing Growth
Session 4. Growth Stylized Facts on Standards of Living across Countries Characterizing Growth over 1 Years: The US Economy Growth Dynamics of the G7 Countries and the OECD Economies Characterizing Growth
An early warning system to predict house price bubbles
 An early warning system to predict house price bubbles Christian Dreger, Konstantin Kholodilin DIW Berlin Why is the topic relevant? Bubbles in housing prices can impede the real economic evolution Prices
2019 ECONOMIC FORECAST AND FINANCIAL MARKET UPDATE
 2019 ECONOMIC FORECAST AND FINANCIAL MARKET UPDATE January 14, 2019 Scott Colbert, CFA Executive Vice President Director of Fixed Income & Chief Economist scott.colbert@commercebank.com GLOBAL GROWTH EXPECTATIONS
Concentration trends in Europe
 Concentration trends in Europe Professor Tommaso Valletti Chief Competition Economist, DG COMP Disclaimer: The views expressed are those of the authors and cannot be regarded as stating an official position
The Rise of China and Breaking out the Middle- Income Trap in Latin America and the Caribbean countries: A New Structural Economics Approach
 The Rise of China and Breaking out the Middle- Income Trap in Latin America and the Caribbean countries: A New Structural Economics Approach Justin Yifu Lin Senior Vice President and Chief Economist The
2016 LERA Winter Meetings Inequality in Japan Session. Top Income Shares and Income Mobility in Japan. Chiaki Moriguchi*
 2016 LERA Winter Meetings Inequality in Japan Session Top Income Shares and Income Mobility in Japan Chiaki Moriguchi* chiaki@ier.hit-u.ac.jp Institute of Economic Research, Hitotsubashi University Second
THE ICELANDIC ECONOMY AN IMPRESSIVE RECOVERY BUT WHAT CHALLENGES LIE AHEAD?
 THE ICELANDIC ECONOMY AN IMPRESSIVE RECOVERY BUT WHAT CHALLENGES LIE AHEAD? FROM BUST TO BOOM. AN EPIC BUST After 16 years of growth with a short pause for breath in 2002, the Icelandic economy entered
College/high school median annual earnings gap,
 College/high school median annual earnings gap, 1979 2012 In constant 2012 dollars 70,000 dollars Household gap $30,298 to $58,249 60,000 50,000 40,000 Male gap $17,411 to $34,969 30,000 20,000 10,000
Great Depressions of the Twentieth Century Project
 Great Depressions of the Twentieth Century Project Timothy J. Kehoe and Edward C. Prescott www.greatdepressionsbook.com Cole and Ohanian, The Great Depression in the United States from a Neoclassical Perspective,
Keynesian Macroeconomics for the 21 st Century Part 3: Demand Dynamics, Inequality and Secular Stagnation
 Keynesian Macroeconomics for the 21 st Century Part 3: Demand Dynamics, Inequality and Secular Stagnation YSI INET Lectures Edinburgh, Scotland October, 2017 Steven Fazzari Washington University in St.
The U.S. Economic Outlook
 The U.S. Economic Outlook Presented to: Maquiladora Industry Outlook Conference September 29 2006 Presented by: Patrick Newport Principal, U.S. Macroeconomic Service 781-301-9125 patrick.newport@globalinsight.com
U.S. Overview. Gathering Steam? Tuesday, October 1, 2013
 U.S. Overview Gathering Steam? Tuesday, October 1, 2013 Uneven global economic recovery Annual real GDP growth projections (%) Projections 2013 2014 World 3.1 3.1 3.8 United States 2.2 1.7 2.7 Euro Area
RBC Economics Financial Update Dawn Desjardins
 RBC Economics Financial Update Dawn Desjardins CICA/RBC Q4 2011 Business Monitor Economic Results Overview Business and Economic Optimism Begin to Stablize 100 % 80 % 60 % 40 % 20 % 0 % National Optimism
Outline. Overview of globalization. Global outlook for real economic activity & inflation. Risks to the outlook
 2017 International Economic Outlook Everett Grant Research Economist Globalization & Monetary Policy Institute Federal Reserve Bank of Dallas October 2017 The views expressed are those of the author and
sector: recent developments VÍTOR CONSTÂNCIO
 The economy and the banking sector: recent developments VÍTOR CONSTÂNCIO January 2006 Recent performance of the economy and prospects Factors behind the period of slow growth Challenges to the Banking
US imports from emerging economies have grown rapidly
 US imports from emerging economies have grown rapidly Ratio to GDP (current dollars) 0.07 US merchandise imports, 1978 2008 0.06 0.05 0.04 0.03 0.02 Industrial Non-OPEC other 0.01 0 OPEC = Organization
Canada s Standard of Living in 2042: Will Policy Keep Pace with Technology?
 Carleton University, Ottawa March 2-4, 2017 Canada s Standard of Living in 2042: Will Policy Keep Pace with Technology? Christopher Gunn, Carleton University Hashmat Khan, Carleton University Conference
Economic Outlook March Economic Policy Division
 Economic Outlook March 212 Economic Policy Division Real GDP Outlook Percent Change, Annual Rate 2 1 1 - -1 197 197 198 198 199 199 2 2 21 U.S. GDP Actual and Potential Quarterly, Q1 197 to Q4 211 Real
Recent Fiscal Developments and Outlook: The April 2014 IMF Fiscal Monitor Julio Escolano
 Recent Fiscal Developments and Outlook: The April 214 IMF Fiscal Monitor Julio Escolano Division Chief, Fiscal Policy and Surveillance Fiscal Affairs Department, IMF Joint Vienna Institute, Vienna, June,
Comment on: Productivity Growth, Wage Growth and Unions by Kügler, Schönberg and Schreiner
 Comment on: Productivity Growth, Wage Growth and Unions by Kügler, Schönberg and Schreiner Michael C. Burda Humboldt-Universität zu Berlin, CEPR and IZA ECB Forum Sintra, 20 June 2018 What this paper does
Macroeconomics Measurements
 Macroeconomics Measurements Thomas Chaney Sciences Po Thomas Chaney (Sciences Po) Macroeconomics Measurements 1 / 33 Housekeeping issues Instructor: Thomas Chaney (myself) Email: thomas.chaney@gmail.com
After the British referendum
 Future of Europe After the British referendum Broader issues for the UK and the EU David Marsh, Managing Director, OMFIF 27 October 2016 Nicosia 1 European politics moves against integration A new phase
URBAN LAND INSTITUTE
 URBAN LAND INSTITUTE 2012 ULI FALL MEETING (Denver, 18 October 2012) The Global Economic Outlook Dark clouds on the horizon Andrea Boltho Magdalen College University of Oxford Oxford Economics and REAG
India: Can the Tiger Economy Continue to Run?
 India: Can the Tiger Economy Continue to Run? India s GDP is on the rise US$ trillions Nominal GDP (left axis) GDP growth (right axis) 3.0 2.5 2.0 1.5 1.0 0.5 0.0 1990 1992 1994 1996 1998 2000 2002 2004
The Aftermath of Global Financial Crises
 The Aftermath of Global Financial Crises Carmen M. Reinhart, University of Maryland, NBER, and CEPR Brookings Institution Washington DC, April 20, 2009 This talk is based on several works with Kenneth
Impacts of the Global Economy on Asia Pacific Travel. 29 June 2007 John Walker
 Impacts of the Global Economy on Asia Pacific Travel 29 June 2007 John Walker jwalker@oxfordeconomics.com Oxford Economics Founded in 1981 Over 300 clients including blue chip companies and government
The Euro Area: A Reality Check
 Fletcher School, Tufts University The Euro Area: A Reality Check Prof. George Alogoskoufis Monetary Cooperation in Europe Four sub-periods in the evolution of monetary cooperation in the European Union.
The Baltic economies: Current situation and future trends, possibilities and pitfalls
 The Baltic economies: Current situation and future trends, possibilities and pitfalls Riga, 15 October 2015 Morten Hansen Head of Economics Department, Stockholm School of Economics in Riga Member of the
Financial Stability Implications of Changing Global Finance: Policy Panel Global Finance in Transition
 Financial Stability Implications of Changing Global Finance: Policy Panel Global Finance in Transition May 7 and 8, 2013 İstanbul, Turkey Outline 1 The Financial System 2 Weak Growth 3 4 5 Unprecedented
Panel on Post-Crisis Growth Performance Determinants, Effects and Policy Implications
 Panel on Post-Crisis Growth Performance Determinants, Effects and Policy Implications Carmen M. Harvard University Bank of Canada and European Central Bank Conference Ottawa, June 8-9, 2015 1 Outline (i)
The Eurozone integration, des-integration and possible future developments
 The Eurozone integration, des-integration and possible future developments 18 th Monetary Policy Workshop at the Berlin School of Economcs and Law, 12 13 October 2017 Overview Position 1: The euro itself
The U.S. Economy How Serious A Downturn? Nigel Gault Group Managing Director North American Macroeconomic Services
 The U.S. Economy How Serious A Downturn? Nigel Gault Group Managing Director North American Macroeconomic Services Growth Is Cooling; But a Soft Landing Is Likely (Real GDP, annualized rate of growth)
Macroeconomic Imbalances in
 Macroeconomic Imbalances in the Euro Area Jürgen von Hagen Rome, 21 May 2011 Europe: Growing imbalances within, balanced without 8 6 4 2 0-2 -4-6 10 Figure 1A: Current Account Balances IE EL FR FI IT SE
Deficit Reduction and Economic Growth: Are They Mutually Exclusive Goals? Tuesday, May 1, 2012; 2:30 PM - 3:45 PM
 Deficit Reduction and Economic Growth: Are They Mutually Exclusive Goals? Tuesday, May 1, 2012; 2:30 PM - 3:45 PM Moderator: Gillian Tett, U.S. Managing Editor, Financial Times Speakers: Jared Bernstein,
RISI EUROPEAN CONFERENCE. (Barcelona, 6 March 2018) The European Economy Things look good just now. Can this last?
 The European Economy Things look good just now. Can this last?") RISI EUROPEAN CONFERENCE (Barcelona, 6 March 2018) The European Economy Things look good just now. Can this last? Andrea Boltho Magdalen College University of Oxford and Oxford Economics CONCLUSIONS OF
RISI EUROPEAN CONFERENCE (Barcelona, 6 March 2018) The European Economy Things look good just now. Can this last? Andrea Boltho Magdalen College University of Oxford and Oxford Economics CONCLUSIONS OF
Issues in the Long-Term Economic Outlook for Canada
 Policy and Economic Analysis Program Rotman School of Management University of Toronto Issues in the Long-Term Economic Outlook for Canada Office of the Chief Actuary Canada Pension Plan Seminar September
QSPS Conference. May, 2013 Utah State University
 QSPS Conference Ayşe Imrohoro¼glu May, 2013 Utah State University QSPS Conference Long-run Japanese Saving Rate 0.30 0.25 Japan 0.20 Saving Rate 0.15 0.10 U.S. 0.05 0.00 1956 1961 1966 1971 1976 1981 1986
RISI LATIN AMERICAN CONFERENCE. (São Paulo, 16 August 2016) The Latin American Economy: Some Successes, Many Disappointments
 The Latin American Economy: Some Successes, Many Disappointments") RISI LATIN AMERICAN CONFERENCE (São Paulo, 16 August 2016) The Latin American Economy: Some Successes, Many Disappointments Andrea Boltho Magdalen College University of Oxford and Oxford Economics GDP
RISI LATIN AMERICAN CONFERENCE (São Paulo, 16 August 2016) The Latin American Economy: Some Successes, Many Disappointments Andrea Boltho Magdalen College University of Oxford and Oxford Economics GDP
It s the economy stupid!
 It s the economy stupid! (and it doesn t have to be this way!) October 28, 2011 Alameda, CA Sylvia A. Allegretto, PhD Center on Wage & Employment Dynamics University of California, Berkeley The critical
Labor Markets. Chris Edmond NYU Stern. Spring 2007
 Labor Markets Chris Edmond NYU Stern Spring 2007 1 Today Labor market indicators employment, unemployment, participation Labor supply and demand Cross-country comparisons of labor market outcomes Labor
Globalisation, States and Markets. Economics Commentator, Financial Times, London
 Globalisation, States and Markets Martin Wolf, Associate Editor & Chief Economics Commentator, Financial Times, London Braudel Institute Sao Paolo 4 th October 2010 Globalisation, states and markets 1.
The Herzliya Indices. National Security Balance The Civilian Quantitative Dimension. Herzliya Conference Prof. Rafi Melnick, IDC Herzliya
 The Herzliya Indices National Security Balance The Civilian Quantitative Dimension Herzliya Conference 2015 Prof. Rafi Melnick, IDC Herzliya 1990 1991 1992 1993 1994 1995 1996 1997 1998 1999 2000 2001
Airlines, the economy and air transport demand
 Airlines, the economy and air transport demand Brian Pearce, Chief Economist, IATA www.iata.org/economics Airline Industry Economics Advisory Workshop 2016 1 Returns for airlines investors lower this year;
The productivity puzzle: why improving labour productivity is critical for Europe s economic (and political) stability
 stability") The productivity puzzle: why improving labour productivity is critical for Europe s economic (and political) stability P. Subacchi, M. Colagrossi Nomura Foundation Macro Economy Research Conference PRODUCTIVITY,
The productivity puzzle: why improving labour productivity is critical for Europe s economic (and political) stability P. Subacchi, M. Colagrossi Nomura Foundation Macro Economy Research Conference PRODUCTIVITY,
Paul Bingham Managing Director, Global Trade and Transportation February 18, 2009
 Economic Outlook and Ports Paul Bingham Managing Director, Global Trade and Transportation February 18, 2009 The Outlook for Trade Depends on Goods Demand Integrated international supply-chains offer efficiencies
Economic Analysis What s happening with U.S. potential GDP growth?
 Economic Analysis What s happening with U.S. potential GDP growth? Kan Chen Capital stock, labor, and productivity do not show a significant increase following the recent fiscal stimulus According to our
Economic Transformation and Recovery in Hong Kong and Singapore
 School of Economics and Finance, The University of Hong Kong Presentation given at the followings : - Zonta Club 1999 Accountancy Conference, Vocational Training Council on October 8, 1999 The Society
Federal Reserve Bank of Dallas, FIRM (Financial Institution Relationship Management)
") The Economic Roller Coaster: Where Have We Been? And Where Are We Going? Thomas F. Siems, Ph.D. Senior Economist and Director of Economic Outreach Federal Reserve Bank of Dallas Economic Summit Dallas
The Economic Roller Coaster: Where Have We Been? And Where Are We Going? Thomas F. Siems, Ph.D. Senior Economist and Director of Economic Outreach Federal Reserve Bank of Dallas Economic Summit Dallas
MONETARY AND FISCAL POLICIES DURING THE NEXT RECESSION
 OXYGEN EVENTS CONFERENCE GALA PERFORMANCE 2017 MONETARY AND FISCAL POLICIES DURING THE NEXT RECESSION - THE CASE OF ROMANIA - Ph.D. Andrei RĂDULESCU Senior Economist, Banca Transilvania Researcher, Institute
The U.S. & Global Economic Outlook Greg Ip, U.S. Economics Editor, The Economist Remarks to The American Sportfishing Association
 The U.S. & Global Economic Outlook Greg Ip, U.S. Economics Editor, The Economist Remarks to The American Sportfishing Association Hilton Head, S.C. Oct. 9, 2012 How We Got Here Great Moderation = More
First Lecture Capitalism: A Brief History
 Nitzan / 3270 GPE I I. Capitalism: A Brief History / 1 First Lecture Capitalism: A Brief History Definition Economic system? Private ownership / profit motive / wage labour Beginnings 16 th century: Feudal
National Responses to the Eurozone Crisis
 National Responses to the Eurozone Crisis Which Labour Market Reform Strategy? Germany, Netherlands, Spain and Ireland Introduction What has been the policy response of European and national actors to
Outlook 2008/09 Life In the Aftermath of the Great Global Credit Crisis. May 8 th, Presented by:
 Outlook 2008/09 Life In the Aftermath of the Great Global Credit Crisis May 8 th, 2008 Presented by: Patricia Croft, Vice President & Chief Economist Phillips, Hager & North Investment Management Limited
Assessing household balance sheet and risks three challenges 1
 IFC Satellite meeting at the ISI Regional Statistics Conference on Is the household sector in Asia overleveraged: what do the data say? Kuala Lumpur, Malaysia, 15 November 2014 Assessing household balance
16. Key Facts about Long Run Economic Growth
 Fletcher School, Tufts University 16. Key Facts about Long Run Economic Growth E212 Macroeconomics Prof. George Alogoskoufis How we Measure and Compare Living Standards Living standards are usually measured
Abel M. Mateus Universidade Nova de Lisboa
 Abel M. Mateus Universidade Nova de Lisboa It is widely known the success of Asian Tigers But is less known that Portugal was one of the few countries, similar to the Asian Tigers, that changed from a
The Great Convergence: China, India and the new global economy. Mark Thirlwell Program Director, International Economy July 2006
 The Great Convergence: China, India and the new global economy Mark Thirlwell Program Director, International Economy July 2006 India Two views of the largest economies in 2005 Top 12 economies by GDP,
BC Pension Forum. Economic Outlook. Presented by: Ben Homsy, CFA Portfolio Manager
 BC Pension Forum Economic Outlook Presented by: Ben Homsy, CFA Portfolio Manager 1694 1704 1713 1723 1732 1741 1751 1760 1770 1779 1788 1798 1807 1817 1826 1836 1845 1854 1864 1873 1883 1892 1901 1911
International Economic Shocks and the Challenges of International Corporations
 RIETI Policy Symposium International Economic Shocks and the Challenges of International Corporations Ryuhei Wakasugi Research Counselor, RIETI Professor Kyoto University and Keio University R. Wakasugi
Market Update. Randy Tinseth Vice President, Marketing Boeing Commercial Airplanes. Copyright 2016 Boeing. All rights reserved.
 Market Update The statements contained herein are based on good faith assumptions are to be used for general information purposes only. These statements do not constitute an offer, promise, warranty or
Chief Economist s Report
 Chief Economist s Report 22 February 2017 IATA Legal Symposium, Washington Brian Pearce Chief Economist, IATA Airline Industry Economics Advisory Workshop 2016 1 Themes 1. World economy still stuck on
Global Economic Outlook
 Global Economic Outlook Mark A. Wynne Vice President & Associate Director of Research Director, Globalization & Monetary Policy Institute Federal Reserve Bank of Dallas Presentation to Vistas Conference
Spring Press Conference February 23, Name of chairman
 Spring Press Conference February 23, 2006 Disclaimer This presentation contains forward looking statements which reflect Management s current views and estimates. The forward looking statements involve
By making use of SAFRIM (South African Inter-Industry Macro-Economic Model) By Jeaunes Viljoen, Conningarth Economists, 1
 By Jeaunes Viljoen, Conningarth Economists, 1") By making use of SAFRIM (South African Inter-Industry Macro-Economic Model) By Jeaunes Viljoen, Conningarth Economists, South Africa 10/13/2011 1 1960: The economy experienced high growth rates mining
By making use of SAFRIM (South African Inter-Industry Macro-Economic Model) By Jeaunes Viljoen, Conningarth Economists, South Africa 10/13/2011 1 1960: The economy experienced high growth rates mining
Top 1% Income Share and Top MTR
 Source: IRS, Statistics of Income Division, Historical Table 23 Top 1% Income Share and Top MTR Top 1% Income Shares (%) 0 5 10 15 20 25 Top 1% (excluding Capital Gains) Top MTR 0 10 20 30 40 50 60 70
SA economic review Kevin Lings. August 2018
 SA economic review Kevin Lings August 2018 South Africa real GDP growth year-on-year %y/y 8 7 6 5 Ave 4.3% 4 Ave 2.5% 3 2 Ave 0.9% 1 0-1 -2-3 00 01 02 03 04 05 06 07 08 09 10 11 12 13 14 15 16 17 18 2
Can Manufacturing Still be a Driver of
 Can Manufacturing Still be a Driver of Inclusive Growth? Robert Z Lawrence Albert L Williams Professor of Trade and Investment Harvard Kennedy School Senior Fellow, MasterCard Center for Inclusive Growth
Maximizing Tourism Marketing Investments A Canadian Perspective
 Maximizing Tourism Marketing Investments A Canadian Perspective Understanding the potential of markets Economics: GDP; Inflation; Unemployment; Employment; Disposable Income; Private Consumption; Consumer
Global Economic Outlook: From Fiscal Cliff to Rushcliffe in 15 minutes. Tom Rogers. Lead Economist, Oxford Economics.
 Global Economic Outlook: From Fiscal Cliff to Rushcliffe in 15 minutes Tom Rogers Lead Economist, Oxford Economics trogers@oxfordeconomics.com 16 th January 2013 Overview External environment showing signs
Puget Sound Regional Forecast Chris Mefford Community Attributes
 2015 Puget Sound Regional Forecast Chris Mefford Community Attributes 3 1,000s The Regional Economy has added jobs consistently for nearly 5 full years. In a few months, this will be the longest streak
Beyond market forces: a story of changing economic inequalities in rich countries
 Beyond market forces: a story of changing economic inequalities in rich countries Virginia Maestri Social Inequalities in Europe, Athens 20 June 2014 The views expressed in this presentation are solely
Oil Crises and Climate Challenges 30 Years of Energy Use in IEA Countries
 Crises and 30 Years of Energy Use in IEA Countries Fridtjof Unander, International Energy Agency ISED Meeting, UN, 13 September 2004 Aim of the Study Review of trends in energy use and CO 2 emissions since
Better in than out? Economic performance inside and outside the European monetary union. Roma, Rapporto Europa 2015
 Better in than out? Economic performance inside and outside the European monetary union Rapporto Europa 2015 Roma, 9.7.2015 1 Table of Content I. The political threat Why European monetary union? II. Europe
De-Globalization: Does That Word Mean What You Think it Means?
 De-Globalization: Does That Word Mean What You Think it Means? Presentation to 35 Annual Monetary & Trade Conference Mykyta Vesselovsky, Ph.D. Office of the Chief Economist Global Affairs Canada April
Growth Strategies and Dynamics in Developing Countries. Michael Spence Hamilton Project/CGD Forum Washington D.C. April 14, 2008
 Growth Strategies and Dynamics in Developing Countries Michael Spence Hamilton Project/CGD Forum Washington D.C. April 14, 2008 1 The Focus The subject is sustained high inclusive growth and the policies,
Texas Housing Markets: Metropolitan vs. Border Communities. September 22, 2014
 Texas Housing Markets: Metropolitan vs. Border Communities Luis Bernardo Torres Ruiz, Ph.D. Research Economist El Paso Branch Dallas Federal Rio Grande Economic Association September 22, 2014 Contents
North American Forging Shipment Forecast (Using FIA bookings information through December 2013)
") North American Forging Shipment Forecast 2014-2018 (Using FIA bookings information through December 2013) Percent Change Year Ago Best leading indicator combination for impression die bookings used to
North American Forging Shipment Forecast 2014-2018 (Using FIA bookings information through December 2013) Percent Change Year Ago Best leading indicator combination for impression die bookings used to
Understanding the interest-rate growth differential: its importance in long-term debt projections and for policy
 Understanding the interest-rate growth differential: its importance in long-term debt projections and for policy David Turner, OECD UN DESA Expert Group Meeting on the World Economy, LINK Project October
The Economic Outlook. Economic Policy Division
 The Economic Outlook Economic Policy Division Glass Half Full Six plus years of moderate growth Real GDP Outlook Percent Change, Annual Rate 10 5 0-5 -10 1980 1985 1990 1995 2000 2005 2010 2015 Glass Half
The Global Economy: Sustaining Momentum
 The Global Economy: Sustaining Momentum David J. Stockton Senior Fellow Peterson Institute for International Economics Chief Economist Monetary Policy Analytics October 5, 2017 What s Driving the Global
The Impacts of Policy and Macroeconomic Conditions on Horse Markets
 www.agmanager.info The Impacts of Policy and Macroeconomic Conditions on Horse Markets December 2011 (available at www.agmanager.info) Mykel Taylor, Assistant Professor, Department of Agricultural Economics
The outlook: what we know, the known unknowns and the unknown unknowns
 The outlook: what we know, the known unknowns and the unknown unknowns 24 April 2017 Seoul Brian Pearce, Chief Economist, IATA www.iata.org/economics Airline Industry Economics Advisory Workshop 2016 1
Economic & Financial Market Outlook
 Economic & Financial Market Outlook BC Pension Forum March 1, 2013 Chris Lawless, Chief Economist Overview Global forces Recent economic performance ~ US, Europe, Japan, China ~ Other emerging markets
The Future of Growth in CESEE
 The Future of Growth in CESEE Presentation at EBRD London, 13 February 2018 Bas B. Bakker Senior Regional Resident Representative for Central, Eastern and Southeastern Europe CESEE had a very deep crisis
National Transfer Accounts in Mexico
 National Transfer Accounts in Mexico Policy implications: labor market Iván Mejía Guevara imejiag@stanford.edu Stanford University 12th Global Meeting of the NTA Network, Mexico City, July 23-27, 2018