THE FIRST WTE IN BRAZIL. Sergio Guerreiro Ribeiro President, WTERT-Brasil
|
|
|
- Sara Stevenson
- 5 years ago
- Views:
Transcription


1 THE FIRST WTE IN BRAZIL Sergio Guerreiro Ribeiro President, WTERT-Brasil
2 Table of Contents 1. Location of WTE Power Plant 2. Current State of Waste Management in Brazil 3. Electric Sector in Brazil 4. BARUERI, SP First WTE Project in Brazil 5. Financial Model
3


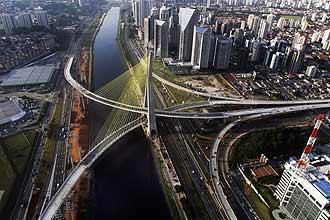


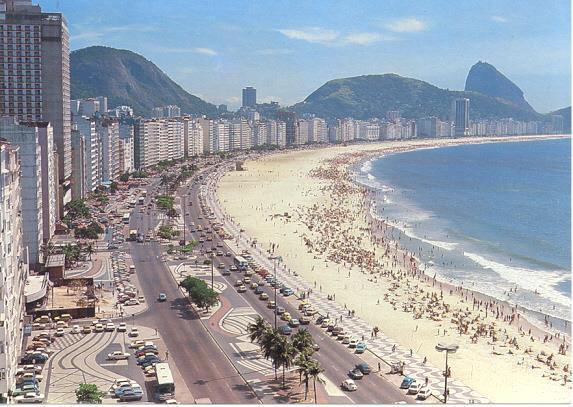


4 6,500,000 inhab 12,000,000 inhab São Paulo Rio de Janeiro
")

5 STATE OF SAO PAULO (INDUSTRY, AGRICULTURE, FINANCIAL,SERVICES) STATE OF RIO DE JANEIRO 400 km APPROX US$ 540 Billion (35% of Brazil)


6 APPROX US$ 14 Billion Per capita GDP ~ US$ 53,000 WTE PLANT 25 km
7
8 MSW GENERATION APPROXIMATELY 80,000,000 Mt/year ONLY 59% OF COLLECTED MSW TO SANITARY LANDFILLS (91%)
 Caieiras Landfill, São")


9 Currently only Landfill Gas No WTE (incineration) Caieiras Landfill, São Paulo 29.5 MWe Salvador Landfill, Bahia 20.0 MWe Bandeirantes Landfill, São Paulo 20.0 MWe MOST SANITARY LANDFILLS IN BRAZIL BURN THE BIOGAS IN FLARES - NO ENERGY GENERATION

 (ABIPET) Aluminum Cans 98% recycling high value + low")
10 RECYCLING IN BRAZIL Most recycling is done before official collection by informal recyclers Statistics not accurate Only a few streams have reliable numbers from the Industry 51% ANNUAL PAPER RECYCLING in BRAZIL 2015 (ibá/anap) PET BOTTLES RECYCLING EVOLUTION IN BRAZIL (x 1,000 Mt) (ABIPET) Aluminum Cans 98% recycling high value + low income people
11

12 ELECTRIC SECTOR IN BRAZIL GUIDELINES OVERSEEING PRESIDENT PLANNING REGULATION COMMERCIALIZATION SYSTEM OPERATION VERY WELL ORGANIZED

13 REGULATED MARKET FREE MARKET COMMERCIALIZATION ANEEL AUCTIONS + RENEWABLE /WTE(LIMIT) PPA BETWEEN GENERATORS AND TRADERS/COSTUMERS GENERATORS CANNOT DELIVER ENERGY SOLD. THEY BUY IN THE FREE MARKET (SPOT PRICES)
")
14 TOTAL INSTALLED CAPACITY GW HYDROTHERMAL SYSTEMS HIGHLY DEPENDENT ON WATER STORAGE NG/OIL ARE STAND BY AND DISPACHED (VERY EXPENSIVE) ONLY WHEN RESERVOIRS ARE LOW LEVEL BIOMASS/NUCLEAR/WTE ARE INFLEXIBLE THERMAL PLANTS
15


16 14.7 MW X 8,000 h

17


18 18% of Brazil s MSW -6 States including Rio de janeiro
19 IN USA LHV ~ 11,000 kj/kg 64 MWth ~ 500 TPD 908 TPD LHV 6090 kj/kg POINT H* 27,51 ton/h = 660 TPD LHV 8374 kj/kg
20

21 POWER CALCULATION HEAT INPUT = 64 MWth NET EFFICIENCY = 23%
22
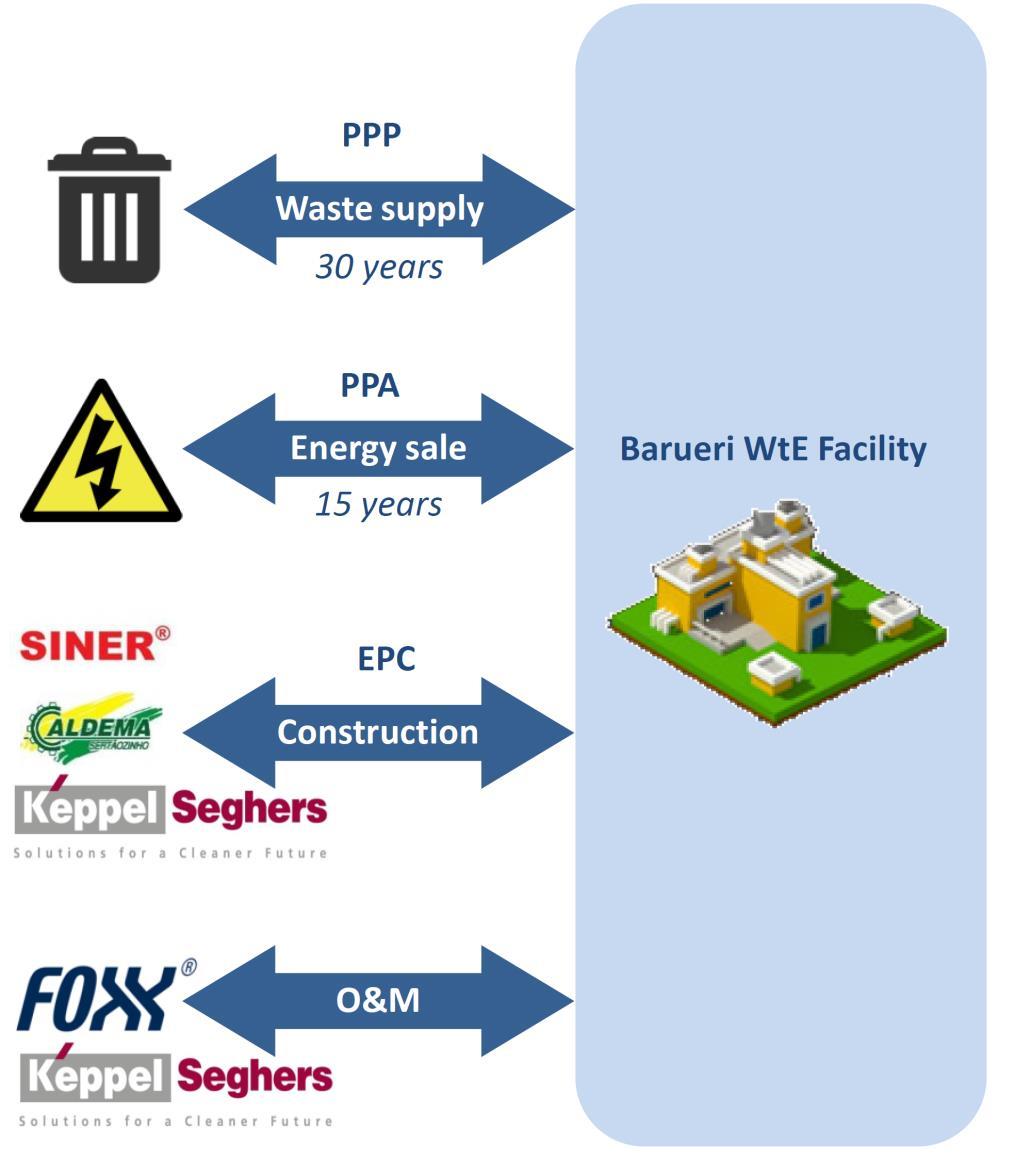
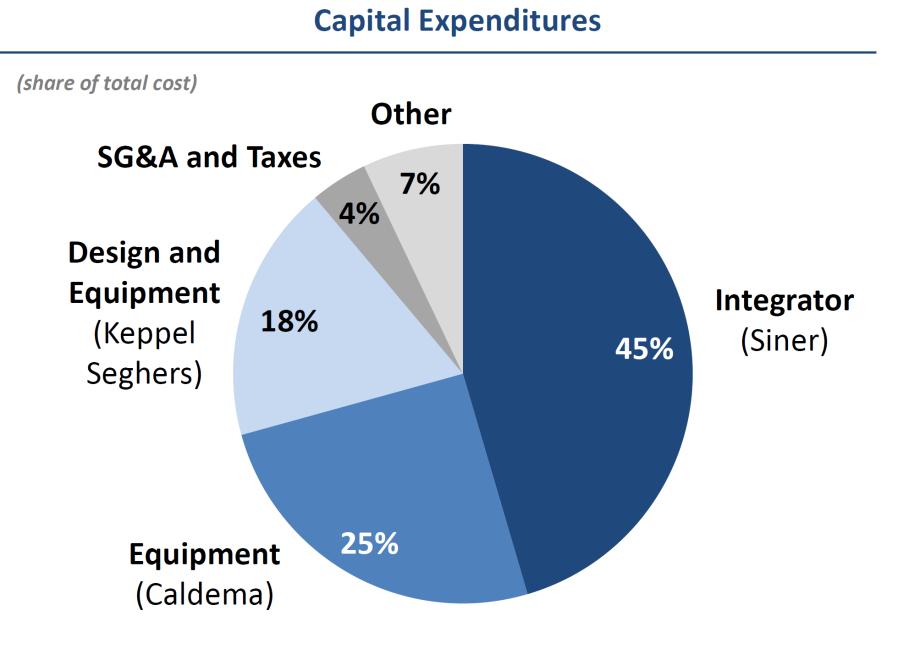
23 Key Assumptions General Information Project Greenfield Operation Start February/2020 Contract PPP PPP period 30 years Revenues Gate fee and energy sale (PPA) Projections period Installation License issued November/2015 Taxes Regime Presumed/Real Construction Start April/2017 Model base Nominal terms Macro Assumptions Impact on Model IPCA 4.80% 4.50% 4.50% 4.50% 4.50% % IGP-M 5.00% 5.00% 5.00% 5.00% 5.00% % CPI 2.00% 2.00% 2.00% 2.00% 2.00% % Inflation index to adjust gate fee (Barueri / Energy Price Spot) and PPA / costs and expenses Inflation index to adjust gate fee (Carapicuiba and Jundiai) Inflation index to adjust carbon credits price / IFC supervision fee TR 1.12% 0.75% 0.50% 0.50% 0.50% % Loan index of Caixa loan CDI 11.09% 8.68% 8.41% 8.35% 8.27% % Loan index of IFC loan IMRT* 5.00% 5.00% 2.50% 0.00% 0.00% % Index to adjust energy price PPA FX Avg Carbon credits price / IFC supervision fee *Average Index Tariff Readjustment defined in the PPA agreement between the URE-Barueri and CEMIG, applied in April of each year (beyond inflation) based on COMERC estimatives. Source: Santander 10/28/2016. Note: All assumptions & projections per Company model/bf Capital
24 Revenue Drivers Boiler Capacity MSW Operational Assumptions Plant Availability Days per month (average) 825 tons/day 8,000 hours/year Months per year 12 Hours per day 24 Approximately 40% of the MSW comes from Barueri Municipality, through a PPP contract of 30 years period, and the other 60% comes through shorter term contracts or Waste Supply Agreement with Tecipar (Carapicuíba and Jundiaí Municipalities) (R$ / ton) Gate Fee By Municipality Barueri Jundiaí Carapicuíba The Gate fee considers only the cost of final disposal, i.e. discounted the collection and transportation costs (in the case of Jundiaí and Carapicuíba) Pricing data as of 2017 Source: FoxxHaztec. Note: All assumptions and projections per Company model Energy Operational Assumptions Installed Capacity Gross Power Generation Capacity Internal Power Consumptions 20 MW 17.3 MW 12.14% Power Loss 3.00% Net Power Generation (for sale) 14.7 MW Consider the sale of energy generated beyond that sold to CEMIG (11,5MW) to the market at R$ 230/MWh Energy Production and Price PPA Agreement with CEMIG (11,5MW - 15 years - until 2032) Date: April 2017 Price: R$ / MWh Quantity of Energy sold: MWh/ year Market (energy beyond the PPA requirement (approx. 3.2MW) Date: 2016 Price: R$ / MWh Quantity of Energy sold: MWh/ year Carbon Credits Carbon credits revenues represent only 0.1% of total revenues of the SPV Price US$ 2,70 per tco2 Year tco2 3 4, , , , , , , , , ,472 Carbon credit generation curve defined in the PDD (Project Design Document) prepared by the World Bank
25 Barueri Revenue Breakdown Revenues (R$ Millions) Energy revenues in 2018 and 2019 refers to energy purchased in the market to sell to CEMIG to comply with the contract PPA total of 11.5MW Approximately 50% energy / 50% tipping fee MSW Energy Carbon Credits Net Revenues Source: FoxxHaztec/BF Capital Note: All assumptions and projections per Company model
26 Barueri Breakdown of Costs & Expenses O&M Costs (R$ millions) The cost in 2018 relates to the purchase of 100% incentivized energy in the market at R$ 230/MWh to meet the PPA agreement with CEMIG Variations in O&M costs are most due to variations in maintenance cost curve which was developed by RESA Fitchner, a well known engineering company Variable Costs Fixed Costs Other Variable Costs Other Expenses Source: FoxxHaztec./BF Capital Note: All assumptions and projections per Company model
27 Profitability EBITDA and % Margin The EBITDA in 2018 relates to the purchase of 100% incentivized energy in the market at R$230/MWh and sale to CEMIG in order to meet the PPA Contract EBITDA EBITDA Margin 72% 74% 76% 73% 75% 70% 74% 72% 74% 80.0% 70.0% 60.0% 50.0% % % 19% 15% % % 0.0% Net Income and % Margin 100.0% Net Income Net Margin 80.0% 60.0% 39% 25% 26% 33% 34% 40.0% 11% 13% 17% 19% % (2) (9) % % (7%) (26%) -40.0% Source: FoxxHaztec. Note: All assumptions and projections per Company model

28
Feasibility analysis of MSW mass burning in the Region of East Macedonia Thrace in Greece
 Feasibility analysis of MSW mass burning in the Region of East Macedonia Thrace in Greece D.A. Tsalkidis 1, C.J. Athanasiou 1, S. Kalogirou 2 and E.A. Voudrias 1 1 Department of Environmental Engineering,
The data inputs and assumptions underlying this Reference Case are described in the Assumptions Book.
 MEMORANDUM To: From: Caroline Garber, Chief, Environmental Studies Section, WI DNR Kris Krause, Co-Chair, GWTF Technical Advisory Committee George Edgar, Co-Chair, GWTF Technical Advisory Committee Glen
Financial annexes
 2019-2021 Financial annexes Agenda Macro scenario Thermal generation Renewables Infrastructure & Networks Retail Enel Group 62 2019-2021 Macro scenario Macro scenario GDP, CPI, FX GDP (%) CPI (%) FX against
Techno-economic assessment of potential CCS deployment in the Southern African region
 Techno-economic assessment of potential CCS deployment in the Southern African region, ERC in conjunction with World Bank Dubrovnik, Croatia, 4th May 2011 Techno-economic assessment of potential CCS deployment
2016 Electric Resource Plan Modeling Assumptions Update
 Page 1 of 16 Public Service Company of Colorado 2016 Electric Resource Plan Modeling Assumptions Update (CPUC ) August 2017 xcelenergy.com 2016 Xcel Energy Inc. Xcel Energy is a registered trademark of
ANNUAL RESULTS PRESENTATION. 20 March, 2014 Hong Kong
 ANNUAL RESULTS PRESENTATION 20 March, 2014 Hong Kong Content Ⅰ Ⅱ Financial Highlights Business Performance Ⅲ Trend and Objectives Ⅳ Outlook and Perspectives Financial Highlights Total Assets (RMB billion)
2013 Integrated Resource Plan September 24, 2012
 2013 Integrated Resource Plan September 24, 2012 Planning Reserve Margin Methodology Price Scenarios 1 Agenda Planning Reserve Margin Methodology Price Scenarios / Modeling Methodology Natural Gas Carbon
CHAPTER FIVE COST VOLUME PROFIT ANALYSIS OF DELHI METRO
 CHAPTER FIVE COST VOLUME PROFIT ANALYSIS OF DELHI METRO Delhi metro as a commercial organization operates with the objective of maximizing the profit. So, it is required to consider the above before proceeding
Alloy Production Is Brazil Back Online?
 Alloy Production Is Brazil Back Online? Singapore, March 23 rd, 2016 No part of this publication may be reproduced, stored in a retrieval system, or transmitted in any form or by any means electronic,
Q PRESENTATION 18 OCTOBER 2018
 Q3 2018 PRESENTATION 18 OCTOBER 2018 Group Highlights Q3 2018 Very strong growth in revenue and operating profit outside of Denmark. In Denmark, acceptance of self-cleaning in September allows Atea to
Unlevered Project Cashflows
 Energy Price Energy Price 1 2 3 4 5 6 7 8 9 10 11 12 13 14 15 16 17 18 19 20 21 22 23 24 25 26 27 28 29 30 31 32 33 34 35 36 37 38 39 40 41 42 43 44 45 46 47 48 49 50 51 52 53 54 55 56 57 58 59 60 61 62
Webinar: Trends in renewable energy support
 Webinar: Trends in renewable energy support Is the Spanish case a forerunner for the rest of the EU? Matthew Jones Senior Analyst EU Power & Carbon Anise Ganbold Senior Analyst EU Power & Carbon 12 July
Total Retail Electric Customers
 Model Inputs New Resource Cost and Production Characteristics Integration and Ancillary Services Costs Historical Weather and Retail Load Forecast Carbon Costs GenTrader PowerSimm Cost and Energy Contribution
FINANCIAL ANALYSIS. Stoby
 FINANCIAL ANALYSIS Stoby INVESTMENTS AND FINANCING Investments planned over the period : Investments 2018 2019 2020 2021 Intangible assets Company creation 1 500 Web platform development 8 290 Accounting
Big Changes, Unknown Impacts
 Big Changes, Unknown Impacts Boulder Economic Forecast Place cover image here Richard Wobbekind Senior Economist and Associate Dean for Business and Government Relations January 17, 2018 Real GDP Growth
Distributed generation spiral of growth. Isaac Dyner, Sebastián Zapata, Maritza Jiménez, Mónica Castañeda Nivalde de Castro and GESEL group
 Distributed generation spiral of growth Isaac Dyner, Sebastián Zapata, Maritza Jiménez, Mónica Castañeda Nivalde de Castro and GESEL group Content 1 2 3 4 5 6 7 Introduction Energy trend Rethinking traditional
Europe June Craig Menear. Chairman, CEO & President. Diane Dayhoff. Vice President, Investor Relations
 Europe June 2016 Craig Menear Chairman, CEO & President Diane Dayhoff Vice President, Investor Relations Forward Looking Statements and Non-GAAP Financial Measurements Certain statements contained in today
RESULTS OF THE 2017 INDUSTRY DATA SURVEY
 RESULTS OF THE 2017 INDUSTRY DATA SURVEY 2017 Survey (2016 DATA) 187 Companies 2017 Survey 36% of US Ready Mixed (2016 Concrete DATA) Production 187 Companies 36% of US Ready Mixed Concrete Production
The end of the macroeconomic adjustment? Economic Department
 The end of the macroeconomic adjustment? Economic Department Political stress and Government Yield Curve Yield Curve - Brazil 0#DIJ: Yield 15,8 15,655 15,655 15,6 15,4 YC; 0#DIJ:; Trade Price; Realtime;
Preliminary Unaudited Financial Results for 2016
 REGULATORY ANNOUNCEMENT March 9 th, 2017 Fortuna Entertainment Group N.V. Preliminary Unaudited Financial Results for 2016 Amsterdam - Fortuna Entertainment Group N.V. announces its preliminary unaudited
Annual results Accell Group 2016
 Annual results Accell Group 2016 Amsterdam, 10 March 2017 René J. Takens, CEO Hielke H. Sybesma, CFO Agenda 1. Key results 2016 2. Strategy 3. Outlook 10 March 2017 Accell Group N.V. presentation annual
FY 2017 Results Presentation H Results Presentation. Milan, 24 th April Milan, 27 th July 2018
 FY 2017 Results Presentation Milan, 24 th April 2018 2018 1H Results Presentation Milan, 27 th July 2018 FY 2017 Results Presentation Milan, 24 th April 2018 Audience & Advertising gen-16 feb-16 mar-16
Spring Press Conference February 23, Name of chairman
 Spring Press Conference February 23, 2006 Disclaimer This presentation contains forward looking statements which reflect Management s current views and estimates. The forward looking statements involve
Ensuring Reliability in ERCOT
 Ensuring Reliability in ERCOT Beth Garza Director, ERCOT IMM bgarza@potomaceconomics.com 512-225-7077 February 27, 2018 2 Data Comparisons ERCOT Population (million) 24 80 Germany Annual electricity consumption
2016 American Academy of Actuaries. All rights reserved. May not be reproduced without express permission. ADDITIONAL LIABILITY ASSUMPTION OVERVIEW
 2016 American Academy of Actuaries. All rights reserved. May not be reproduced without express permission. ADDITIONAL LIABILITY ASSUMPTION OVERVIEW Agenda Model Validation/Governance of Assumptions General
The City of Toronto s Long-Term Financial Direction
 The City of Toronto s Long-Term Financial Direction Introduction The City has been able to achieve balanced budgets on an annual basis, despite underlying concerns regarding sustainability. The staff report:
FY 2017 Results Presentation Q Results Presentation. Milan, 24 th April Milan, 15 th May 2018
 FY 2017 Results Presentation Milan, 24 th April 2018 2018 1Q Results Presentation Milan, 15 th May 2018 FY 2017 Results Presentation Milan, 24 th April 2018 Audience & Advertising gen-16 feb-16 mar-16
Recommendation BRL BRL % + HOLD. Stock Chart SMALL UPSIDE Target Price. Current Price. Target Price (10/19) RENT3
 RENT3") TEAM K Recommendation Target Price BRL 44.40 Current Price Target Price BRL 41.00 +8.30% + HOLD (10/19) Stock Chart 50 43 RENT3 44.40 36 29 22 SMALL UPSIDE Sep 15 Dec 15 Mar 16 Jun 16 Sep 16 Source: Bloomberg,
TEAM K Recommendation Target Price BRL 44.40 Current Price Target Price BRL 41.00 +8.30% + HOLD (10/19) Stock Chart 50 43 RENT3 44.40 36 29 22 SMALL UPSIDE Sep 15 Dec 15 Mar 16 Jun 16 Sep 16 Source: Bloomberg,
ANALYZING THE SHIP DISPOSAL OPTIONS
 Chapter Six ANALYZING THE SHIP DISPOSAL OPTIONS Chapters Two through Five examined the option of long-term storage and the three ship-disposal options: domestic recycling, overseas recycling, and reefing.
India: Can the Tiger Economy Continue to Run?
 India: Can the Tiger Economy Continue to Run? India s GDP is on the rise US$ trillions Nominal GDP (left axis) GDP growth (right axis) 3.0 2.5 2.0 1.5 1.0 0.5 0.0 1990 1992 1994 1996 1998 2000 2002 2004
Annual Stockholders Meeting May 12, President s Report 2013 Results of Operations
 Annual Stockholders Meeting May 12, 2014 President s Report 2013 Results of Operations 1 2013 GDP Growth Philippines +7.2% Thailand +2.9% Malaysia +4.7% Singapore +4.1% Indonesia +5.8% Source: Bangko Sentral
Inside Brazil: The Leading Auto Manufacturers and Suppliers. Augusto Amorim
 Inside Brazil: The Leading Auto Manufacturers and Suppliers Augusto Amorim Brazil Beyond Soccer and Carnival World Soccer Cup winner five times World s most popular Carnival World s 6th largest light vehicle
sector: recent developments VÍTOR CONSTÂNCIO
 The economy and the banking sector: recent developments VÍTOR CONSTÂNCIO January 2006 Recent performance of the economy and prospects Factors behind the period of slow growth Challenges to the Banking
Canadian Teleconference: Can the Canadian Economy Survive the Turmoil in the United States?
 Canadian Teleconference: Can the Canadian Economy Survive the Turmoil in the United States? Nigel Gault Chief U.S. Economist Dale Orr Canadian Macroeconomic Services Copyright 2008 Global Insight, Inc.
Multidimensional Analysis
 Multidimensional Analysis of Macro Sustainability of Russia: New Methods for Measuring Progress Dr Stanislav Shmelev, Senior Research Fellow, Oxford University, UK E-mail: s.shmelev@ouce.ox.ac.uk Tel:
KANISA RUNGJANG UW - Madison
 Port cost comparisons and productivity from public funding: Port of Milwaukee and Port of Green Bay KANISA RUNGJANG UW - Madison National Center for Freight & Infrastructure Research & Education Port cost
BREMBO. more than brakes
 BREMBO more than brakes Brembo at a glance Sustainable growth Q1 2006 results Brembo at a glance World leader in luxury and top of the range automotive applications Passengers Cars: Top 10% of world production
The Israeli Economy 2009 The Caesarea Center Conference
 The Israeli Economy 2009 The Caesarea Center Conference Provost, Interdisciplinary Center (IDC) Herzliya The Big Issues The broken crystal ball A crisis that happens once in 100 years From a country oriented
Main Outlook update results and drivers Wildcards and Emerging Issues
 The outlook for agricultural markets in the next decade: focus on price variability Jacinto Fabiosa Co-Director, FAPRI (515) 294-6183 jfabiosa@iastate.edu FAPRI Food and Agricultural Policy Research Institute
President and Chief Executive Officer Federal Reserve Bank of New York Washington and Lee University H. Parker Willis Lecture in Political Economics
 The U.S. Economic Outlook Chartspresented by WilliamC Dudley Charts presented by William C. Dudley President and Chief Executive Officer Federal Reserve Bank of New York Washington and Lee University H.
Portuguese Market Outlook up to 2040
 Portuguese Market Outlook up to 2040 POYRY A report to APREN Disclaimer The results and conclusions here presented are the outcome of an outsourced study developed by Pöyry, with APREN s guidance, but
Global Mineral Commodity Prices: Perspectives and Trends
 17 th Brazilian Mining Congress and EXPOSIBRAM 2017 Global Mineral Commodity Prices: Perspectives and Trends When Will the Market Hit Deficit: Risks, Opportunities, China s Changing Consumption Pattern,
TECHNICAL COMMERCIAL OFFER TURBOGENERATOR UNITS «TURBOSPHERE»
 TECHNICAL COMMERCIAL OFFER TURBOGENERATOR UNITS «TURBOSPHERE» ТGU 28.11.23-001-29475178-2017 Turbogenerator units TurboSphere TGU 1 Dear sirs! We suggest you to consider the possibility of electric energy
How to Explain Car Rental to Banks and Investors
 How to Explain Car Rental to Banks and Investors Scott White Senior Managing Director, Head of Investment Banking C.L. King & Associates March 8-9, 2011 Las Vegas Hilton 1 My Background 18 Years Advising
Issues Driving the Outlook for Specialty Crops December 3, 2012
 Issues Driving the Outlook for Specialty Crops December 3, 2012 Daniel A. Sumner University of California Agricultural Issues Center, and UC Davis Department of Agricultural and Resource Economics Core
PROVINCE OF SASKATCHEWAN INVESTOR PRESENTATION
 PROVINCE OF SASKATCHEWAN INVESTOR PRESENTATION May 2018 THE SASKATCHEWAN DIFFERENCE Economic Stability Diversified economy balances cyclicality of resources Growing population Majority government with
Alley OUR BUSINESS SUMMARY
 Alley OUR BUSINESS SUMMARY Table of Contents Introduction to Strike Bowling Alley 1 Our Organizational Model 2 Revenue Streams 3 Personnel & Job Creation 4 Location Selection & New Construction 5 Bowling
The U.S. Economy How Serious A Downturn? Nigel Gault Group Managing Director North American Macroeconomic Services
 The U.S. Economy How Serious A Downturn? Nigel Gault Group Managing Director North American Macroeconomic Services Growth Is Cooling; But a Soft Landing Is Likely (Real GDP, annualized rate of growth)
Economic Outlook March Economic Policy Division
 Economic Outlook March 212 Economic Policy Division Real GDP Outlook Percent Change, Annual Rate 2 1 1 - -1 197 197 198 198 199 199 2 2 21 U.S. GDP Actual and Potential Quarterly, Q1 197 to Q4 211 Real
Economic Analysis of Farmland Market: An Introduction
 Economic Analysis of Farmland Market: An Introduction Dr. Wendong Zhang Assistant Professor of Economics wdzhang@iastate.edu FIN 450X, Feb 17 th, 2017 A Quick Introduction: Dr. Wendong Zhang Grown up in
National and Virginia Economic Outlook Professor Robert M. McNab Dragas Center for Economic Analysis and Policy Strome College of Business
 National and Virginia Economic Outlook Professor Robert M. McNab Dragas Center for Economic Analysis and Policy Strome College of Business October 24, 2018 The forecasts and commentary do not constitute
Regulatory Update. April 2017
 Regulatory Update April 2017 Disclaimer This Presentation has been prepared by ADMIE Holding and is a presentation of general background information about ADMIE (IPTO) S.A. regulatory issues provided solely
NATURAL RESOURCE ACCOUNTING: MINERAL ACCOUNTS FOR SOUTH AFRICA
 NATURAL RESOURCE ACCOUNTING: MINERAL ACCOUNTS FOR SOUTH AFRICA 1980 2000 Discussion Document Background information on natural resource accounting in Statistics South Africa Statistics South Africa (Stats
2016 Indiana Renewables Study & 2015 Forecast
 2016 Indiana Renewables Study & 2015 Forecast Presented by: Douglas J. Gotham, Director State Utility Forecasting Group Purdue University Presented to: Interim Study Committee on Energy, Utilities, and
Energy Efficiency in California Some Possible Lessons for Ontario 20 March 2006
 Energy Efficiency in California Some Possible Lessons for Ontario 20 March 2006 Arthur H. Rosenfeld, Commissioner California Energy Commission (916) 654-4930 ARosenfe@Energy.State.CA.US http://www.energy.ca.gov/commission/commissioners/rosenfeld.html
Agricultural Outlook: Rebalancing U.S. Agriculture
 Agricultural Outlook: Rebalancing U.S. Agriculture Michael J. Swanson Ph.D. Agricultural Economist January 2018 2018 Wells Fargo Bank, N.A. All rights reserved. For public use. The U.S. Ag Sector renormalizes!
China at a glance 2011
 China at a glance 2011 GDP PPP Growth rate Per capita Value US$11.29 trillion 9.2% US$8,400 Ranking 3 7 119 Labor force Imports Exports Value 816.2 million US$1.74 trillion US$1.90 trillion Ranking 1 3
M e d i a s e t G r o u p
 M e d i a s e t G r o u p 9 th November 2004 2004 9-Month Results MEDIASET 2004 9M Whole Day Audience Trend 24H Individuals Jan- Sep Jan- Sep excluding EUROCUP OTHER SATELLITE OTHER TERRESTRIAL 43.3% 44.2%
WTERT (China) PROGRESS REPORT. ( )
 PROGRESS REPORT. ( )") WTERT (China) PROGRESS REPORT (2009-2010) http://www.wtert.cn AGENDA WTERT China website Testing Research on MSW in CWTERT Current research work in CTWERT Government supports Page 2 WEBSITE (http://www.wtert.cn)
WTERT (China) PROGRESS REPORT (2009-2010) http://www.wtert.cn AGENDA WTERT China website Testing Research on MSW in CWTERT Current research work in CTWERT Government supports Page 2 WEBSITE (http://www.wtert.cn)
Gas Turbine Performance Analysis
 Gas Turbine Performance Analysis Gas turbines may seem too complicated or overwhelming at first glance, but for regular field monitoring on a relative basis, it is not all that difficult. A regular check
2017 Renewable Energy Plan Public Service Company of Colorado February Volume 2. Hearing Exhibit 101 Attachment RLK-2 Page 1 of 12
 Hearing Exhibit 101 Page 1 of 12 2017 Renewable Energy Plan February 2016 Volume 2 xcelenergy.com 2016 Xcel Energy Inc. Xcel Energy is a registered trademark of Xcel Energy Inc., an Xcel Energy Company.
PROSPECTS FOR THE ENERGY MARKET
 PROSPECTS FOR THE ENERGY MARKET Manoel Zaroni Torres São Paulo, March 30, 2016 1 2008 2009 2010 2011 2012 2013 2014 2015 2016 2017 2018 2019 2020 2021 GDP: historical x projection 7.6% PIB Historical Histórico
THE BLUE SKY REPORT A KERRIGAN QUARTERLY. Third Quarter 2018 December 2018
 THE BLUE SKY REPORT A KERRIGAN QUARTERLY Third Quarter 2018 December 2018 Contact Erin Kerrigan: (949) 439-6768 erin@kerriganadvisors.com Contact Ryan Kerrigan: (949) 728-8849 ryan@kerriganadvisors.com
An Agricultural Update
 An Agricultural Update May 22, 2018 Indianapolis, IN David Oppedahl Senior Business Economist 312-322-6122 david.oppedahl@chi.frb.org Personal consumption shares 40% 30% 20% 10% 0% 1950 1960 1970 1980
Traffic Engineer s Annual Report
 Traffic Engineer s Annual Report Fiscal Year Ended June 30, 2012 STATE OF FLORIDA DEPARTMENT OF TRANSPORTATION Florida Department of Transportation January 22, 2013 Mrs. Nicola A. Liquori, C.P.A. Chief
District Cooling System at Kai Tak Development Content
 District Cooling System at Kai Tak Development Content Background District Cooling System (DCS) at Kai Tak Benefits of DCS DCS Connection Technical Guidelines for DCS Connection / Supply Rules on District
United Nations Conference on Trade and Development. TRADE AND DEVELOPMENT BOARD (62nd session)
") United Nations Conference on Trade and Development TRADE AND DEVELOPMENT BOARD (62nd session) Geneva, 14-25 September 2015 Item 6: Evolution of the international trading system and its trends from a development
United Nations Conference on Trade and Development TRADE AND DEVELOPMENT BOARD (62nd session) Geneva, 14-25 September 2015 Item 6: Evolution of the international trading system and its trends from a development
The Party Is Over U.S. Automotive Outlooks
 The Party Is Over U.S. Automotive Outlooks Yen Chen Senior Research Economist Center for Automotive Research Federal Reserve Bank of Chicago Economic Outlook Symposium December 1, 2017 U.S. Light Vehicle
Report from the Council
 Report from the Council NW Hydroelectric Association Spokane WA October 30, 2014 Tom Karier NW Power and Conservation Council Topics 1. Highlights of the 6 th Plan (2010) 2. What actually happened 3. What
ROLE OF COPPER IN CHILEAN ECONOMY
 ROLE OF COPPER IN CHILEAN ECONOMY Patricio Meller, Bernardo Lara & Gonzalo Valdés January 2010 1 Basic Data: Chile 2009 Population (millions) 17 Yn/cap (US$ PPP) 14,299 GDP (billions US$) 243 Territory
SUBJECT: AMENDING PORT OF LOS ANGELES TARIFF NO. 4, SECTION THREE, ITEM NO CHARGES FOR PILOTAGE
 RECOMMENDATION APPROVED; RESOLUTION NO. 17-8115 AND ORDER NO. 17-7222 ADOPTED; BY THE BOARD OF HARBOR COMMISSIONERS June 1,2017 w AMBER M. KLESGES Board Secretary LA THE PORT OF LOS ANGELES Executive Director's
Shifting International Trade Routes A National Economic Outlook. February 1, 2011
 Shifting International Trade Routes A National Economic Outlook February 1, 2011 Today s Objectives Endeavor to provide a broad context for today s program by briefly touching on: Some good news Some not
Half year results Accell Group 2017
 Half year results Accell Group 2017 Hielke Sybesma, Interim CEO & CFO Jeroen Snijders Blok, COO Jeroen Both, CSCO July 21, 2017 Agenda 1. Key results H1 2017 2. Strategy 3. Outlook July 21, 2017 Accell
IN THE MIDST OF A PHASE CHANGE
 IN THE MIDST OF A PHASE CHANGE NEW ZEALAND WIND ENERGY ASSOCIATION CONFERENCE, WELLINGTON 2014 KOBAD BHAVNAGRI TWITTER: @KOBADB / / // / Kobad Bhavnagri NZ Wind Energy Association Conference, April 2014
Spokane Sportsplex - Ice Only (DRAFT) (Spokane, WA) Five-Year Operating Pro Forma
 (Spokane, WA) Five-Year Operating Pro Forma") Spokane Sportsplex - Ice Only () (Spokane, WA) Five-Year Operating Pro Forma Date: October 2015 Developed for: Spokane Public Facilities District Note: SFA has no responsibility to update this financial
Spokane Sportsplex - Ice Only () (Spokane, WA) Five-Year Operating Pro Forma Date: October 2015 Developed for: Spokane Public Facilities District Note: SFA has no responsibility to update this financial
Earnings per share. Full year dividend. Return on equity p p 19.6%
 Earnings per share 22.20p Return on equity 19.6% Full year dividend 14.35p Who New Position Background Net release from operations 1,411m Adjusted operating profit 1,628m Profit after tax 1,265m Earnings
SFSA Business Outlook Raymond Monroe
 SFSA Business Outlook 2010 Raymond Monroe 815-455-8240 monroe@sfsa.org http://blog.american.com/?p=2991 Agriculture Workers http://www.worldmapper.org/display.php?selected=128 Population http://www.worldmapper.org/display.php?selected=2
CSAPR & MATS: Is Coal Doomed? Dallas Burtraw, Karen Palmer, Anthony Paul, Blair Beasley, and Matt Woerman
 CSAPR & MATS: Is Coal Doomed? Dallas Burtraw, Karen Palmer, Anthony Paul, Blair Beasley, and Matt Woerman Introduction Haiku Electricity Market Model Overview of results Large effect on SO 2 and mercury,
Retrenchment or Stagnation: Lessons from Japan s Lost Decades. Andrew Smithers. UK-Japan 21 st Century Group Conference 3 rd May, 2013
 Retrenchment or Stagnation: Lessons from Japan s Lost Decades. Andrew Smithers UK-Japan 21 st Century Group Conference 3 rd May, 2013 Slide 1. The Conventional Wisdom. Japan has suffered from two lost
BrazilianStatesFiscal Sustainability
 BrazilianStatesFiscal Sustainability VII Jornada Iberoamericana de Financiación Local Cartagena, Colombia(Sept-2018) Guilherme Tinoco, Economic Research Department guilherme.tinoco@bndes.gov.br The views
Running a Raffle. There are 3 types of Legal Wisconsin Raffles
 Running a Raffle Thank you for your interest in running a raffle to benefit United Way of Portage County. We know that raffles make great special events. Raffles conducted to benefit United Way of Portage
Agriculture and the Economy: A View from the Chicago Fed
 Agriculture and the Economy: A View from the Chicago Fed March 3, 2016 Riverside, Iowa David Oppedahl Senior Business Economist 312-322-6122 david.oppedahl@chi.frb.org Federal Reserve System Twelve District
HARLEY DAVIDSON Enjoy the Ride
 HARLEY DAVIDSON Enjoy the Ride Fia Consulting Alex Nicholas Rodrigo Vanessa Agenda Executive Summary Market Analysis Key Issue Recommendation Implementation Risks Financial Executive Summary $ USD $ 2Mi
By making use of SAFRIM (South African Inter-Industry Macro-Economic Model) By Jeaunes Viljoen, Conningarth Economists, 1
 By Jeaunes Viljoen, Conningarth Economists, 1") By making use of SAFRIM (South African Inter-Industry Macro-Economic Model) By Jeaunes Viljoen, Conningarth Economists, South Africa 10/13/2011 1 1960: The economy experienced high growth rates mining
By making use of SAFRIM (South African Inter-Industry Macro-Economic Model) By Jeaunes Viljoen, Conningarth Economists, South Africa 10/13/2011 1 1960: The economy experienced high growth rates mining
Puget Sound Regional Forecast Chris Mefford Community Attributes
 2015 Puget Sound Regional Forecast Chris Mefford Community Attributes 3 1,000s The Regional Economy has added jobs consistently for nearly 5 full years. In a few months, this will be the longest streak
Fact Sheet for Q3 and January-September 2012 October 24, 2012
 Fact Sheet for Q3 and January-September 2012 October 24, 2012 Contents Daimler Group Stock Market Information 3 Earnings and Financial Situation 4-13 Information for Divisions Mercedes-Benz Cars 14-17
2010 Current Situation
 2010 Current Situation Mário Russo / Luis Marinheiro Polytechnic Institute of Viana do Castelo APESB mariorusso@netcabo.pt SUMMARY Portugal: MSW overview 2010 Organization of the sector Some examples 2
PREDICTING MUNICIPAL SOLID WASTE GENERATION IN ANDORRA WITH SYSTEM DYNAMICS MODELLING. M. Pons, C. Pérez, J.J. de Felipe, E. Jover
 PREDICTING MUNICIPAL SOLID WASTE GENERATION IN ANDORRA WITH SYSTEM DYNAMICS MODELLING M. Pons, C. Pérez, J.J. de Felipe, E. Jover OUTLINE 1. INTRODUCTION - Modelling MSW generation - State of Art - Study
MSW Objective 1.1: Level of Service Standards To maintain the IMSWMS MSW collection system to meet or exceed established LOS standards.
 INFRASTRUCTURE - MUNICIPAL SOLID WASTE PURPOSE The purpose of the Solid Waste section of the Infrastructure Element is to ensure that necessary sanitation facilities and services are in place to provide
BRAZIL S INVESTMENT CLIMATE
 São Paulo Rio de Janeiro Brasília Curitiba Recife Belo Horizonte Campo Grande London Lisbon Shanghai Beijing Miami Buenos Aires Johannesburg BRAZIL S INVESTMENT CLIMATE - 2011 DURVAL DE NORONHA GOYOS JR.
Real Estate: Investing for the Future. Sponsored By:
 Real Estate: Investing for the Future Sponsored By: Percent Change, Year Ago 6 5 4 3 2 1 Real GDP Growth United States, 2000 Prices 0 1994 1995 1996 1997 1998 1999 2000 2001 2002 2003 2004 U.S. Employment
A Primer on Factors Affecting Farmland Values
 A Primer on Factors Affecting Farmland Values Federal Reserve Bank of Chicago David Oppedahl Business Economist 312-322-6122 david.oppedahl@chi.frb.org The economy hit bottom in June 2009, with hesitant
Geothermal Utilization in Iceland
 Geothermal Utilization in Iceland 85 Years of Experience ICEF 2014 Tokyo Bjarni Bjarnason CEO The Geothermal Resource 30 C/km The total amount of heat stored in the crust of the Earth is of the order of
Comparison of urban energy use and carbon emission in Tokyo, Beijing, Seoul and Shanghai
 International Workshop on Urban Energy and Carbon Modeling, February 5-6, 28, AIT Centre, Asian Institute of Technology, Pathumthani, Thailand Comparison of urban energy use and carbon emission in Tokyo,
ESB Ocean Energy Projects
 MRIA, February 2013 ESB Ocean Energy Projects Opportunities in an All-Islands Market John Fitzgerald ESB Ocean Energy Developing new lines of business for ESB and Ireland 200M Cleantech Fund Home Energy
More of the Same; Or now for Something Completely Different?
 More of the Same; Or now for Something Completely Different? C2ER Place cover image here Richard Wobbekind Chief Economist and Associate Dean for Business and Government Relations June 14, 2017 Real GDP
Full Report Available October 10th at
 Data & Policy Program Data-driven analysis to guide sustainable materials management MSW Management Facilities in the U.S. 2010 & 2013 Free Executive Summary Full Report Available October 10th at www.erefdn.org
UBS Annual Nordic Financial Services Conference Lars Aa. Løddesøl Group CFO - Storebrand
 UBS Annual Nordic Financial Services Conference 2013 Lars Aa. Løddesøl Group CFO - Storebrand 1 The Storebrand Group 100% of investments assessed by sustainability criteria 2.200 employees 40.000 corporate
Presentation from the USDA Agricultural Outlook Forum 2017
 Presentation from the USDA Agricultural Outlook Forum 2017 United States Department of Agriculture 93 rd Annual Agricultural Outlook Forum A New Horizon: The Future of Agriculture February 23-24, 2017
The RNVR Yacht Club Project Volunteer
 The RNVR Yacht Club Project Volunteer 1 Purchase of Volunteer The Committee of the RNVR YC was charged with the purchase of a yacht accordance with the resolution of the March 2013 EGM. That this meeting