RIETI World KLEMS Symposium Growth Strategy after the World Financial Crisis 2014 May 20, JP Tower & Conference, Tokyo.
|
|
|
- Clifton Bradford
- 5 years ago
- Views:
Transcription
1 RIETI World KLEMS Symposium Growth Strategy after the World Financial Crisis 2014 May 20, JP Tower & Conference, Tokyo Masahisa Fujita RIETI/Konan University/Kyoto University
2 1. Introduction: The Three Priority Viewpoints of RIETI In the face of rapid globalization, technological changes, and decreasing and aging population, i. how to incorporate the growth of the world economy? ii. iii. how to develop new growth areas? how to create new economic and social systems for sustainable growth? i ii iii enhancing the productivity and vitality of the Japanese economy and society in the long run Supporting the Third Arrow of Abenomics in the long run 2
3 2. The evolution of the global economy in the recent past: from the viewpoint of spatial economics Rapid Progress in ICT and Transport Technology together with the promotion of free trade through WTO FTAs EPAs Globalization of production trade investment and finance dense networks Local Agglomeration of production consumption R&D A Complex, Networked World Efficient and growth enhancing under normal conditions but Vulnerable to major local disasters / shocks 3
4 World GDP and Trade GDP (2005 price trillion dollar) GDP annual growth rate Trade annual growth rate : 3.2% : 5.6% : 3.0% : 6.5% : 2.0% : 5.1% : 3.9% : 8.8% Trade World GDP World Trade (Right scale) Source: UN National Accounts Statistics Database and WTO Time Series on International Trade 4
5 Impact of Decreasing Transport Costs ICT revolution TT development WTO / FTAs / EPAs major reduction in transport costs more even distribution of economic activity on earth? common sense the prediction of spatial economic theory only when transport costs become sufficiently low major agglomeration concentrated dispersion utilizing scale economies (home market effects) further reduction in transport costs 5


6 Source: the Earth at night 2012, NASA Earth Observatory/NOAA NGDC ( 6
7 50% 45% 40% 35% 30% 25% 20% 15% 10% 5% 0% GDP shares in the world total: East Asia, EU, NAFTA Three polars total (right scale) NAFTA EU East Asia % 80% 70% 60% 50% 40% 30% 20% 10% 0% East Asia = ASEAN 10 plus China, South Korea, Japan, Taiwan and Hong Kong Source: IMF World Economic Outlook database October 2013 By courtesy of Professor Nobuaki Hamaguchi 7
8 GDP shares within East Asia 80% 70% Japan 60% 50% 40% 30% 20% the Rest China Japan the Rest 10% 0% China Source: IMF World Economic Outlook database October 2013 By courtesy of Professor Nobuaki Hamaguchi 8
9 Income divergence / convergence in East Asia GDP per capita at 2005 price US$, Japan=1 1.6 Phase 1 Phase 2 Phase Philippines Japan=1 Singapore China Thailand Hong Kong Korea Taiwan Malaysia Vietnam Lao PDR (Source) Penn World Table Version 8.0 By courtesy of Professor Nobuaki Hamaguchi 9
10 Share of intra regional trade in each region 70% 60% 50% 40% 30% 20% EU27 EU15 East Asia NAFTA North East Asia ASEAN 10% 0% Source: RIETI TID By courtesy of Professor Nobuaki Hamaguchi 10
 Intermediate Goods Consumption Goods Asia USA Asia USA")
11 3. Is Asia still the World Factory? International Trade Structure (2006) Intermediate Goods Consumption Goods Asia USA Asia USA Source: 2008 White Paper on International Economy and Trade 11
12 Trade between the US and East Asia (billion US dollars) East Asia s Exports to the US China s Exports to the US US Exports to East Asia US Exports to China Figure 1. The Value of US Exports to China and East Asia and China s and East Asia s Exports to the US. Source: US Census Bureau. Note: East Asia includes China, Japan, Indonesia, Malaysia, the Philippines, Singapore, South Korea, Taiwan, and Thailand. (Figure made by Dr. Willem Thorbecke at RIETI) 12
13 US Trade Deficit (billion US dollars) 500 Trade Deficit with East Asia Trade Deficit with China Trade Deficit with non East Asian Countries Figure 2. US Trade Deficit with China, East Asia, and non East Asian Countries. Source: US Census Bureau. Note: East Asia includes China, Japan, Indonesia, Malaysia, the Philippines, Singapore, South Korea, Taiwan, and Thailand. (Figure made by Dr. Willem Thorbecke at RIETI) 13


14 East Asia today: the World Factory based on supply chain networks centered around dozens of major cities and industrial agglomerations Bangkok Tohoku Sendai 14
15 Agglomeration through snowball effects Example: auto/electric machinery industry set makers Domestic Overseas cars/ appliances parts materials auto / electric machinery suppliers of parts and materials labor capital key parts materials Domestic Overseas Key factors for agglomeration: scale economies and low transport cost 15
16 World parts and components trade shares by region 100% 90% 80% Intra Regional to the ROW NAFTA 70% 60% Intra Regional EU 50% to the ROW 40% 30% 20% Intra Regional East Asia 10% to the ROW 0% Source: RIETI TID ROW: Rest of the World By courtesy of Prof. Nobuaki Hamaguchi 16
17 4. Auto Industry: global supply chain and its vulnerability 25,000,000 Automobile production by area (All types) China 20,000,000 15,000,000 Europe NAFTA Japan + Korea 10,000,000 5,000,000 South America ASEAN South Asia Source: OICA 17
18 Automobile production in ASEAN 2,500,000 2,000,000 1,500,000 1,000, , Source: OICA Thailand Indonesia Malaysia Philippines Vietnam 18
19 Automobile industry (together with supporting industries) production of a car assembling 20,000~30,000 parts scale economies in production low transport costs each key part produced at only one (or a few) locations in Japan (or East Asia) multilayered complex supply chain networks from procurement of parts to delivery of finished products minimizing inventory stocks through just in time procurement policy Quite efficient under normal conditions but Quite vulnerable to major disasters 19


 Tohoku Tokai Kyushu")
20 Agglomeration of auto and supporting industries in Japan domestic Domestic production sales per year 10 million cars exports : about half : about half Oversea production : 16 million cars (using key parts from Japan) Tohoku Tokai Kyushu 日経ビジネス 号 20

21 Supply chain of automobile parts in ASEAN countries Source: IDE JETRO and WTO 2011, Trade Patterns and Global Value Chains in East Asia: From Trade in Goods to Trade in Tasks 21
22 Index of Automobile production in Tohoku and in Japan (synchronized impacts) Tohoku Japan Lehman Shocks Quakes and Tsunami Source: R. Wakasugi, RIETI Symposium on Great East Japan Earthquakes,
23 The Global Impact of the Japanese Quake and Thailand s Flood , Japan, Guangdong (China), Thailand, and the US Automobile production (y o y % change) January February Japan Guangdong China Thailand USA March April 25.2 Japanese Quake May June July August September 67.6 Thailand s Flood October 85.0 November 27.6 December Source: JAMA, Statistic Bureau of Guangdong Province, TAIA, Federal Reserve Board By courtesy of Professor Nobuaki Hamaguchi 23
24 2011, ASEAN automobile production (y o y % change) Januar Thailand Malaysia Indonesia 74 Philippines Japanese Quake 68 Thailand s Flood 85 February March April May June July August September October November December Source: TAIA, AAM, GAIKINDO, AAP By courtesy of Professor Nobuaki Hamaguchi 24
25 Impact of natural disasters and international conflicts on automobile sales in China % 100 Toyota East Japan Earthquake (11/3) Nissan Thai Flood (11/9~) Senkaku Conflict (12/8~) Honda / / /1~2 4 5 Source: The Nikkei, 10 October 2012 and 5 June 2013 (two diagrams combined by the author) 25
26 No place in the world would be risk free! Possible large scale disruption of supply chains from any major disaster: Natural disasters Quake Tsunami Flood Typhoon / Hurricane Social disasters Air / Water pollution Epidemics Financial / Monetary shocks Terrorism Political conflicts Military conflicts / War Global warming Secondary disasters Transport disruptions, Nuclear Power plant accident, Demand/Supply disruptions International cooperation for mainstreaming the global resilience of supply chains 26
27 5. The Asian Century?: Prospects and Tasks The Scenario of the Asian Century (ADB, ASIA 2050) Global Population: 7.1 billion Asian Population : 3.9 billion (55%) billion 4.8 billion (52%) market Global GDP: $70 trillion FX rate Asian GDP : $21 trillion (30%) 4.2% / year 5.8% / year $335 trillion $174 trillion (52%) ME NA 4% SSA 2% the Rest 1% ME NA 3% SSA 2% the Rest 1% LAC 8% Europe 29% Asia 30% North America 26% LAC 6% Europe 18% North America 16% Asia 52% 27
28 In order to realize the expected Asian Century Asia as the World Factory today based on the extensive supply chains utilizing huge wage disparity Advanced Production networks a World Center of High Quality Markets + + Innovation networks International Cooperation I. Rebuilding more resilient and inclusive Supply Chain Networks, and II. Strengthening the Brain Power Network for the future Asia 28
29 6. Developing the brain power network in Asia Development of the Brain Power Society since the late 20th century Revolutionary development in ICT and Transport Technology globalization of the world economy Development of Brain Power Society The major reorganization of global economic political social systems 29

30 NIKKEI ASIAN REVIEW March 20, 2014 Eruption of Innovation Number of papers most cited (top 1%) Number of papers Number of patent applications Government R&D expenditure Private Sector R&D 30
31 trillion yen R&D expenditure by country (OECD PPP) 47.4 US China Japan Germany S. Korea France UK
32 (thousand) Number of patent applications by nationality Data source: National Institute of Science and Technology Policy Diagram made by Dr. Isamu Yamauchi at RIETI China Japan US S. Korea Germany France UK
33 Number of papers cited frequently (top 10%) 60,000 50,000 40,000 30,000 20,000 10,000 0 Data source: National Institute of Science and Technology Policy Diagram made by Dr. Isamu Yamauchi at RIETI US UK Germany China France Japan S. Korea
34 Importance of International Cooperation through diversity and culture in the Brain Power Society The fundamental resources in the Brain Power Society Individual Brain Power Diversity in people brains in the society Synergy through heterogeneous people brains Diversity in cultures among different regions Synergy through heterogeneous cultures 34
35 close cooperation of heterogeneous K workers (e.g. nominication in Japan) antinomy in the short run through close communications synergy in the long run Common knowledge diversity synergy for resolving this fundamental problem Promote active interactions among diverse regions and countries 35
 Share of foreign reseachers (%) Figure 1: share of foreign researchers at NIMS 2001 2011 Among high ranking papers")

36 Diversity and creativity: National Institute for Materials Science (NIMS) Table 1. The number of foreign researchers in public research institutes in Tsukuba (2011, March) Table 2. World ranking in terms of citations in materials science (NIMS) Share of foreign reseachers (%) Figure 1: share of foreign researchers at NIMS Among high ranking papers at NIMS in terms of citations, the number of papers written by author(s) including foreign researcher(s) among top 10 papers: 8 among top 31 papers: 24 SOURCE: Ariga and Urao, Productivity enhancement of a research institute through the contribution of foreign researchers, Science & Technology Trends No.127, 2012, 1 2, Ministry of Education and Science 36
 Source:I. Sakata, H. Sasaki, H. Nakamura and Y.")

37 The Map of international research cooperation in Solar Cells the number of papers and international coauthorship (published between 1945 and 2009) Source:I. Sakata, H. Sasaki, H. Nakamura and Y. Kajikawa "Maps of international research collaboration in clean energy" Journal of Energy and Power Engineering 7 (2013) Ranking in the number of papers 1 st : US, 2 nd : Japan, 3 rd : Germany, 4 th : China, 5 th : India, 6 th : France, 7 th : England, 8 th : South Korea, 9 th : Spain, 10 th : Italy 37 (but, weak research cooperation in Asia)
38 7. The Growth Strategy for Implementing the Third Arrow Making the economy grow while the population decreases Enhancing the TFP of economy But, how? : Innovation everywhere involving everyone! Advancing the bold new strategy reflecting new values such as: I. Silver is beautiful II. Small and creative is beautiful III. Open and connected is beautiful 38
39 Flying Geese of Aging Society in Asia Pacific the population share (%) of aged people over 65: year 2010 year Laos 5 18 Myanmar 5 16 India 5 17 Indonesia 4 12 Philippines 5 21 Cambodia 5 21 Malaysia US 6 24 Mexico 5 21 Bangladesh 7 29 Vietnam 8 28 China Canada Korea Hong Kong 9 33 Thailand 9 32 Singapore 23% 40% Japan Let Japan be a leader of the innovative silver society Source: UN World Population Prospects, The 2012 Revision Source for Japanese data: National Census of Japan, National Institute of Population and Social Security Research, Population Projections for Japan (2012 revision)

40 Who are the aged? Why fix the dividing line at 65? The average life expectancy in Japan actual estimate Data source: Ministry of Health, Labour and Welfare Diagram: Cabinet Office, Government Of Japan Report on Aging Society, 2014 Ultimate Goal: Create a new society where everyone can happily work/enjoy in good health until the end. 40
41 The Silver is beautiful: Senior Citizen Creating the best matching Big customers for new products / industries housing goods services entertainments tailored for the aged medical / nursing services medical / nursing equipments friendly and helpful robots lifetime education all kind of resorts / retirement villages Younger generations Big resources human resources for workers / managers, skills / knowledge, innovation / creation / ventures financial resources Creating the most innovative silver society through international cooperation 41
42 Increasing share of consumption expenditure by senior households American labor force participation rate: aged Source: Nikkei Shimbun, May12, 2014 Source: The Economist, April 26,


43 Irodori Project in Action (with All Smiles): Kamikatsu, Tokushima 43


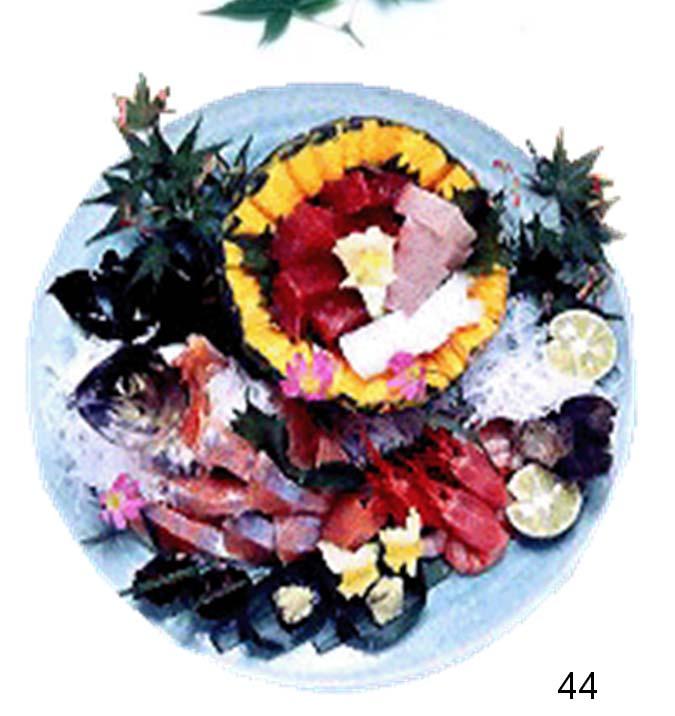

44 Products of Irodori Project: Tsumamono for Japanese Dishes 44
45 Irodori (Color) Project in Kamikatsu Village, Tokushima Initiated in 1986 by Mr. Yokoishi (then 24 years old) of JA and four senior ladies Now 150 members (all farmers) average age: 67 (mostly females), the oldest: 94 Average revenue per member: 1.7 million yen Kamikatsu village today Irodori project + four similar projects (the third sector) population: 2092 (U turn + I turn: 6.3%) aged people over 65: 47% (the highest in Tokushima) only two persons are bedridden per capita medical expenditure (National Health Insurance): 260 thousand yen (vs. 460 thousand yen at the village with the second highest ratio of elderly) 45


46 Small and Creative is beautiful. Ranking of Japanese per capita GDP in OECD rank 0th rank Country th 10th Luxemburg 117,967 2 Norway 94,763 3 Switzerland 64,885 4 Denmark 62,054 5 Ireland 59,944 6 Netherlands 53,094 7 Iceland 52,568 8 Sweden 51,954 9 Finland 50, Austria 49, Australia 48, United States 47, Belgium 47,151 15th Canada 44, France 44, Germany 44,519 20th United Kingdom 43, Italy 38, Japan 38, Spain 34,971 Source:OECD Factbook 2010: Economic, Environmental and Social Statistics, and 46
47 The top 10 countries in the OECD in terms of per capita GDP (2008) 1. All small countries located in the northern part of Europe 2. The total population of the 10 countries: 63 million (about ½ of Japan) The average population: 6.3 million (vs. 5.5 million in Hokkaido) To achieve economic growth in a Brain Power Society, population size is not essential. 3. Most countries are already in the advanced silver society. (the share of people over 65 in 2010: Sweden 18%, Denmark 17%, Switzerland 17%, Finland 17%, ) 4. Each is an independent country, having its own language and culture, with a unique set of economic social educational policies. 5. Each spends a high proportion of GDP on education (Denmark 7.8%, Sweden 6.7%, Norway 6.7%, Finland 5.9%, vs. Japan 3.4%, in 2007) 6. Each is highly globalized with high GDP ratios of exports, out FDI and in FDI, and with a high proportion of immigrants 7. Most multi national firms are concentrated on knowledge intensive activities (e.g. HQ management, R&D, design) with high profit ratios, while all workers in each country get relatively high wages, (cf: Grossman and Ross Hansberg, 2008, AER 98) 8. The ten countries together form a Brain Power Society, rich in diversity 47
48 Let Japan be a union of semi independent shining regions We Love Hokkaido A We Love Japan We Love the World D Tokyo B We Love Kansai We Love Japan We Love the World C 48


49 Open and connected is beautiful Promoting the Regional Integration of Asia Pacific Europe FTAPP RCEP TPP China Korea Japan ASEAN NAFTA 49
50 Connect or Perish: International coauthorship Source: Nikkei Shimbun, May 12,
Japanese Market Potential
 Growth Strategy (announced on 14 June 2013) : Japan is BACK. Overall Target: 2% Real GDP Growth in the next 10 years JPY1.5 million Increase of GNI/capita after 10 years Unleash the Potential of Private
USJI Event Is the TPP a Source of Cooperation or Conflict?: Japan s Perspective
 USJI Event Is the TPP a Source of Cooperation or Conflict?: Japan s Perspective May 17, 2012 Shujiro URATA Waseda University 1.TPP: Trans Pacific Partnership Agreement Origin: P4 (Chile, New Zealand, Singapore,
International Economic Shocks and the Challenges of International Corporations
 RIETI Policy Symposium International Economic Shocks and the Challenges of International Corporations Ryuhei Wakasugi Research Counselor, RIETI Professor Kyoto University and Keio University R. Wakasugi
Opportunities in a Challenging Global Business Environment: Can the World Avoid a Double-Dip?
 Opportunities in a Challenging Global Business Environment: Can the World Avoid a Double-Dip? Ross DeVol Chief Research Officer (310) 570 4615 rdevol@milkeninstitute.org www.milkeninstitute.org Presentation
Setting the scene The ICT landscape in BRIC countries
 1 Setting the scene The ICT landscape in BRIC countries / Disclaimer The views expressed are those of the presenter and may not in any circumstances be regarded as stating an official position of the European
sector: recent developments VÍTOR CONSTÂNCIO
 The economy and the banking sector: recent developments VÍTOR CONSTÂNCIO January 2006 Recent performance of the economy and prospects Factors behind the period of slow growth Challenges to the Banking
Regional Economic Integration in East Asia and Japan s FTA Policy. November 18, Shujiro URATA Waseda University
 Regional Economic Integration in East Asia and Japan s FTA Policy November 18, 2010 Shujiro URATA Waseda University Contents I. Introduction II. Market-Driven Regional Economic Integration III. A Shift
Trade Growth - Fundamental Driver of Port Operations and Development Strategies
 Trade Growth - Fundamental Driver of Port Operations and Development Strategies Marine Terminal Management Training Program October 15, 2007 Long Beach, CA Paul Bingham Global Insight, Inc. 1 Agenda Economic
Cost and Benefit Analysis of Possible Philippine Participation in the Trans-Pacific Partnership Agreement
 Cost and Benefit Analysis of Possible Philippine Participation in the Trans-Pacific Partnership Agreement (available at: http://www.gii.ncr.vt.edu/docs/gii_wp2014-1.pdf) Caesar B. Cororaton and David Orden
US imports from emerging economies have grown rapidly
 US imports from emerging economies have grown rapidly Ratio to GDP (current dollars) 0.07 US merchandise imports, 1978 2008 0.06 0.05 0.04 0.03 0.02 Industrial Non-OPEC other 0.01 0 OPEC = Organization
Global economic cycle has slowed
 Year-on-year % change Confidence index, 50= no change Global economic cycle has slowed 25% 70 20% International trade growth 65 15% 10% Industrial production growth 60 5% 55 0% 50-5% Business confidence
Seven Lean Years Explaining Persistent Global Economic Weakness
 Seven Lean Years Explaining Persistent Global Economic Weakness 9 June 2015 Bank of Canada and European Central Bank Conference Tim Lane Deputy Governor Bank of Canada The global economy remains weak and
China s Industrial Capabilities and Trade
 China s Industrial Capabilities and Trade Loren Brandt Thomas Rawski June 16, 2005 Key Facts: China, 2003 Population: 1.3 billion (1 st ) GNP: $US 1.4 trillion (3 rd ) Foreign Trade: $US 850.1 (3rd) GNP
Korea s Education Reform. Ju Ho Lee, KDI School
 Korea s Education Reform Ju Ho Lee, KDI School Table of Contents I. Virtuous Circle II. Number One in Human Capital? III. Education Bubbles IV. Education reform V. Powerhouse of Global Talents Socio-Economic
I. World trade in Overview
 I. Table I.1 Growth in the volume of world merchandise exports and production by major product group, 1995-3 ( change) 1995-21 22 23 World merchandise exports 7. -.5 3. 4.5 Agricultural products 3.5 2.5
Some Facts About Output
 Some Facts About Output GNP as a Percentage of GDP in 2009 Country % Kuwait 110,38 United Kingdom 102 Japan 103,14 United States 99,24 China 100,87 Germany 101,41 Mexico 98,34 Poland 96,76 Ireland 81,19
The Australia US FTA: implications for international education
 The Australia US FTA: implications for international education Prepared for The Path to Cultural Understanding and Development 18th IDP Australian International Education Conference, Sydney 5-8 October
Big data analytics for enrichment of rural area content tourism in Okhotsk sub-prefecture of Japan
 Big data analytics for enrichment of rural area content tourism in Okhotsk sub-prefecture of Japan Ali Bakdur, Fumito Masui, Michal Ptaszynski Kitami Institute of Technology, Dept. of Computer Science,
The Economy of Finland
 The Economy of Finland Aug 30st 2013, Finnish Ministry of Foreign Affairs Presentation for the American Fulbright Grantees Petteri Rautaporras, Economist at the Federation of Finnish Technology Industries
Susan J. Adams, PhD IMF-PFTAC Coordinator
 A MACROECONOMIC PORTRAIT OF THE PACIFIC: A Presentation for PEGASeS August 16, 2007 Susan J. Adams, PhD IMF-PFTAC Coordinator Compiled by the IMF Asia and Pacific Department Edited by PFTAC OUTLINE OF
Session 4. Growth. The World Economy Share of Global GDP Year 2011 (PPP)
") Session 4. Growth Stylized Facts on Standards of Living across Countries Characterizing Growth over 1 Years: The US Economy Growth Dynamics of the G7 Countries and the OECD Economies Characterizing Growth
Session 4. Growth Stylized Facts on Standards of Living across Countries Characterizing Growth over 1 Years: The US Economy Growth Dynamics of the G7 Countries and the OECD Economies Characterizing Growth
TitleChina Factor and Economic Developme.
 TitleChina Factor and Economic Developme Author(s) Lin, Chu-chia Citation Issue 2010-04 Date Type Presentation Text Version publisher URL http://hdl.handle.net/10086/18553 Right Hitotsubashi University
THE WORLD COMPETITIVENESS SCOREBOARD 2011
 THE WORLD COMPETITIVENESS SCOREBOARD 2011 98.557 94.063 92.588 92.011 90.782 90.219 89.259 87.824 86.475 86.418 86.313 85.707 84.380 84.120 81.629 81.619 81.100 80.278 79.799 78.499 77.599 77.101 76.827
The structure of the euro area recovery
 The structure of the euro area recovery Rolf Strauch, Chief Economist JPMorgan Investor Seminar, IMF Annual Meetings Washington, October 2017 The euro area: a systemic player in global trade Trade openness
Impacts of the Global Economy on Asia Pacific Travel. 29 June 2007 John Walker
 Impacts of the Global Economy on Asia Pacific Travel 29 June 2007 John Walker jwalker@oxfordeconomics.com Oxford Economics Founded in 1981 Over 300 clients including blue chip companies and government
National Transfer Accounts in Mexico
 National Transfer Accounts in Mexico Policy implications: labor market Iván Mejía Guevara imejiag@stanford.edu Stanford University 12th Global Meeting of the NTA Network, Mexico City, July 23-27, 2018
The outlook: what we know, the known unknowns and the unknown unknowns
 The outlook: what we know, the known unknowns and the unknown unknowns 24 April 2017 Seoul Brian Pearce, Chief Economist, IATA www.iata.org/economics Airline Industry Economics Advisory Workshop 2016 1
This Time is Different: Eight Centuries of Financial Folly
 This Time is Different: Eight Centuries of Financial Folly Carmen M. Reinhart, University of Maryland, NBER, and CEPR Kenneth S. Rogoff, Harvard University and NBER (Princeton University Press, forthcoming
U.S. Overview. Gathering Steam? Tuesday, October 1, 2013
 U.S. Overview Gathering Steam? Tuesday, October 1, 2013 Uneven global economic recovery Annual real GDP growth projections (%) Projections 2013 2014 World 3.1 3.1 3.8 United States 2.2 1.7 2.7 Euro Area
AREA TOTALS OECD Composite Leading Indicators. OECD Total. OECD + Major 6 Non Member Countries. Major Five Asia. Major Seven.
 Reference series Composite leading indicators OECD Composite Leading Indicators AREA TOTALS 7-03- 19 OECD Total 19 OECD + Major 6 Non Member Countries 19 Major Seven 19 Major Five Asia 19 Euro area 19
Economic Outlook March Economic Policy Division
 Economic Outlook March 212 Economic Policy Division Real GDP Outlook Percent Change, Annual Rate 2 1 1 - -1 197 197 198 198 199 199 2 2 21 U.S. GDP Actual and Potential Quarterly, Q1 197 to Q4 211 Real
China at a glance 2011
 China at a glance 2011 GDP PPP Growth rate Per capita Value US$11.29 trillion 9.2% US$8,400 Ranking 3 7 119 Labor force Imports Exports Value 816.2 million US$1.74 trillion US$1.90 trillion Ranking 1 3
Grasshoppers, Ants and Locusts: the future of the world economy
 Ralph Miliband Series on the Restructuring of World Power Grasshoppers, Ants and Locusts: the future of the world economy Martin Wolf Associate editor and chief economics commentator, Financial Times Professor
East Asian Regionalism
 East Asian Regionalism Min Shu Waseda University 2018/1/15 1 Outline of the lecture Regional cooperation and regionalism: an overview Economic regionalization and regionalism in East Asia Understanding
Major Issues and Trends Facing the Port and Marine Transportation Industry
 Major Issues and Trends Facing the Port and Marine Transportation Industry Presented to: AAPA Marine Terminal Management Training Program April 24, 2006 Charleston Riverview Hotel Charleston, SC - USA
CHINA S RISE & A CHANGING WORLD NOVEMBER 7, 2017 KOÇ UNIVERSITY
 CHINA S RISE & A CHANGING WORLD NOVEMBER 7, 2017 KOÇ UNIVERSITY GDP, Current Price, Trillion USD Chinese Economy Rising Source: UN Statistical Division 7,00 6,00 5,00 4,00 3,00 2,00 France Germany Italy
Assessing Australia s Innovative Capacity in the 21 st Century
 Assessing Australia s Innovative Capacity in the 21 st Century Professor Joshua Gans MBS & IPRIA University of Melbourne November, 2003 This presentation is based on the National Innovative Capacity Project,
The economic value of the EU shipping industry. Andrew P Goodwin
 The economic value of the EU shipping industry Andrew P Goodwin 2 nd April 2014 Introduction Shipping is a vital facilitator of world trade 135 % Increase in world GDP in the last two decades 180 % Increase
The Rise of China and Breaking out the Middle- Income Trap in Latin America and the Caribbean countries: A New Structural Economics Approach
 The Rise of China and Breaking out the Middle- Income Trap in Latin America and the Caribbean countries: A New Structural Economics Approach Justin Yifu Lin Senior Vice President and Chief Economist The
International Trade Economic Forecasts An Overview of Orange County and Southern California Exports
 International Trade Economic Forecasts An Overview of Orange County and Southern California Exports Mira Farka Adrian R. Fleissig Institute for Economic and Environmental Studies Orange County / Inland
Elements for the Biennial Review And Assessment of the World Timber Situation SELECTED DATA AND ANALYSIS.
 Elements for the Biennial Review And Assessment of the World Timber Situation 2015-2016 SELECTED DATA AND ANALYSIS Frances Maplesden Content Results of the 2016 Joint Forest Sector Questionnaire Secondary
The Changing Global Economy Impacts on Seaports and Trade Dr. Walter Kemmsies
 The Changing Global Economy Impacts on Seaports and Trade Dr. Walter Kemmsies Chief Economist, PAGI Group, JLL (Port, Airport & Global Infrastructure) Agenda Where are we in the cycle? What are the barriers
The Aftermath of Global Financial Crises
 The Aftermath of Global Financial Crises Carmen M. Reinhart, University of Maryland, NBER, and CEPR Brookings Institution Washington DC, April 20, 2009 This talk is based on several works with Kenneth
Traits of a Global Market for Advanced Human Capital How can the Global Demand for Post-secondary Education be met...
 Traits of a Global Market for Advanced Human Capital How can the Global Demand for Post-secondary Education be met... Washington D.C. May 23, 2002 .why are we here? Economic and social development are
Western Health Care Systems: Under Pressure from Demography
 Western Health Care Systems: Under Pressure from Demography Nicholas Eberstadt Henry Wendt Chair in Political Economy American Enterprise Institute eberstadt@aei.org Presentation at Panel on Health Care
Global Construction Outlook: Laura Hanlon Product Manager, Global Construction Outlook May 21, 2009
 Global Construction Outlook: Short-term term Pain, Long-term Gain Laura Hanlon Product Manager, Global Construction Outlook May 21, 2009 What This Means for You The world is set to be hit this year with
COMMENTS ON THE INDUSTRIAL POLICY: THE CASE OF TURKEY
 MINISTRY OF DEVELOPMENT, REPUBLIC OF TURKEY COMMENTS ON THE INDUSTRIAL POLICY: THE CASE OF TURKEY Umut GÜR Head of Department of Industry 10 May 2013 Panel on Industrial Policies, TEPAV, Ankara 1 1923
The Economic Transformation of East Asia During the Past Thirty Years
 Tel: (852)3550-7070; Fax: (852)2104-6938 Email: lawrence@lawrencejlau.hk; WebPages: www.igef.cuhk.edu.hk/ljl *All opinions expressed herein are the author s own and do not necessarily reflect the views
US-China Trade Conflict: Dejavu or New One
 US-China Trade Conflict: Dejavu or New One Lessons From US-Japan Trade Conflict in 1980s and 1990s Tamotsu Nakamura & Yoichi Matsubayashi Plan of Talk 1. US-Japan Trade Conflict in Retrospect 2. Similarities
Inland Empire International Trade Economic Forecast
 Inland Empire International Trade Economic Forecast Mira Farka Adrian Fleissig Institute for Economic and Environmental Studies Orange County / Inland Empire Regional SBDC Network California State University,
The Mystery of Growing Foreign Exchange Reserve
 The Mystery of Growing Foreign Exchange Reserve January - March 2007 Total increase = $136 Billion Trade surplus 34% To be explained 54% Net FDI inflow 12% Source: PBoC Renminbi Pressure Indicator Initial
Growth Strategies and Dynamics in Developing Countries. Michael Spence Hamilton Project/CGD Forum Washington D.C. April 14, 2008
 Growth Strategies and Dynamics in Developing Countries Michael Spence Hamilton Project/CGD Forum Washington D.C. April 14, 2008 1 The Focus The subject is sustained high inclusive growth and the policies,
The Future of the World s International Education
 The Future of the World s International Education long-term driving forces or trends that influence almost everything at all levels of societal development. They have great importance now, and we are relatively
Trade and Economic Trends
 Trade and Economic Trends Marine Terminal Management Training Program Paul Bingham Managing Director, Global Commerce & Transportation IHS Global Insight Long Beach, CA September 21, 2009 The Global Recession
The Nordic countries in figures
 The Nordic countries in figures 2010 Order your Nordic Statistica Yearbook 2010 on www.norden.org Nordic countries in figures 2010 ANP 2010:773 T RY K S A G N R. 541-618 Nordic countries in figures 2010
STORM FORECASTS: The only independent source of animal health and animal agriculture historical market data and forecasts
 The only independent source of animal health and animal agriculture historical market data and forecasts June 2016 1 What is STORM FORECASTS? STORM FORECASTS is the only independent source of animal health
The Chinese Economy: Myths and Realities
 The Chinese Economy: Myths and Realities Lawrence J. Lau, Ph. D. President and Ralph and Claire Landau Professor of Economics The Chinese University of Hong Kong and Kwoh-Ting Li Professor in Economic
Mis thinking globalisation: The case for WTO 2.0
 Mis thinking globalisation: The case for WTO 2.0 Richard Baldwin Graduate Institute, Geneva & University of Oxford 26 September 2012, WTO Forum Mis thinking globalisation Conventional view: Globalisation
The Herzliya Indices. National Security Balance The Civilian Quantitative Dimension. Herzliya Conference Prof. Rafi Melnick, IDC Herzliya
 The Herzliya Indices National Security Balance The Civilian Quantitative Dimension Herzliya Conference 2015 Prof. Rafi Melnick, IDC Herzliya 1990 1991 1992 1993 1994 1995 1996 1997 1998 1999 2000 2001
THE ICELANDIC ECONOMY AN IMPRESSIVE RECOVERY BUT WHAT CHALLENGES LIE AHEAD?
 THE ICELANDIC ECONOMY AN IMPRESSIVE RECOVERY BUT WHAT CHALLENGES LIE AHEAD? FROM BUST TO BOOM. AN EPIC BUST After 16 years of growth with a short pause for breath in 2002, the Icelandic economy entered
Oil Prices: Past, Present, & Future
 Oil Prices: Past, Present, & Future Gulf Research Center November 23, 2005 A. F. Alhajji*, PhD Gulf Energy Program - Moderator Gulf Research Center Dubai, UAE *A. F. Alhajji, PhD is also George Patten
Universities and the Education Revolution. Professor Richard Larkins Chair, Universities Australia VC and President Monash University
 Universities and the Education Revolution Professor Richard Larkins Chair, Universities Australia VC and President Monash University Role of Universities in Prosperity Third largest earner of export dollars
Ministry of Economy and Sustainable Development of Georgia
 Ministry of Economy and Sustainable Development of Georgia Economic Growth 42,000.0 36,000.0 30,000.0 24,000.0 18,000.0 12,000.0 6,000.0 0.0 GDP AND ECONOMIC GROWTH 7.2% 6.2% 6.4% 4.6% 4.8% 3.4% 2.9% 2.8%
Chapter 4: Changing Economic Structures of the Asian Economies
 FINALLY REVISED August, 2008 Chapter 4: Changing Economic Structures of the Asian Economies Chapter 4: Changing Economic Structures of the Asian Economies 4.1 Selected Structural Parameters of the Asian
India: Can the Tiger Economy Continue to Run?
 India: Can the Tiger Economy Continue to Run? India s GDP is on the rise US$ trillions Nominal GDP (left axis) GDP growth (right axis) 3.0 2.5 2.0 1.5 1.0 0.5 0.0 1990 1992 1994 1996 1998 2000 2002 2004
Avoiding the Blind Alley China s Economic Overhaul and its Global Implications
 Avoiding the Blind Alley China s Economic Overhaul and its Global Implications Daniel Rosen Partner dhrosen@rhg.com NYU Stern China Research Luncheon New York December 1, 2014 10 East 40 th Street, Suite
KINGDOM OF CAMBODIA NATION RELIGION KING 3
 KINGDOM OF CAMBODIA NATION RELIGION KING 3 TOURISM STATISTICS REPORT February 2018 MINISTRY OF TOURISM Statistics and Tourism Information Department No. A3, Street 169, Sangkat Veal Vong, Khan 7 Makara,
Unconventional Monetary Policy: Thoughts on the U.S. and Japanese Experiences
 Unconventional Monetary Policy: Thoughts on the U.S. and Japanese Experiences International Conference on Capital Flows and Safe Assets John Rogers Senior Adviser Federal Reserve Board May 27, 2013 The
Overview of the Philippines Action Plan for AEC Emmanuel F. Esguerra Deputy Director-General National Economic and Development Authority
 Overview of the Philippines Action Plan for AEC 2015 Emmanuel F. Esguerra Deputy Director-General National Economic and Development Authority Marriot Hotel, Newport City 8 October 2014 Outline AEC 2015
Anna Kosior, Economic Analysis Department. Will Central and Eastern Europe run out of steam?
 Anna Kosior, Economic Analysis Department Will Central and Eastern Europe run out of steam? Opinie wyrażone w niniejszej publikacji są opiniami autorów i nie przedstawiają stanowiska organów Narodowego
Puget Sound Regional Forecast Chris Mefford Community Attributes
 2015 Puget Sound Regional Forecast Chris Mefford Community Attributes 3 1,000s The Regional Economy has added jobs consistently for nearly 5 full years. In a few months, this will be the longest streak
Setting Regional and National Road Safety Targets
 10 th Meeting of the United Nations Road Safety Collaboration 3-4 June 2009, Bangkok Setting Regional and National Road Safety Targets Commemorating 60 years in Thailand 1949-2009 Lives at stake people
Feeding fish to fish is this a responsible practice?
 Feeding fish to fish is this a responsible practice? Andrew Jackson Technical Director International Fishmeal & Fish Oil Organisation Humber Seafood Summit 15 July 2010 IFFO International Fishmeal and
World exports as a share of GDP
 World exports as a share of GDP 35% 30% 25% 20% 15% 1991 1993 1995 1997 1999 2001 2003 2005 2007 2009 Source: WTO, World Bank. World goods and service exports US$ trillions Commercial services (L) Total
PwC Automotive Global Future of the Auto Sector Felix Kuhnert, European Automotive Leader 06 November 2012
 www.pwc.com Automotive Global Future of the Auto Sector Felix Kuhnert, European Automotive Leader Agenda Page 1 Global Snapshot 1 2 Fasten your seatbelt! Turbulence in Europe ahead! 6 3 Growth takes place
Israel Innovation Authority
 Israel Innovation Authority Danny Biran VP, International Division innovationisrael.org.il Hi-Tech - Major Impact on the Israeli Economy of Employees Of Business Sector GDP of Exports 4.3 Global Leadership
Worst economic crisis since WWII and lack of funds posing internal and external barriers to internationalisation
 Hot Topics Dr Janet Ilieva International Education Intelligence Unit Setting the context Worst economic crisis since WWII and lack of funds posing internal and external barriers to internationalisation
Local systems, Europe and globalisation: How to get it right?
 Local systems, Europe and globalisation: How to get it right? Jean-Paul Fitoussi Professor, IEP Paris President, OFCE «Culture and Knowledge: Local Systems in a Global Context» European Colloquia Prague,
Nordic Research. Key Data
 Nordic Research Key Data 212 2 Nordic Research Key Data 212 Nordic Research Key Data 212 ANP 212:731 NORDISK MILJØMÆRKNING Nordic Research Key Data 212 ISBN 978-92-893-2358-1 DOI http://dx.doi.org/1.627/anp212-731
Paul Bingham Managing Director, Global Trade and Transportation February 18, 2009
 Economic Outlook and Ports Paul Bingham Managing Director, Global Trade and Transportation February 18, 2009 The Outlook for Trade Depends on Goods Demand Integrated international supply-chains offer efficiencies
New rules, new opportunities: a potential for growth
 #TV year New rules, new opportunities: a potential for growth June 19th, 2015 Jacques Balducci Eurodata TV Worldwide Deputy Sales Director Worldwide TV viewing remains strong World daily viewing time Average
BBL Seminar. Handout. September 12, CAI Fang. China s Demographic Change and Implications for Rest of the World"
 Research Institute of Economy, Trade and Industry (RIETI) BBL Seminar Handout September 12, 2011 China s Demographic Change and Implications for Rest of the World" CAI Fang http://www.rieti.go.jp/jp/index.html
Global trade: how does it look?
 Edmonton, December 2018 Global trade: how does it look? Marie-France Paquet The Office of the Chief Economist Global Affairs Canada Overview 1. Canadian economy at a glance 2. Provincial economy at a glance
Stocks and Bonds Track Aging Population:
 Stocks and Bonds Track Aging Population: 1952-2008 8 85.00% 7 6 5 4 3 2 1 Correlation: 93% Stocks and Bonds as a Percentage of Household Liquid Financial Assets (left scale) Population 35 Years and Over
The Great Convergence: China, India and the new global economy. Mark Thirlwell Program Director, International Economy July 2006
 The Great Convergence: China, India and the new global economy Mark Thirlwell Program Director, International Economy July 2006 India Two views of the largest economies in 2005 Top 12 economies by GDP,
Selected Interest & Exchange Rates
 (5/517) Selected Interest & Exchange Rates Weekly Series of Charts i January 29, 1990 Prepared by the FINANCIAL MARKETS SECTION DIVISION OF INTERNATIONAL FINANCE BOARD OF GOVERNORS FEDERAL RESERVE SYSTEM
Global growth forecasts Key countries/regions,
 Global growth forecasts Key countries/regions, 2014-2018 Percent 7 6 5 4 3 2 1 0 Developing Asia Sub-Saharan Africa Middle East and North Africa Latin America and the Caribbean United States Euro area
Car Production. Brazil Mexico. Production in thousands. Source: AMIA Asociacion Mexicana de la industria automotriz.
 Car Production Production in thousands 4000 3000 2000 1000 Brazil Mexico 0 2013 2014 2015 Source: AMIA Asociacion Mexicana de la industria automotriz. Mexico s Expanding Middle Class Percent of population
World real GDP growth in 2010 Annual percent change
 World real GDP growth in 2010 Annual percent change 1 or more 6-1 3-6% 0-3% Less than No data Source: International Monetary Fund. World real GDP growth in 2011 Annual percent change 1 or more 6-1 3-6%
Austria: Key Economic Features
 Austria: Key Economic Features and EU Guanghua School of Management Josef Christl, Macro-Consult 16. Oktober 2017 Austria: a small, but rich country Population, mn. GDP per capita PPP, USD 1600 60000 1400
Predicting the Markets: Chapter 15 Charts: Predicting Currencies
 Predicting the Markets: Chapter 15 Charts: March 3, 217 Dr. Edward Yardeni 516-972-7683 eyardeni@ Mali Quintana 48-664-1333 aquintana@ Please visit our sites at www. blog. thinking outside the box Table
Promoting Competitiveness in Latin America and the Caribbean. Panel: International Trade and. Gabriel Duque Deputy Foreign Trade Minister
 Promoting Competitiveness in Latin America and the Caribbean Panel: International Trade and Global Integration Ministry of Trade, Industry and Tourism Gabriel Duque Deputy Foreign Trade Minister Mexico
Global Economic Outlook. Kellie Maske, Sr. Economics Fellow FedEx Corporate Economics September 2011
 Kellie Maske, Sr. Economics Fellow FedEx Corporate Economics U.S. Outlook: Moderate Growth Overall 6 4 US Real GDP Growth 2 % Change 0 (2) (4) Forecast (6) (8) Bars = QOQ% Annualized Line = YOY% (10) 2005
The international. ski market
 LV/18/05/2014 Abstract The international ski market Presentation to ISIA Congress 17 May 2014 - Vuokatti Market metrics Skier : one person practising ski, snowboard or other downhill slide, independent
United Nations Conference on Trade and Development. TRADE AND DEVELOPMENT BOARD (62nd session)
") United Nations Conference on Trade and Development TRADE AND DEVELOPMENT BOARD (62nd session) Geneva, 14-25 September 2015 Item 6: Evolution of the international trading system and its trends from a development
United Nations Conference on Trade and Development TRADE AND DEVELOPMENT BOARD (62nd session) Geneva, 14-25 September 2015 Item 6: Evolution of the international trading system and its trends from a development
The transition to sustainable energy
 ATSE Symposium The transition to sustainable energy Peter Littlewood 8 Nov 2016 The changing world economy Index 180 170 160 150 140 130 120 110 100 90 Economies less energy intensive Electricity less
ANNEXES - KYRGYZSTAN. Independent Country Programme Evaluation
 ANNEXES - KYRGYZSTAN Independent Country Programme Evaluation 1 http://web.undp.org/evaluation/documents/evaluation-policy.pdf 2 http://data.un.org/countryprofile.aspx?crname=kyrgyzstan (accessed April
DEVELOPMENT AID AT A GLANCE
 DEVELOPMENT AID AT A GLANCE STATISTICS BY REGION 6. OCEANIA 2018 edition All the data in this report are available at: http://www.oecd.org/dac/financing-sustainable-development/ 6.1. ODA TO OCEANIA - SUMMARY
More than half the world lives on less than $2 a day
 More than half the world lives on less than $2 a day PRB s 2005 World Population Data Sheet reveals persisting global inequalities in health and well-being Presentation by Bill Butz, Carl Haub, Linda Jacobsen,
Max Sort Sortation Option - Letters
 Max Sort Sortation Option - Letters Western Europe Prices Product Code PS5 PS6 Austria* 0.330 7.550 0.330 7.400 Belgium* 0.370 3.700 0.370 3.540 Denmark* 0.620 5.350 0.620 4.215 Finland* 0.385 4.400 0.385