Executive Summary. North Florida Transportation Planning Organization Argyle Traffic Study
|
|
|
- Valerie Webb
- 5 years ago
- Views:
Transcription


1
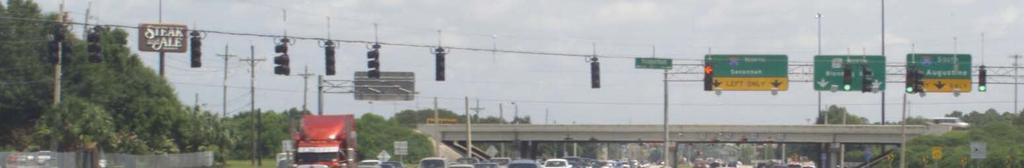
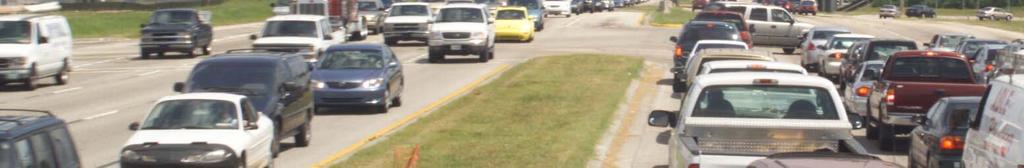
2 North Florida Transportation Planning Organization i Executive Summary The Argyle Forest area is a highly congested transportation area located in southern Duval County. SR 9A (I-295) and SR 21 (Blanding Boulevard) are regionally significant facilities within the area and experience severe traffic congestion. The section of Blanding Boulevard south of I-295 and the I-295 interchange with Blanding Boulevard are regularly reported as one of the most congested locations within the North Florida Transportation Planning Organization s (North Florida TPO) region. In 2009, Florida Times-Union readers overwhelmingly picked Blanding and I-295 as the worst intersection in Northeast Florida in an unscientific survey. and are two minor arterials that provide access to I-295 and Blanding Boulevard from commercial and residential areas located to the west of Blanding Boulevard. Traffic circulates from these collectors to local streets using connections between and using, Westport Road and. To the west, Old Middleburg Road/Oakleaf Plantation Parkway and SR 23 (Branan Field Chaffee Road) connect to rapidly developing areas in south Duval County and north Clay County. In 2010, construction will begin on a project to build collector-distributor roads and a new interchange at I-295 and. This project, when completed, will result in a significant change in traffic patterns in the study area since travelers will have an alternate route to Blanding Boulevard via to access I-295. The purpose of this project is to prepare a traffic circulation study to evaluate transportation network improvements in the Argyle Area including the following facilities: Parramore Road, Youngerman Circle,,, Argyle Forest Boulevard. The study area includes an area bound by, Blanding Boulevard, and. This study considers not only existing traffic operations and safety needs within the study area, but also evaluates alternatives for improvements to support the shift in traffic that is anticipated as a result of the opening of the I-295/Blanding Boulevard to Collins Road project. The purpose of this report is to summarize the needs identified through a review of the operational and safety data collected. Blanding Boulevard and are highly congested roadways with levels of service below the existing standard and significant crash histories observed on key locations. Other connecting roadways are significantly impacted by the congestion on these roadways. This queue spillback that forms during congested periods is significant such that the level of service alone does not fully capture the operational deficiencies in the area. The pedestrian and bicycle quality of service within the study area are deficient on several facilities. As part of providing a total mobility approach within this community, additional improvements to enhance multimodal transportation options should be considered. These improvements will also support the planned expansion of transit services within the area on Blanding Boulevard. All of the major facilities within the study area experienced crash rates above the statewide average for the facility type and area type with the exception of Argyle Forest Boulevard. However, several intersections of experienced significant crash rates. Ten fatal crashes occurred during the five latest
3 North Florida Transportation Planning Organization ii years when data were available ( ), and 1,525 crashes with injuries occurred. The most fatal and injury crashes occurred on Blanding Boulevard with four crashes involving a fatality and 536 crashes involving an injury. Three fatal crashes and 357 injury crashes occurred on. Factors that contribute to these deficiencies include the poor operating conditions and significant queue spillback from one intersection location to the next. When future conditions are analyzed with the proposed improvements to I-295 to construct a collector-distributor road and new interchange at, significant shifts in traffic occur that provide some congestion relief to Blanding Boulevard and Argyle Forest, but also create additional deficiencies above the projects currently planned or under consideration. Blanding Boulevard within the I-295 interchange area was also a significant safety hot spot where a high crash frequency occurred. However, no additional improvements beyond those proposed through the I-295 collector-distributor/collins Road interchange project are recommended for evaluation as part of this study. Based on the needs identified as part of this project, alternatives were evaluated and a series of potential projects are recommended. These projects include additional capacity improvements, short-term operational and safety improvements, enhanced enforcement and a public information and education campaign. A summary of the recommendations are provide in the table on the following page. The next steps to implementing these strategies would be to program these projects in the Transportation Improvement Program or Unified Work Program.
4 North Florida Transportation Planning Organization iii Summary of Recommendations Strategy Capacity Improvements Widen (4-Lane to 6-Lane Facility) SR 23 to Old Middleburg Road Widen Old Middleburg Road (4-Lane to 6-Lane Facility) to Widen (4-Lane to 6-Lane Facility) Cheswick Oaks Avenue to SR 21 Widen Youngerman Circle (2-Lane to 4-Lane Facility) to Parramore Road Extend (New 4-Lane Facility) Old Middleburg Road to SR 23 (New interchange at SR 23) Extend Wells Road (New 4-Lane Facility) Blanding Boulevard to Subtotal Costs $12.1 million $6.5 million $46.7 million $4.1 million $64.4 million $36.8 million $170.6 million Short-Term Operational And Safety Improvements Removal of landscaping at various intersections to enhance sight $35,000 distance Traffic signal phasing to restrict permitted left-turn movements and $105,000 right-turn on red movements Deploy interconnected signal network $300,000 Enhanced enforcement $15,000 Aggressive driving public information and education campaign $150,000 Subtotal $605,000
5 North Florida Transportation Planning Organization iv Contents 1. Background Purpose Related Projects Florida Department of Transportation (FDOT) Better Jacksonville Plan/City of Jacksonville Projects Jacksonville Transportation Authority Traffic Traffic Data Collection Segment Analysis Intersection Analysis Balanced Delay Method Optimization Method Safety Analysis Future Travel Demand Summary of Needs New Capacity Alternatives Short-Term Safety and Operational Alternatives Roadway Improvements Arterial Traffic Management System Improvements Traffic Signal Modifications Targeted Enforcement Public Information Campaigns Summary Benefit Cost Analysis Appendix A Traffic Data (On CD) Appendix B SYNCHRO Analysis Reports (Balanced Delay Method) (On CD) Appendix C SYNCHRO Analysis Reports (Optimization Method) (On CD) Appendix D Capacity Improvement Cost Estimates (On CD) Appendix E Intersection Sight Distance Diagrams (On CD) Appendix F Intersection Warrant and Capacity Analysis (On CD) Appendix G Crash Collision Diagrams (on CD) Appendix H Benefit Cost Analysis (on CD)
6 North Florida Transportation Planning Organization v List of Figures 1. Study Area Map Related Projects Map Existing Year 2010 AADT and Segment Existing Year 2010 Pedestrian QOS Existing Year 2010 Bicycle QOS Crash Locations Year Crash Severity Year High Crash Locations Year NERPM Model Volumes Base Model (Scenario 1) NERPM Model Volumes No-Build Model 1 (Scenario 2) NERPM Model Volumes No-Build Model 2 (Scenario 3A) NERPM Model Volumes No-Build Model 3 (Scenario 3B) NERPM Model Volumes Build Model (Scenario 4) NERPM Model Volumes Shift in Traffic Between Scenario 1 and 3B NERPM Model Volumes Shift in Traffic Between Scenario 3A and 3B NERPM Model Volumes Shift in Traffic Between Scenario 3B and Proposed New Capacity Improvements Build Out Network Environmental Features Screening Map List of Tables 1. Related Projects List Statewide Minimum Standards Applicable for This Project Existing Conditions Vehicular, Bicycle and Pedestrian Q/ Existing Intersection AM Peak Hour (Balanced Delay Method) Existing Intersection PM Peak Hour (Balanced Delay Method) Movements with Queues Exceeding Capacity AM Peak Movements with Queues Exceeding Capacity PM Peak Existing Intersection AM Peak Hour (Optimization Method) Existing Intersection PM Peak Hour (Optimization Method) Comparison of the Analysis Methods AM Peak Comparison of the Analysis Methods PM Peak Summary of Crash Data Summary of Crash Severity Screenline Comparison of Count and Model Data NERPM Model Volumes and Base Model (Scenario 1) NERPM Model Volumes and No-Build Model 1 (Scenario 2) NERPM Model Volumes and No-Build Model 2 (Scenario 3A) NERPM Model Volumes and No-Build Model 3 (Scenario 3B) NERPM Model Volumes and Build Model (Scenario 4) Comparison of 2035 Model Scenarios Summary of Recommended Capacity Improvements Costs Protected Left Turn Warrant Analysis Level of Service Changes Before and After Safety Improvements Summary of Recommendations... 52
7 North Florida Transportation Planning Organization 1 Technical Memorandum #1 Data Collection 1. Background Argyle Forest is a highly congested area in In 2009, Florida Timessouthern Duval County. SR 9A (I-295) and SR 21 Union readers (Blanding Boulevard) are regionally significant overwhelmingly picked facilities within the area and experience severe Blanding and I-295 as the traffic congestion. The section of Blanding worst intersection in Boulevard south of I-295 and the I-295 Northeast Florida in an interchange with Blanding Boulevard are regularly unscientific survey. reported as one of the most congested locations within the North Florida Transportation Planning Organization s (North Florida TPO) region. In 2009, Florida Times-Union readers overwhelmingly picked Blanding and I-295 as the worst intersection in Northeast Florida in an unscientific survey. 1 and are two minor arterials that provide access to I-295 and Blanding Boulevard from commercial and residential areas located to the west of Blanding Boulevard. Traffic circulates from these collectors to local streets using connections between and using, Westport Road and. To the west, Old Middleburg Road/Oakleaf Plantation Parkway and SR 23 (Branan Field Chaffee Road) connect to rapidly developing areas in south Duval County and north Clay County. The project study area and roadway network is shown in Figure 1. In 2010, construction began on a project to build collector-distributor roads and a new interchange at I-295 and. This project, when completed, will result in a significant change in traffic patterns in the study area since travelers will have an alternate route to Blanding Boulevard via to access I Blanding at I-295 voted worst area intersection, Florida Times-Union (Jacksonville) Saturday, December


8 4 Ricker Roa d ,000 1,500 Feet 21 Æ % 295 ev a rd 23 Æ % Ram part Road Legend Major Roadways Bla nd d Pa rra more Road We stport Road Ram part Road Col Mi ll D riv e rm a n Ci r c le 295 Arg yl e Fo r e st B o ul ev a rd Wells Road 21 Æ % ARGYLE TRAFFIC STUDY Study Area Map Ro a d 295 Argyle Fore st Boul evard le s li ns You n ge Che swick Oa k Ave nue ay e Pa rkw af V i ll ag Oa k le 23 Æ % ar St a p Ram part Road Ol d M id d l eb u rg R o ad S Brana n Field Chaffee Road Ar l gy v ul e Bo t es or ef in g Bo u l Park City Drive Figure 1 2
9 North Florida Transportation Planning Organization 3 2. Purpose The purpose of this project is to prepare a traffic circulation study to evaluate transportation network improvements in the Argyle Area including the following facilities: Parramore Road, Youngerman Circle,,,. The study area includes an area bound by, Blanding Boulevard, and. This study will consider not only existing traffic operations and safety needs within the study area, but evaluate alternatives for improvements to support the shift in traffic that is anticipated as a result of the opening of the I-295/Blanding Boulevard to project. 3. Related Projects Several projects are currently in design or construction within the project area. These projects will have a significant impact on traffic circulation within the study area. The following provides a summary of the status of each project. These projects are listed in Table 1 and shown in Figure 2. Table 1. Related Projects List Map Project Name Responsible Status No. Agency # 1 New I-295/ Interchange and FDOT Under construction Collector Distributor Lane System # 2 Well Road Extension PD&E Study FDOT Dropped after alternative public meeting # 3 (Blanding to Pine Verde) City of Jacksonville Design Phase # 4 (Rampart to Shindler) City of Jacksonville Design Phase # 5 Parramore Road Extension (to City of Jacksonville Design Phase Youngerman Circle) # 6 Phase 2 ( to City of Jacksonville Design Phase 103 rd Street) # 7 Phase 2 ( to City of Jacksonville Construction Phase Blanding Boulevard) # 8 Extension (Shindler Road to City of Jacksonville Construction Phase Old Middleburg Road) - Bus Rapid Transit on Blanding Boulevard JTA Planned 3.1 Florida Department of Transportation (FDOT) Recent projects have been proposed by FDOT to improve traffic circulation within the study area including construction of a new interchange at I-295 and that is proposed as part of a collector distributor lane system with the I-295/Blanding Boulevard interchange. The project began construction in 2010.
10 Legend Projects Under Construction Projects Committed & In Design Additional Recommended Improvements Major Roadways ,000 1,500 Feet # 6 Ricker Road Branan Field Chaffee Road Oakleaf Village Parkway Old Middleburg Road S # 8 Staples Mill Drive Cheswick Oak Avenue # 4 Westport Road Park City Drive # 5 # 7 # 1 Youngerman Circle # 2 Blanding Boulevard # 3 Wells Road ARGYLE TRAFFIC STUDY Related Projects Map Figure 2 4
11 North Florida Transportation Planning Organization 5 In 2005, The FDOT prepared a Project Development and Environment (PD&E) Study for the extension of Wells Road from Blanding Boulevard to. The purpose of the project was to relieve traffic on Blanding Boulevard that weaves between these two intersections. The project was carried forward to an alternatives public meeting and was then dropped based on public controversy associated with wetland impacts to the Ortega River. 3.2 Better Jacksonville Plan/City of Jacksonville Projects As part of the Better Jacksonville Plan, the following projects are proposed within or adjacent to the study area: The following projects have been identified as being in design. (Blanding to Pine Verde) - Reconstruct to a four-lane section with medians, bike lanes, sidewalks and curb & gutter on both sides. Budget: $14.1 million. (Rampart to Shindler) - Reconstruct to a four-lane section with landscaped median(s), bike lanes, sidewalks and curb & gutter on both sides. Budget: $20.5 million. Parramore Road Extension (to Youngerman Circle) - Construct a new, two-lane section with curbs, gutters, sidewalks and bike lanes on both sides. Budget: $267,600. (Design only) Phase 2 (Collins to 103rd) -Widen and resurface two-lane roadway to include paved shoulders, drainage improvements and sidewalks. Budget: $18.7 million. The following projects have been identified as being under construction. Phase 2 (Rampart to Blanding) - Reconstruct to a four-lane section with bike lanes, sidewalks and curb & gutter on both sides. Budget: $25.2 million Extension (Shindler to Old Middleburg) - Construct a new, two-lane section with curbs, gutters, sidewalks and bike lanes on both sides. This section will eventually be widened to a four-lane divided roadway with landscaped median(s). Budget: $9.2 million. 3.3 Jacksonville Transportation Authority The Jacksonville Transportation Authority is currently considering implementing Bus Rapid Transit (BRT) service on Blanding Boulevard through the study area, also known as the Southeast Corridor BRT. North of the project study area, a dedicated bus lane pilot project was implemented in The project is included in the North Florida TPO Cost Feasible Plan.
12 North Florida Transportation Planning Organization 6 4. Traffic 4.1 Traffic Data Collection Traffic data were collected from a variety of sources including existing traffic counts performed by the FDOT, City of Jacksonville, North Florida Transportation Planning Organization and by HNTB for this project. The traffic data collected is documented in Appendix A. 4.2 Segment Analysis For planning purposes the FDOT has adopted statewide minimum Level of Service () standards for roadway facilities in Rule is a qualitative measure of the effectiveness of how well a facility operates stratified into six letter grades (A-F). is determined using methods defined in the Transportation Research Board s Highway Capacity Manual. The following table summarizes the minimum allowed during the peak hour. Table 2. Statewide Minimum Standards Applicable For This Project Area Strategic Intermodal System and FIHS Facilities Other State Roads Limited-Access Highways Other Facilities Other Multi- Lane Two- Lane Urbanized Areas Over 500,000 D(E) D D D The values in parenthesis apply to general use lanes only when exclusive through lanes exist. The standard that applies to the facilities in this project is D for state roads. The City of Jacksonville has also adopted D for local roadways. In addition to the traffic flow, the quality of service (QOS) for bicycles and pedestrians within the roadway environment were also analyzed. The and QOS analysis was performed using the FDOT Generalized Quality/Level of Service Handbook. Table 3 provides a summary of the and QOS for the major roadways within the study area. Figures 3, 4 and 5 show the, pedestrian QOS and bicycle QOS for each of the major facilities within the study area.
13 North Florida Transportation Planning Organization 7 Table 3 - Existing Conditions - Vehicular, Bicycle & Pedestrian Q/ Roadway S.No. Roadway Segment S. No. Segment Existing Traffic Count Traffic Counts (Year 2010) Maximum # Lanes Service Volume Div/Undiv in Both Direction Length Length Length of S/W On Both Side Length of S/W on One Side Length of Bike Lane/ Paved Sidewalk Coverage Bike Lane/ Paved Shoulder Vehicle Bicycle Pedestrian (For D) (Miles) (Ft) (Ft) (Ft) (Ft) (%) (%) () (QOS) (QOS) 1 Branan Field Chaffee Road to Old Middleburg Road S 18,348 29,880 Divided ,224 4,224-2, C D C 2 Old Middleburg Road to Staples Mill Drive 18,348 29,880 Divided ,280 5,280-2, C D C 3 Staples Mill Drive to 18,348 29,880 Divided ,224 4,224-2, C D C 1 4 to Cheswick Oak Avenue 31,320 29,880 Divided E D C 5 Cheswick Oak Avenue to Westport Road 31,320 29,880 Divided ,808 5,808-2, E D C 6 Westport Road to 31,320 29,880 Divided ,280 5,280-2, E D C 7 to Youngerman Circle 32,377 29,880 Divided ,224 4,224-2, F D C 8 Youngerman Circle to Blanding Boulevard 32,377 29,880 Divided ,224 4,224-2, F D C 1 to Westport Road 7,872 13,680 Undivided ,280 2, C F D 2 2 Westport Road to 7,872 13,680 Undivided , , C D D 3 to Blanding Boulevard 17,683 29,880 Divided ,920 7,920-7, C B C 1 Wells Road to 86,860 50,300 Divided , F F F 2 to Youngerman Circle 86,860 67,300 Divided F F F 3 Youngerman Circle to I-295 SB-EB Ramps 86,860 67,300 Divided F F F 3 Blanding Boulevard 4 I-295 SB-EB Ramps to I-295 NB-WB Ramps 86,860 67,300 Divided F F F 5 I-295 NB-WB Ramps to Lake Gary Boulevard 86,860 67,300 Divided , F F F 6 Lake Gary Boulevard to Hicks Road 32,068 50,300 Divided , C F F 7 Hicks Road to 32,068 50,300 Divided C F F 4 Youngerman Circle 1 Youngerman Court to Blanding Boulevard 20,884 29,880 Divided ,752-6, C F D 2 to Youngerman Court 10,263 13,680 Undivided ,056-1, D F D 5 1 to 10,923 29,880 Divided ,640 2,640-2, C B C Note: Traffic count taken from 2009 FDOT Level of Service Report CD and used 1% growth till Traffic count taken from 2008 Duval County Count Data and used 1% growth till 2010.
14 Legend Major Roadways Level of Service A B C D E F ,000 1,500 Feet Ricker Road Branan Field Chaffee Road 18,348 Oakleaf Village Parkway Old Middleburg Road S 18,348 Staples Mill Drive 18,348 Cheswick Oak Avenue 7,872 31,320 Westport Road 7,872 31,320 Park City Drive 10,923 32,377 10,263 20,884 Youngerman Circle 17,683 32,377 Blanding Boulevard 32,068 86,860 Wells Road ARGYLE TRAFFIC STUDY Existing Year 2010 AADT and Segment Figure 3 8
15 Legend Major Roadways Level of Service A B C D E F ,000 1,500 Feet Ricker Road Branan Field Chaffee Road Oakleaf Village Parkway Old Middleburg Road S Staples Mill Drive Cheswick Oak Avenue Westport Road Park City Drive Youngerman Circle Blanding Boulevard Wells Road ARGYLE TRAFFIC STUDY Existing Year 2010 Pedestrian QOS Figure 4 9
16 Legend Major Roadways Level of Service A B C D E F ,000 1,500 Feet Ricker Road Branan Field Chaffee Road Oakleaf Village Parkway Old Middleburg Road S Staples Mill Drive Cheswick Oak Avenue Westport Road Park City Drive Youngerman Circle Blanding Boulevard Wells Road ARGYLE TRAFFIC STUDY Existing Year 2010 Bicycle QOS Figure 5 10
17 North Florida Transportation Planning Organization Intersection Analysis In addition to analyzing the segment, each major intersection was analyzed. The analysis was performed using SYNCHRO traffic analysis software. Existing traffic signal timings were not available for use in the analysis at the time of this report; therefore, estimating of the signal timings was required. Two alternate methods for analyzing the intersections were used Balanced Delay Method Table 4 and Table 5 summarize the AM and PM peak-hour results of the intersection using the FDOT District 2 s preferred method for balancing delays within the major movements at each intersection and ensuring no individual movement operates at F to achieve a higher overall intersection. The individual movement signal timings were balanced to achieve similar delays along all the approaches of an intersection. This method is the preferred method for analyzing signalized intersections and reflects the logic most commonly used in preparation of signal timing plans. Some of the movements within this project were still operating at F even with the delays balanced and these movements are listed in Tables 4 and 5. The SYNCHRO results of this operational analysis are provided in Appendix B As part of the analysis, the following intersections were reported to operate at E/F either in the AM or in the PM peak, which is below the standard for these facilities ( AM/ PM): at Branan Field Chaffee Road (D/E) at Youngerman Circle (C/E) at Blanding Boulevard (C/E) Blanding Boulevard at Youngerman Circle (E/E) Blanding Boulevard at I-295 SB/EB Ramps (F/E) Blanding Boulevard at I-295 NB/WB Ramps (C/E) Blanding Boulevard at Lake Gray Boulevard (D/E) Blanding Boulevard at (E/E) Even though the at the other intersections along are within the threshold (<= D), the queues near these failing intersections spillback into the adjacent intersections leading to the congestion of these intersections. Queue spillbacks in this area are a historical problem and can be identified in the 95% queue length values reported during the AM and PM peak hours in Tables 4 and 5. Table 6 shows the individual movements near an intersection with queue spill back issues during the AM Peak and Table 7 shows these movements during PM peak.
18 North Florida Transportation Planning Organization 12 Table 4 - Existing Intersection AM Peak Hour (Balanced Delay Method) Individual Movement Intersection Control Type MOE Eastbound Westbound Northbound Southbound Argyle Forest Blvd. & Branan Field Chaffee Rd. Argyle Forest Blvd. & Old Middleburg Rd. Argyle Forest Blvd. & Staples Mill Dr.* Stop Controlled Argyle Forest Blvd. & Shindler Dr. Argyle Forest Blvd. & Cheswick Oak Ave. Argyle Forest Blvd. & Westport Rd. Argyle Forest Blvd. & Rampart Rd. Argyle Forest Blvd. & Meadow Bend Dr. * Stop Controlled Argyle Forest Blvd. & Youngerman Cir. Argyle Forest Blvd. & Blanding Blvd. Blanding Blvd. & Youngerman Cir. Blanding Blvd. & I-295 SB/EB Ramps Blanding Blvd. & I-295 NB/WB Ramps Blanding Blvd. & Lake Gray Blvd. Blanding Blvd. & Hicks Rd. Blanding Blvd. & Collins Rd. Collins Rd. & Rampart Rd. Collins Rd. & Westport Rd.* Stop Controlled Collins Rd. & Shindler Dr. Stop Controlled Left Turn Through Right Turn Left Turn Through Right Turn Left Turn Through Right Turn Left Turn Through Right Turn C D D D D D B D D C D D D D D D 95% Queue (ft) m147 m129 m D E E C D A C D D C C C D D B B 95% Queue (ft) m m13 87 # A - - B - - F C C E C C - - F D 95% Queue (ft) C A - - B D C - C B C - C 95% Queue (ft) C B C C - C - C C C C - 95% Queue (ft) A A - - C D D - D A C - D 95% Queue (ft) m m m74 - m0 A D C D C D D D D C B B C C D B 95% Queue (ft) m15 m m107 m3 m21 A F F F B B B - - F B 95% Queue (ft) D B - - C C C - C C C - C 95% Queue (ft) m360 m D - D D D - - B A D - D B 95% Queue (ft) , E E D E E E E E E F C E E E E C 95% Queue (ft) m48 #867 #867 m m95 F - E C F F A - F - F F 95% Queue (ft) # m506 m#2,327 #1, D - D C A - - D D - D B D 95% Queue (ft) m154 m D D D D D D D D D F C C D D D C 95% Queue (ft) m m1 m117 m10 D D D D D D E C C - D D D D C D 95% Queue (ft) m m370 m370 E E E E E E E E C E E E E E E E 95% Queue (ft) #676 #544 #544 # # D D D D D D C D D D D D D D D D 95% Queue (ft) m A A - C - C C - 95% Queue (ft) C - C A A - - C % Queue (ft) Intersection D Intersection Delay (Sec) Intersection V/C Ratio D A C C B C B C C E F C D D E D C C Note: * - HCM Unsignalized Intersection Capacity Analysis results were used. m - Volume for 95th percentile queue is metered by upstream signal. # - 95th percentile volume exceeds capacity, queue may be longer. Queue shown is maximum after two cycles. ~ - Volume exceeds capacity, queue is theoretically infinite. Queue shown is maximum after two cycles.
19 North Florida Transportation Planning Organization 13 Table 5 - Existing Intersection PM Peak Hour (Balanced Delay Method) Individual Movement Intersection Control Type MOE Eastbound Westbound Northbound Southbound Argyle Forest Blvd. & Branan Field Chaffee Rd. Argyle Forest Blvd. & Old Middleburg Rd. Argyle Forest Blvd. & Staples Mill Dr.* Stop Controlled Argyle Forest Blvd. & Shindler Dr. Argyle Forest Blvd. & Cheswick Oak Ave. Argyle Forest Blvd. & Westport Rd. Argyle Forest Blvd. & Rampart Rd. Argyle Forest Blvd. & Meadow Bend Dr. * Stop Controlled Argyle Forest Blvd. & Youngerman Cir. Argyle Forest Blvd. & Blanding Blvd. Blanding Blvd. & Youngerman Cir. Blanding Blvd. & I-295 SB/EB Ramps Blanding Blvd. & I-295 NB/WB Ramps Blanding Blvd. & Lake Gray Blvd. Blanding Blvd. & Hicks Rd. Blanding Blvd. & Collins Rd. Collins Rd. & Rampart Rd. Collins Rd. & Westport Rd.* Stop Controlled Collins Rd. & Shindler Dr. Stop Controlled Left Turn Through Right Turn Left Turn Through Right Turn Left Turn Through Right Turn Left Turn Through Right Turn C E E E D D F D D E E D E E F E 95% Queue (ft) 10 #363 #363 # # # D D D C C E D D D D D D D D D D 95% Queue (ft) m60 m339 m12 m420 m372 m C - - B - - F D D F C C - - F F 95% Queue (ft) Err F A - - D A D - D C D - D 95% Queue (ft) m# #908 m D B D B - D - D D B D - 95% Queue (ft) - #561 m35 m330 m F A - - E B D - E B E - E 95% Queue (ft) m# m#1,122 m m66 - m208 D D D D D D D D D D C D D D D D 95% Queue (ft) # m19 m13 m805 m m217 m20 m240 C - - B - - F F F F F F - - F F 95% Queue (ft) E B - - E B D - E D E - E 95% Queue (ft) # # #466 E - E F A - - F A E - E E 95% Queue (ft) # m#1,038 m64 F F E E E E F D D E E F E E E E 95% Queue (ft) #448 # # m99 m#990 m#1,141 D - E D F F D - E - E D 95% Queue (ft) # m E - D F B - - E E - D D E 95% Queue (ft) # m393 m393 E E D E E D E D D F E B D D D E 95% Queue (ft) m17 m#598 m37 E E E E E E E C C - E E E E C E 95% Queue (ft) m m#838 m#838 E E E E E E E E C D E E E E E E 95% Queue (ft) #303 # # #644 #644 E D D D D D D D F C D D D D E D 95% Queue (ft) m159 m124 m #331 #331 m72 m304 m90 97 #570 # A A - C - C C - 95% Queue (ft) F - F A A - - F % Queue (ft) Intersection E Intersection Delay (Sec) Intersection V/C Ratio D B D C D D C E E E E E E D E D D D Note: * - HCM Unsignalized Intersection Capacity Analysis results were used. m - Volume for 95th percentile queue is metered by upstream signal. # - 95th percentile volume exceeds capacity, queue may be longer. Queue shown is maximum after two cycles. ~ - Volume exceeds capacity, queue is theoretically infinite. Queue shown is maximum after two cycles.
20 North Florida Transportation Planning Organization 14 Table 6. Movements with Queue Exceeding Capacity AM Peak Intersection Name Movements with Queue Spillback at Old Middleburg Road WB Thru Blanding Boulevard at Youngerman Circle NB Thru and Right Blanding Boulevard at I-295 SB/EB Ramps EB Left, NB Right and SB Left Blanding Boulevard at Collins Rd. EB Left, Thru and Right, WB Left and NB Thru Table 7. Movements with Queue Exceeding Capacity PM Peak Intersection Name Movements with Queue Spillback at Branan Field Chaffee Road EB Thru and Right, WB Left, NB Left and SB Left at EB Left and WB Thru and Right at Cheswick Oak Avenue EB Thru at Westport Road EB Left and WB Thru and Right at EB Left at Youngerman Circle EB Left, WB Thru and Right and SB Right at Blanding Boulevard NB Left and SB Thru Blanding Boulevard at Youngerman Circle EB Left and Thru, NB Left, and SB Thru and Right Blanding Boulevard at I-295 SB/EB Ramps EB Right Blanding Boulevard at I-295 NB/WB Ramps NB Left Blanding Boulevard at Lake Gray Boulevard SB Thru Blanding Boulevard at Hicks Road SB Thru and Right Blanding Boulevard at WB Thru and Right, NB Thru, and SB Thru and Right at WB Thru and Right, and SB Thru and Right WB = westbound, EB = eastbound, NB = northbound, SB = southbound Optimization Method Table 8 and Table 9 summarize the results of the intersection using SYNCHRO s optimization of the signal timings. This method results in a more aggressive signal timing that will allow individual movements to fail in order to achieve an acceptable overall at the intersection. This method can lead to excessive delays for movements on minor approaches to the intersections and result in significant queue spillback. This approach is shown for illustrative purposes. The SYNCHRO results of this operational analysis are provided in Appendix C As part of the analysis, the following intersections were reported to operate at E/F either in the AM or in the PM peak, which is below the standard for these facilities ( AM/ PM): Argyle Forest Blvd. & Branan Field Chaffee Rd. (D/E) Blanding Blvd. & I-295 SB/EB Ramps (F/E) Blanding Blvd. & Collins Rd. (E/E)
21 North Florida Transportation Planning Organization 15 Table 8 - Existing Intersection AM Peak Hour (Optimization Method) Individual Movement Intersection Intersection Intersection Intersection Control Type MOE Eastbound Westbound Northbound Southbound Delay V/C Ratio Left Turn Through Right Turn Left Turn Through Right Turn Left Turn Through Right Turn Left Turn Through Right Turn (Sec) D D D D F F B C B B B B Argyle Forest Blvd. & Branan Field Chaffee Rd. D F C B D % Queue (ft) C D D D D D B B B B B B Argyle Forest Blvd. & Old Middleburg Rd. D D B B C % Queue (ft) m A - - B - - F C C E C C Argyle Forest Blvd. & Staples Mill Dr.* Stop Controlled - - F D A % Queue (ft) B A - - B C D - D Argyle Forest Blvd. & Shindler Dr. A B - D B % Queue (ft) C C D B - C - C Argyle Forest Blvd. & Cheswick Oak Ave. C C C - C % Queue (ft) A A - - A A D - D Argyle Forest Blvd. & Westport Rd. A A - D A % Queue (ft) m m77 - m0 D B A F B D D D D B B C Argyle Forest Blvd. & Rampart Rd. C C D C C % Queue (ft) m m8 m41 A F F F B B B Argyle Forest Blvd. & Meadow Bend Dr. * Stop Controlled - - F B B % Queue (ft) B A - - B B D - D Argyle Forest Blvd. & Youngerman Cir. A B - D B % Queue (ft) D - E E C - - A A Argyle Forest Blvd. & Blanding Blvd. E - C A C % Queue (ft) F F D E E F F C C F B C Blanding Blvd. & Youngerman Cir. F E C B C % Queue (ft) #481 # m m# F - E C F F A - Blanding Blvd. & I-295 SB/EB Ramps F - F F F % Queue (ft) # #2,857 #1, E - E D A - - D D Blanding Blvd. & I-295 NB/WB Ramps - E C D D % Queue (ft) m276 m E E E E E E F A A F A A Blanding Blvd. & Lake Gray Blvd. E E A A B % Queue (ft) m m F E E F E E F A A - A A Blanding Blvd. & Hicks Rd. F E A A A % Queue (ft) m m153 m153 F E E F E E F D B F D D Blanding Blvd. & Collins Rd. E F D D E % Queue (ft) #711 #544 #544 # # E D D E D D C C E C C C Collins Rd. & Rampart Rd. D D D C D % Queue (ft) m A A - C - C Collins Rd. & Westport Rd.* Stop Controlled - - C - C % Queue (ft) C - C A A - Collins Rd. & Shindler Dr. Stop Controlled - C - - C % Queue (ft) Note: * - HCM Unsignalized Intersection Capacity Analysis results were used. m - Volume for 95th percentile queue is metered by upstream signal. # - 95th percentile volume exceeds capacity, queue may be longer. Queue shown is maximum after two cycles. ~ - Volume exceeds capacity, queue is theoretically infinite. Queue shown is maximum after two cycles.
22 North Florida Transportation Planning Organization 16 Table 9 - Existing Intersection PM Peak Hour (Optimization Method) Individual Movement Intersection Control Type MOE Eastbound Westbound Northbound Southbound Argyle Forest Blvd. & Branan Field Chaffee Rd. Argyle Forest Blvd. & Old Middleburg Rd. Argyle Forest Blvd. & Staples Mill Dr.* Stop Controlled Argyle Forest Blvd. & Shindler Dr. Argyle Forest Blvd. & Cheswick Oak Ave. Argyle Forest Blvd. & Westport Rd. Argyle Forest Blvd. & Rampart Rd. Argyle Forest Blvd. & Meadow Bend Dr. * Stop Controlled Argyle Forest Blvd. & Youngerman Cir. Argyle Forest Blvd. & Blanding Blvd. Blanding Blvd. & Youngerman Cir. Blanding Blvd. & I-295 SB/EB Ramps Blanding Blvd. & I-295 NB/WB Ramps Blanding Blvd. & Lake Gray Blvd. Blanding Blvd. & Hicks Rd. Blanding Blvd. & Collins Rd. Collins Rd. & Rampart Rd. Collins Rd. & Westport Rd.* Stop Controlled Collins Rd. & Shindler Dr. Stop Controlled Left Turn Through Right Turn Left Turn Through Right Turn Left Turn Through Right Turn Left Turn Through Right Turn D E E F C C F D D D E D E E E D 95% Queue (ft) 12 #422 #422 # # C D D D D F D D D C D C D D D C 95% Queue (ft) m63 m317 m19 m471 m415 m C - - B - - F D D F C C - - F F 95% Queue (ft) Err F A - - C A E - D C B - E 95% Queue (ft) m# m # D C D B - E - D C C E - 95% Queue (ft) - m554 m32 m376 m648 - # F A - - C A E - F A C - F 95% Queue (ft) m# ,065 m m79 - m#306 E C C E D D D D D D C D D D D D 95% Queue (ft) # m22 m14 m835 m m#275 m C - - B - - F F F F F F - - F F 95% Queue (ft) F B - - D B D - F D D - F 95% Queue (ft) m# # #546 F - F F A - - C A F - D C 95% Queue (ft) #247 - # # #1,101 m56 F F E E E E E C C E C D F E C C 95% Queue (ft) #520 #513 # m# m104 m754 m#980 D - E D F F D - E - E D 95% Queue (ft) # m443 m496 m# E - D F B - - D D - E D D 95% Queue (ft) # E E E E E E E B B F A A E E C A 95% Queue (ft) m m E E E E E E E A A - A A E E A A 95% Queue (ft) m F E E F F F F D D F D D E F D D 95% Queue (ft) # #325 #303 #303 # E C C E D D D D F B C C D D E C 95% Queue (ft) m163 m132 m m63 m266 m A A - C - C C - 95% Queue (ft) F - F A A - - F % Queue (ft) Intersection E Intersection Delay (Sec) Intersection V/C Ratio D B C C C D C D D D E D C B E D D D Note: * - HCM Unsignalized Intersection Capacity Analysis results were used. m - Volume for 95th percentile queue is metered by upstream signal. # - 95th percentile volume exceeds capacity, queue may be longer. Queue shown is maximum after two cycles. ~ - Volume exceeds capacity, queue is theoretically infinite. Queue shown is maximum after two cycles.
23 North Florida Transportation Planning Organization 17 E/F are reported at several of the major intersections with the first method that are not reported using this optimization method. However, the approach delay associated with the intersecting minor cross streets increases at these intersections. A comparison between the AM Peak hour measure of effectiveness and the PM Peak hour measure of effectiveness between the two methods shows that the and intersection delay values reported using method one are either equal to or higher than those values reported using method two. Table 10 below compares the values for intersections differing in between both the methods during the AM Peak and Table 11 shows similar values for PM Peak. Table 10. Comparison Between the Analysis Methods AM Peak Intersection Name (Method 1) (Method 2) at Old Middleburg Road D C at C B at Westport Road B A at Youngerman Circle C B Blanding Boulevard at Youngerman Circle E C Blanding Boulevard at Lake Gray Boulevard D B Blanding Boulevard at Hicks Road D A Table 11. Comparison Between the Analysis Methods PM Peak Intersection Name (Method 1) (Method 2) at D C at Westport Road D C at Youngerman Circle E D at Blanding Boulevard E D Blanding Boulevard at Youngerman Circle E D Blanding Boulevard at I-295 NB/WB Ramps E D Blanding Boulevard at Lake Gray Blvd. E C Blanding Boulevard at Hicks Rd. D B However in both cases the queue spillback effects result in that are reported to be better than the operations experienced by the driver as previously reported in Table 6 and 7. The queue spillback problems are significant and result in alone being insufficient to fully describe the operational and safety needs in the area.
24 North Florida Transportation Planning Organization Safety Analysis Five years of crash data were obtained within the study area from the FDOT, These data were mapped and the crash rates (crashes per million vehicle miles) compared to the average crash rates in North Florida for similar types of roadways. Table 12 provides a summary of the total number of crashes on each facility, the crash rates, the average crash rate and the ranking of each intersection by crash location and crash rate. Blanding Boulevard experienced the most crashes, 948 crashes, during this period and the crash rate was nearly twice the average crash rate of similar facilities. Although Argyle Forest Boulevard experienced 604 crashes over the last five years, this was the only facility in the study area with a crash rate below the average crash rate. All of the other major roadways in the area experienced crash rates greater than the average with the exception of Parramore Road. Within the study area, ten fatal crashes occurred during the five year analysis period, and 1,525 crashes with injuries occurred. The most fatal and injury crashes occurred on Blanding Boulevard with four crashes involving a fatality and 536 crashes involving an injury. Three fatal crashes and 357 injury crashes occurred on. Table 13 provides a summary of the crash severity by year by facility. The locations with the highest crashes are: Blanding Boulevard at I-295 interchange area 237 crashes Blanding Boulevard at 221 crashes Blanding Boulevard at Youngerman Circle 220 crashes Blanding Boulevard at 173 crashes Blanding Boulevard at Wells Road 135 crashes at Cheswick Oaks Avenue 69 crashes at Old Middleburg Road 58 crashes at 46 crashes at 42 crashes at Branan Field Chaffee Road 38 crashes at 37 crashes Argyle Forest near Spencers Trace Drive 15 crashes at Staples Mill Drive 14 crashes Figure 6 shows the crashes by location. Figure 7 shows the crash severity. Figure 8 shows the number of crashes at the highest locations.
25 Table 12 Summary of Crash Data S.No. Roadway Length (ft.) Length (mi) ADT North Florida Transportation Planning Organization 19 Total Crashes Crashes Per MVM FDOT Average (Crashes per MVM) Ranking Crash Rate 1 SR 21 Blanding Boulevard 6, , , , Youngerman Circle 5, , Parramore Road 2, Wells Road* 4, , , , , , Westport Road* 3, , Cheswick Oaks Avenue* 1, , * 2, , Staples Mill Drive* 4, , Old Middleburg Road 3, , SR 23 Branan Field Chaffee Road 3, , Note: 1) Crash Data was reported between the Years ) ADT is calcualted as the weighted average of individual roadways segments along the corridor. Traffic count taken from 2009 FDOT Level of Service Report CD and used 1% growth till Traffic count taken from 2008 FDOT Traffic CD Online and used 1% growth till Highlighted values represent sections that have crash rate higher than the FDOT Statewide Average Crash Rate values, Year * Roadways with no ADT data, NERPM Scenario 1 volume data is used. Ranking Total Crashes
26 North Florida Transportation Planning Organization 20 Table 13 Summary of Crash Severity Road Name Year Fatality Injury PDO Total Crashes SR 21 (Blanding Boulevard) Argyle Forest Boulevard Youngerman Circle Parramore Road Wells Road Westport Road Total Total Total Total Total Total Total Total
27 North Florida Transportation Planning Organization 21 Table 13 Summary of Crash Severity (continued) Road Name Year Fatality Injury PDO Total Crashes Total Total Total Total Total Study Area Total 10 1,525 1,137 2,672 Cheswick Oak Avenue Staples Mill Drive Old Middleburg Road SR 23 (Branan Field Chaffee Road)
28 Legend Year Year Year Year Major Roadways ,000 1,500 Feet Ricker Road Branan Field Chaffee Road Old Middleburg Road S Westport Road Park City Drive Blanding Boulevard Oakleaf Village Parkway Staples Mill Drive Cheswick Oak Avenue Youngerman Circle Wells Road ARGYLE TRAFFIC STUDY Crash Locations - Year Figure 6 22
29 Old Middleburg Road S Oakleaf Village Parkway Branan Field Chaffee Road Park City Drive Ricker Road Wells Road Blanding Boulevard Youngerman Circle Staples Mill Drive Cheswick Oak Avenue Westport Road ,000 1,500 Feet ARGYLE TRAFFIC STUDY Crash Severity - Year Figure 7 23 Legend Fatal Crash Property Damage Only Crash Major Roadways Injury Crash
30 Legend Crashes Major Roadways ,000 1,500 Feet Branan Field Chaffee Road 38 Crashes in 5 Years 220 Crashes in 5 Years Oakleaf Village Parkway Old Middleburg Road S 58 Crashes in 5 Years 14 Crashes in 5 Years 37 Crashes in 5 Years Staples Mill Drive Cheswick Oak Avenue 15 Crashes in 5 Years 69 Crashes in 5 Years Westport Road Ricker Road 46 Crashes in 5 Years 21 Crashes in 5 Years Park City Drive 42 Crashes in 5 Years 12 Crashes in 5 Years 44 Crashes in 5 Years 173 Crashes in 5 Years 237 Crashes in 5 Years Youngerman Circle 135 Crashes in 5 Years Blanding Boulevard Wells Road 221 Crashes in 5 Years ARGYLE TRAFFIC STUDY High Crash Locations - Year Figure 8 24
31 North Florida Transportation Planning Organization Future Travel Demand An integral part of this project is to consider the result of shifts in travel patterns that will result from the construction of the I-295 project at Blanding Boulevard and. To understand and assess the shift in traffic patterns that will occur, travel demand forecasts were prepared for several alternate scenarios and compared using the Northeast Florida Regional Planning Model (NERPM 4). The following NERPM models were developed: Base Model (Scenario 1): This model scenario was used to evaluate the performance of the existing NERPM model when compared to traffic counts. The NERPM model base year was 2005 and a 2010 network was created reflecting roadway improvements opened from 2005 to No-Build Models: Three No-Build models were developed, 1) No-Build Model 1 (Scenario 2): This model utilizes the Base Model network with no additional improvements to roadways and is modeled using the 2035 Socio-economic data to obtain the No-Build year 2035 AADT on the roadways within the study area. 2) No-Build Model 2 (Scenario 3A): This model is modeled using the 2035 socio-economic data, but includes the below identified roadway improvements as these projects are either in design phase or under construction within the study area and are anticipated to be completed by These roadway improvement projects are: a. I-295 Collector-Distributor and Interchange. b. four-laning from to. c. extension from to Old Middleburg Road. 3) No-Build Model 3 (Scenario 3B): This model utilizes the same network as No-Build Model 2 with one additional roadway improvement listed as below. The network uses the year 2035 socio-economic data. This model provides a basis for evaluating the benefits realized by the construction of the Parramore Road extension project. a. Parramore Road extension from Youngerman Circle to Build Model (Scenario 4): This model scenario includes two new system improvements within the study area listed below. The network uses the year 2035 socio-economic data. b. extension from Old Middleburg Road to Branan Field Chaffee Road. c. Wells Road extension from Blanding Boulevard to. When comparing the Base Year model to traffic count data, two key screenline locations were chosen west of and east of. The following table summarizes the comparison between the screenline volumes and count volumes.
32 North Florida Transportation Planning Organization 26 Table 14. Screenline Comparison of Count and Model Data West of East of Count Data (AADT) 31,320 32,377 7,872 7,683 Total 39,192 40,060 Model Data (AADT) 23,450 26,100 11,100 15,150 Total 34,550 41,250 % of Count Data 88.15% 102.9% Since these screenlines model volumes are within 15 percent of the count volumes, the model was deemed acceptable for use for the purposes of comparing traffic shifts between roadways within the study area. Tables 15 thru 19 provides a summary of the model volumes with Scenario 1 thru Scenario 4. Figures 9 thru 13 shows a comparison of the count data with model volumes at key locations within the study area for these Scenarios.
33 North Florida Transportation Planning Organization 27 Table 15 - NERPM Model Volumes - Base Model (Scenario 1) NERPM Volume NERPM Volume (rounded) # Lanes in Both Direction Roadway Segment Segment Length Vehicle S. No AADT 2010 AADT (Miles) () 1 Branan Field Chaffee Road to Old Middleburg Road S 16,194 16, C 2 Old Middleburg Road to Staples Mill Drive 6,649 6, C 3 Staples Mill Drive to 8,964 8, C 1 4 to Cheswick Oak Avenue 11,671 11, C 5 Cheswick Oak Avenue to Westport Road 17,519 17, C 6 Westport Road to 23,448 23, D 7 to Youngerman Circle 26,101 26, D 8 Youngerman Circle to Blanding Boulevard 24,788 24, D 1 to Westport Road 6,962 6, C 2 2 Westport Road to 11,123 11, D 3 to Blanding Boulevard 15,167 15, C 1 Wells Road to 112, , F 2 to Youngerman Circle 105, , F 3 Youngerman Circle to I-295 SB-EB Ramps 94,287 94, F 3 Blanding Boulevard 4 I-295 SB-EB Ramps to I-295 NB-WB Ramps 78,864 78, F 5 I-295 NB-WB Ramps to Lake Gray Boulevard 63,693 63, D 6 Lake Gary Boulevard to Hicks Road 42,908 42, D 7 Hicks Road to 42,757 42, D 4 Youngerman Circle 1 to Youngerman Court 2,779 2, C 2 Youngerman Court to Blanding Boulevard 9,897 9, C 5 1 to 20,835 20, C 6 Westport Road 1 to 2,479 2, C 7 Cheswick Oak Avenue 1 Staples Mill Drive to 12,428 12, D 8 1 to 12,288 12, D 9 Staples Mill Drive 1 to Cheswick Oak Avenue 2,161 2, C 10 Old Middleburg Road S 1 North of 10,312 10, D 11 Branan Field Chaffee Road 1 North of 22,907 22, C Roadway S.No.
34 Legend Major Roadways ,000 1,500 Feet Ricker Road 22,900 Branan Field Chaffee Road 16,200 Oakleaf Village Parkway Old Middleburg Road S 10,300 6,650 Staples Mill Drive 12,300 8,950 11,650 2,150 Cheswick Oak Avenue 12,450 6,950 17,500 Westport Road 2,500 11,100 23,450 Park City Drive 15,150 20,850 26,100 2,800 15,150 9,900 Youngerman Circle 24,800 Blanding Boulevard 42, , ,750 Wells Road ARGYLE TRAFFIC STUDY NERPM Model Volumes - Base Model (Scenario 1) Figure 9 28
35 North Florida Transportation Planning Organization 29 Table 16 - NERPM Model Volumes - No-Build Model 1 (Scenario 2) NERPM Volume NERPM Volume (rounded) # Lanes in Both Direction Roadway Segment Segment Length Vehicle S. No AADT 2035 AADT (Miles) () 1 Branan Field Chaffee Road to Old Middleburg Road S 37,521 37, F 2 Old Middleburg Road to Staples Mill Drive 28,470 28, D 3 Staples Mill Drive to 26,821 26, D 1 4 to Cheswick Oak Avenue 23,271 23, D 5 Cheswick Oak Avenue to Westport Road 43,226 43, F 6 Westport Road to 46,915 46, F 7 to Youngerman Circle 44,242 44, F 8 Youngerman Circle to Blanding Boulevard 37,596 37, F 1 to Westport Road 15,023 15, F 2 2 Westport Road to 22,555 22, F 3 to Blanding Boulevard 27,970 27, D 1 Wells Road to 145, , F 2 to Youngerman Circle 119, , F 3 Youngerman Circle to I-295 SB-EB Ramps 110, , F 3 Blanding Boulevard 4 I-295 SB-EB Ramps to I-295 NB-WB Ramps 93,469 93, F 5 I-295 NB-WB Ramps to Lake Gray Boulevard 75,655 75, F 6 Lake Gary Boulevard to Hicks Road 50,716 50, E 7 Hicks Road to 50,737 50, E 4 Youngerman Circle 1 to Youngerman Court 8,637 8, C 2 Youngerman Court to Blanding Boulevard 16,266 16, C 5 1 to 31,170 31, E 6 Westport Road 1 to 9,868 9, D 7 Cheswick Oak Avenue 1 Staples Mill Drive to 26,658 26, F 8 1 to 19,437 19, F 9 Staples Mill Drive 1 to Cheswick Oak Avenue 17,708 17, F 10 Old Middleburg Road S 1 North of 14,524 14, E 11 Branan Field Chaffee Road 1 North of 60,338 60, F Roadway S.No.
36 Legend Major Roadways ,000 1,500 Feet Ricker Road 60,350 Branan Field Chaffee Road 37,500 Oakleaf Village Parkway Old Middleburg Road S 14,500 28,450 Staples Mill Drive 19,450 26,800 23,250 17,700 Cheswick Oak Avenue 26,650 15,000 43,250 Westport Road 9,850 Park City Drive 22,550 46,900 27,950 31,150 44,250 8,650 27,950 16,250 Youngerman Circle 37,600 Blanding Boulevard 50, , ,000 Wells Road ARGYLE TRAFFIC STUDY NERPM Model Volumes - No-Build Model 1 (Scenario 2) Figure 10 30
37 North Florida Transportation Planning Organization 31 Table 17 - NERPM Model Volumes - No-Build Model 2 (Scenario 3A) NERPM Volume NERPM Volume (rounded) # Lanes in Both Direction Roadway Segment Segment Length Vehicle S. No AADT 2035 AADT (Miles) () 1 Branan Field Chaffee Road to Old Middleburg Road S 51,959 51, F 2 Old Middleburg Road to Staples Mill Drive 10,559 10, C 3 Staples Mill Drive to 18,298 18, C 1 4 to Cheswick Oak Avenue 9,570 9, C 5 Cheswick Oak Avenue to Westport Road 29,897 29, E 6 Westport Road to 34,017 34, F 7 to Youngerman Circle 26,260 26, D 8 Youngerman Circle to Blanding Boulevard 24,254 24, D 1 Old Middleburg Road S to 7,201 7, C 2 to Westport Road 31,457 31, E 2 3 Westport Road to 37,203 37, F 4 to I-295 SB-EB Ramps 47,892 47, F 5 I-295 SB-EB Ramps to I-295 NB-WB Ramps 40,217 40, F 6 I-295 NB-WB Ramps to Blanding Boulevard 29,908 29, E 1 Wells Road to 127, , F 2 to Youngerman Circle 115, , F 3 Youngerman Circle to I-295 SB-EB Ramps 106, , F 3 Blanding Boulevard 4 I-295 SB-EB Ramps to I-295 NB-WB Ramps 86,773 86, F 5 I-295 NB-WB Ramps to Lake Gray Boulevard 65,966 65, D 6 Lake Gary Boulevard to Hicks Road 42,656 42, D 7 Hicks Road to 42,964 42, D 4 Youngerman Circle 1 to Youngerman Court 6,194 6, C 2 Youngerman Court to Blanding Boulevard 10,492 10, C 5 1 to 30,312 30, E 6 Westport Road 1 to 12,182 12, D 7 Cheswick Oak Avenue 1 Staples Mill Drive to 21,368 21, F 8 1 to 19,853 19, F 9 Staples Mill Drive 1 to Cheswick Oak Avenue 9,115 9, C 10 Old Middleburg Road S 1 to 43,695 43, F 11 Branan Field Chaffee Road 1 to 52,653 52, E Roadway S.No. Note: New Roadway Link
38 Legend Major Roadways Proposed Improvements ,000 1,500 Feet Ricker Road 52,650 Branan Field Chaffee Road 51,950 Oakleaf Village Parkway Old Middleburg Road S 43,700 10,550 7,200 Staples Mill Drive 19,850 18,300 9,550 9,100 Cheswick Oak Avenue 21,350 31,450 29,900 Westport Road 12,200 37,200 34,000 Park City Drive 47,900 30,300 26,250 40,200 6,200 29,900 10,500 Youngerman Circle 24,250 Blanding Boulevard 42, , ,150 Wells Road ARGYLE TRAFFIC STUDY NERPM Model Volumes - No-Build Model 2 (Scenario 3A) Figure 11 32
39 North Florida Transportation Planning Organization 33 Table 18 - NERPM Model Volumes - No-Build Model 3 (Scenario 3B) NERPM Volume NERPM Volume (rounded) # Lanes in Both Direction Roadway Segment Segment Length Vehicle S. No AADT 2035 AADT (Miles) () 1 Branan Field Chaffee Road to Old Middleburg Road S 51,689 51, F 2 Old Middleburg Road to Staples Mill Drive 10,305 10, C 3 Staples Mill Drive to 17,356 17, C 1 4 to Cheswick Oak Avenue 10,276 10, C 5 Cheswick Oak Avenue to Westport Road 30,621 30, E 6 Westport Road to 34,873 34, F 7 to Youngerman Circle 24,821 24, D 8 Youngerman Circle to Blanding Boulevard 24,135 24, D 1 Old Middleburg Road S to 7,387 7, C 2 to Westport Road 29,753 29, D 3 Westport Road to 35,639 35, F 2 4 to Parramore Road 43,344 43, F 5 Parramore Road to I-295 SB-EB Ramps 56,253 56, F 6 I-295 SB-EB Ramps to I-295 NB-WB Ramps 41,712 41, F 7 I-295 NB-WB Ramps to Blanding Boulevard 27,020 27, D 1 Wells Road to 127, , F 2 to Youngerman Circle 116, , F 3 Youngerman Circle to I-295 SB-EB Ramps 102, , F 3 Blanding Boulevard 4 I-295 SB-EB Ramps to I-295 NB-WB Ramps 83,853 83, F 5 I-295 NB-WB Ramps to Lake Gray Boulevard 62,915 62, D 6 Lake Gary Boulevard to Hicks Road 39,773 39, D 7 Hicks Road to 40,132 40, D 4 Youngerman Circle 1 to Youngerman Court 7,345 7, C 2 Youngerman Court to Blanding Boulevard 9,432 9, C 5 Parramore Road 1 to Youngerman Circle 11,662 11, D 6 1 to 28,498 28, D 7 Westport Road 1 to 11,386 11, D 8 Cheswick Oak Avenue 1 Staples Mill Drive to 22,153 22, F 9 1 to 18,624 18, F 10 Staples Mill Drive 1 to Cheswick Oak Avenue 8,621 8, C 11 Old Middleburg Road S 1 to 43,737 43, F 12 Branan Field Chaffee Road 1 to 51,660 51, E Roadway S.No. Note: New Roadway Link Scenario 3B is same as Scenario 3A with the Parramore Road Connection added into the network
40 Legend Major Roadways Proposed Improvements ,000 1,500 Feet Ricker Road 51,650 Branan Field Chaffee Road 51,700 Oakleaf Village Parkway Old Middleburg Road S 43,750 10,300 7,400 Staples Mill Drive 18,600 17,350 10,300 8,600 Cheswick Oak Avenue 22,150 29,750 30,600 Westport Road 11,400 Park City Drive 35,650 34,850 56,250 41,700 43,350 28,500 11,650 Parramore Road 7,350 24,800 27,000 9,450 Youngerman Circle 24,150 Blanding Boulevard 39, , ,550 Wells Road ARGYLE TRAFFIC STUDY NERPM Model Volumes - No-Build Model 3 (Scenario 3B) Figure 12 34
41 North Florida Transportation Planning Organization 35 Table 19 - NERPM Model Volumes - Build Model (Scenario 4) NERPM Volume NERPM Volume (rounded) # Lanes in Both Direction Roadway Segment Segment Length Vehicle S. No AADT 2035 AADT (Miles) () 1 Branan Field Chaffee Road to Old Middleburg Road S 44,383 44, F 2 Old Middleburg Road to Staples Mill Drive 10,237 10, C 3 Staples Mill Drive to 16,249 16, C 4 to Cheswick Oak Avenue 14,698 14, C 1 5 Cheswick Oak Avenue to Westport Road 30,790 30, E 6 Westport Road to 36,256 36, F 7 to Youngerman Circle 31,413 31, E 8 Youngerman Circle to Well Road Extension 45,427 45, F 9 Wells Road Extension to Blanding Boulevard 13,584 13, C 1 Branan Field Chaffee Road to Old Middleburg Road S 19,371 19, F 2 Old Middleburg Road S to 11,203 11, D 3 to Westport Road 31,918 31, F 2 4 Westport Road to 37,831 37, F 5 to Parramore Road 42,705 42, F 6 Parramore Road to I-295 SB-EB Ramps 61,037 61, F 7 I-295 SB-EB Ramps to I-295 NB-WB Ramps 45,373 45, F 8 I-295 NB-WB Ramps to Blanding Boulevard 26,811 26, D 1 Wells Road to 100, , F 2 to Youngerman Circle 118, , F 3 Youngerman Circle to I-295 SB-EB Ramps 106, , F 3 Blanding Boulevard 4 I-295 SB-EB Ramps to I-295 NB-WB Ramps 86,464 86, F 5 I-295 NB-WB Ramps to Lake Gray Boulevard 64,487 64, D 6 Lake Gary Boulevard to Hicks Road 42,067 42, D 7 Hicks Road to 42,348 42, D 4 Wells Road Extension 1 Wells Road to 52,675 52, F 5 Youngerman Circle 1 to Youngerman Court 14,793 14, F 2 Youngerman Court to Blanding Boulevard 5,106 5, C 6 Parramore Road 1 to Youngerman Circle 17,679 17, F 7 1 to 28,796 28, D 8 Westport Road 1 to 12,010 12, D 9 Cheswick Oak Avenue 1 Staples Mill Drive to 21,218 21, F 10 1 to 16,946 16, F 11 Staples Mill Drive 1 to Cheswick Oak Avenue 7,212 7, C 12 Old Middleburg Road S 1 to 35,132 35, F 13 Branan Field Chaffee Road 1 to 65,466 65, F Roadway S.No. Note: New Roadway Link
42 Legend Major Roadways Proposed Improvements ,000 1,500 Feet Ricker Road Branan Field Chaffee Road 19,350 65,450 44,400 Oakleaf Village Parkway Old Middleburg Road S 35,150 10,250 11,200 Staples Mill Drive 16,950 16,250 14,700 7,200 Cheswick Oak Avenue 21,200 31,900 30,800 Westport Road 12,000 37,850 Park City Drive 36,250 61,050 42,700 28,800 Parramore Road 31,400 Argyle Forest Boulevard 45,350 17,700 14,800 45,450 26,800 5,100 Youngerman Circle 13,600 52,700 Blanding Boulevard 42, , ,850 Wells Road ARGYLE TRAFFIC STUDY NERPM Model Volumes - Build Model (Scenario 4) Figure 13 36
43 North Florida Transportation Planning Organization 37 The NERPM model performed reasonably when compared to the traffic counts (variation less than 25 percent) for the local roadway network in the study area. The NERPM model is over estimating the demand for north-south travel on Blanding Boulevard when compared to traffic counts. For example, the segment of Blanding Boulevard between Wells Road and the model estimates 112,400 vehicles per day from the model versus 86,860 vehicles per day for the count by FDOT at the same location. However, since this study will focus primarily on the change that occurs as a result of other improvements to traffic on Blanding Boulevard, the model was deemed acceptable for use in this study. Figure 14 thru 16 shows the variation in traffic volumes between various Scenarios considered for this project. In addition to comparing the volume shifts that occur with each model scenario, the system measures of effectiveness were also compared as summarized in Table 20. Table 20. Comparison of 2035 Model Scenarios 2035 Scenario Description Total VMT Total VHT Average Speed (MPH) Scenario 2 No-Build Model 1 63,321,924 2,807, Scenario 3A No-Build Model 2 68,526,872 2,310, Scenario 3B No-Build Model 3 68,595,464 2,315, Scenario 4 Build Model 68,547,400 2,301, When comparing the No Build scenarios with and without Parramore Road (3B and 3A), the benefits of building Parramore Road are realized through a reduction in the amount of travel in the network, savings in the total travel time and an improvement in the average speed of travel in the network. When comparing the No Build scenario 2 with the No Build scenario 3B that includes committed improvements to the network, the total amount of travel in the network increases with increased mobility from the improvements and the amount of delay in the network declines, but the average speed increases. When comparing the Build Scenario that includes construction of the Wells Road and Collins Road extension with the No Build scenario 2, these improvements are justified in terms of savings in the amount of travel, reduction in the amount of travel time, and an improvement in the average speed of travel in the network.
44 Legend Major Roadways Proposed Improvements Volume Difference Range >-20, ,000 1,500 Feet -20,000 to -10,000 Ricker Road -10,000 to -5,000-5,000 to -3,000-3,000 to -1,500-1,500 to 0 0 to 1,500 1,500 to 3,000 3,000 to 5,000 5,000 to 10,000 10,000 to 20,000 >20,000 Decrease in Volume Increase in Volume Branan Field Chaffee Road Oakleaf Village Parkway Old Middleburg Road S Staples Mill Drive Cheswick Oak Avenue Westport Road Park City Drive Parramore Road Youngerman Circle Blanding Boulevard Wells Road ARGYLE TRAFFIC STUDY NERPM Model Volumes - Shift in Traffic Between the No-Build Model 1 and No-Build Model 3 (With and Without I-295/ Interchange) Figure 14 38
45 Legend Major Roadways Proposed Improvements Volume Difference Range >-20, ,000 1,500 Feet -20,000 to -10,000 Ricker Road -10,000 to -5,000-5,000 to -3,000-3,000 to -1,500-1,500 to 0 0 to 1,500 1,500 to 3,000 3,000 to 5,000 5,000 to 10,000 10,000 to 20,000 >20,000 Decrease in Volume Increase in Volume Branan Field Chaffee Road Oakleaf Village Parkway Old Middleburg Road S Staples Mill Drive Cheswick Oak Avenue Westport Road Park City Drive Youngerman Circle Blanding Boulevard Wells Road ARGYLE TRAFFIC STUDY NERPM Model Volumes - Shift in Traffic Between the No-Build Model 2 & No-Build Model 3 (With and Without Parramore Road) Figure 15 39

46 Legend Major Roadways Proposed Improvements Volume Difference Range >-20, ,000 1,500 Feet -20,000 to -10,000 Ricker Road -10,000 to -5,000-5,000 to -3,000-3,000 to -1,500-1,500 to 0 0 to 1,500 1,500 to 3,000 3,000 to 5,000 5,000 to 10,000 10,000 to 20,000 >20,000 Decrease in Volume Increase in Volume Branan Field Chaffee Road Oakleaf Village Parkway Old Middleburg Road S Staples Mill Drive Cheswick Oak Avenue Westport Road Park City Drive Parramore Road Argyle Forest Boulevard Youngerman Circle Blanding Boulevard Wells Road ARGYLE TRAFFIC STUDY NERPM Model Volumes - Shift in Traffic Between the Build Model & No-Build Model 3 (With and Without Wells Road & Branan Field Chaffee Interchange) Figure 16 40
47 North Florida Transportation Planning Organization Summary of Needs Through the analysis of the existing traffic operations and safety conditions for this project, the following needs and deficiencies were identified: Blanding Boulevard and are highly congested roadways with below the existing standard. Significant crash histories were also observed at key locations. Other connecting roadways are significantly impacted by the congestion on these roadways as a result of queue spillback that forms during congested periods such that the alone does not fully capture the operational deficiencies in the area. The pedestrian and bicycle QOS within the study area are deficient on several facilities. As part of providing a total mobility approach within this community, additional improvements to enhance multimodal transportation options should be considered. These improvements will also support the planned expansion of transit services within the area on Blanding Boulevard. Most of the major facilities within the study area experience crash rates above the statewide average for the facility type and area type. Factors that contribute to these deficiencies include poor operating conditions and significant queue spillback from one intersection location to the next. This congestion results in conditions that frustrate drivers who in response drive more aggressively than in other conditions. 8. New Capacity Alternatives When future conditions are analyzed with the proposed improvements to I-295 to construct a collector-distributor road and new interchange at are considered, significant shifts in traffic occur that provide some congestion relief to Blanding Boulevard and Argyle Forest Boulevard, but also create additional deficiencies above the projects currently planned or under consideration. The proposed improvements include: Widen between SR 23 (Branan Field/Chaffee) and Old Middleburg Road from four to six lanes Widen Old Middleburg Road between and from four to six lanes Widen from Cheswick Oaks Avenue to SR 21 (Blanding Blvd) from four to six lanes Widen Youngerman Circle from four to six lanes Extend from Old Middleburg Road to SR 23 as a four-lane facility Extend Wells Road from Blanding Boulevard to as a four-lane facility Table 21 summarizes the costs of the recommended capacity improvements for additional consideration and supporting information is provided in Appendix D. These improvements are shown on Figure 17. Figure 18 shows the total future network if these improvements and other planned improvements are implemented. The known environmental features that may are involved with each concept alternative are also shown on Figure 18.
48 North Florida Transportation Planning Organization 42 Table 21. Summary of Recommended Capacity Improvement Costs Argyle Forest Between SR 23 (Branan Field Chaffee Road) and Old Middleburg Road Construction $ 8,616, Engineering at 10% of Construction $ 861, CEI at 10% of Construction $ 861, Right of Way $ 1,723, Total Project Costs: $ 12,062, Old Middleburg Road between and Construction $ 4,639, Engineering at 10% of Construction $ 463, CEI at 10% of Construction $ 463, Right of Way $ 927, Total Project Costs: $ 6,495, Argyle Forest from Cheswick Oaks Avenue to SR 21 (Blanding Blvd) Construction $ 33,316, Engineering at 10% of Construction $ 3,331, CEI at 10% of Construction $ 3,331, Right of Way $ 6,663, Total Project Costs: $ 46,642, Wells Road Extension Construction $ 21,101, Engineering at 10% of Construction $ 2,110, CEI at 10% of Construction $ 2,110, Right of Way $ 11,518, Total Project Costs: $ 36,839, Youngerman Circle Construction $ 2,938, Engineering at 10% of Construction $ 293, CEI at 10% of Construction $ 293, Right of Way $ 587, Total Project Costs: $ 4,113, extension from Old Middleburg Road to SR 23 (Branan Field Chaffee Road) Construction $ 11,825, Engineering at 10% of Construction $ 1,182, CEI at 10% of Construction $ 1,182, Right of Way $ 4,730, Total Project Costs: $ 18,921, Interchange at Extension with SR 23 (Branan Field Chaffee Road) Construction $ 32,477, Engineering at 10% of Construction $ 3,247, CEI at 10% of Construction $ 3,247, Right of Way $ 3,247, Total Project Costs: $ 45,468, The total estimated cost of these improvements is $170.6 million.
49
50


51 Legend Proposed Improvements Major Roadways Archeaeological Features ") Historical structures Brown Fields # Contamination Sites A -Special flood hazard area inundated by 100-year flood AE-Special flood hazard area inundated by 100-year flood Wetlands ,000 1,500 Feet Ricker Road Branan Field Chaffee Road Oakleaf Village Parkway Old Middleburg Road S Staples Mill Drive Cheswick Oak Avenue Westport Road Park City Drive Parramore Road Argyle Forest Boulevard Youngerman Circle Blanding Boulevard Wells Road ARGYLE TRAFFIC STUDY Environmental Features Screening Map Figure 19 45
ARGYLE TRAFFIC STUDY Summary of Recommendations
 ARGYLE TRAFFIC STUDY Summary of Recommendations 2011 Westport Road Ricker Road Blanding Boulevard Youngerm an Circle Argyle Forest Boulevard Co ARGYLE FOREST IS A HIGHLY CONGESTED AREA IN SOUTHWESTERN
Waterford Lakes Small Area Study
 Waterford Lakes Small Area Study Existing Traffic Conditions PREPARED FOR: ORANGE COUNTY PUBLIC WORKS DEPARTMENT TRAFFIC ENGINEERING DIVISION ORLANDO, FLORIDA PREPARED WITH: INWOOD CONSULTING ENGINEERS
APPENDIX G: INTERSECTION NEEDS AT OKEECHOBEE BOULEVARD
 APPENDIX G: INTERSECTION NEEDS AT OKEECHOBEE BOULEVARD INTERSECTION NEEDS AT SR 7 and OKEECHOBEE BOULEVARD SR 7 Extension Project Development and Environment (PD&E) Study From Okeechobee Boulevard (SR
The current document is revised based on the comments received on:
 General Overview 1 Introduction Over the last several years, the Waterford Lakes area has experienced increased congestion due to a substantial increase in residential and commercial development. The current
FINAL DESIGN TRAFFIC TECHNICAL MEMORANDUM
 FINAL DESIGN TRAFFIC TECHNICAL MEMORANDUM July 2014 FINAL (SR 43) Project Development and Environment Study From State Road 60 (Adamo Drive) to I-4 (SR 400) Hillsborough County, Florida Work Program Item
Waterford Lakes Small Area Study
 Over the last several years, the Waterford Lakes area has experienced increased congestion due to a substantial increase in residential and commercial development. The current Existing and Future Conditions
Walmart (Store # ) 60 th Street North and Marion Road Sioux Falls, South Dakota
 60 th Street North and Marion Road Sioux Falls, South Dakota") Walmart (Store #4865-00) 60 th Street North and Marion Road Sioux Falls, South Dakota Prepared for: Wal-Mart Stores, Inc. Bentonville, Arkansas Prepared by: Kimley-Horn and Associates, Inc. ã2013 Kimley-Horn
Walmart (Store #4865-00) 60 th Street North and Marion Road Sioux Falls, South Dakota Prepared for: Wal-Mart Stores, Inc. Bentonville, Arkansas Prepared by: Kimley-Horn and Associates, Inc. ã2013 Kimley-Horn
Chapter 4 Traffic Analysis
 Chapter 4 Traffic Analysis PURPOSE The traffic analysis component of the K-68 Corridor Management Plan incorporates information on the existing transportation network, such as traffic volumes and intersection
Harrah s Station Square Casino
 Transportation Analysis Harrah s Station Square Casino Pittsburgh, Pennsylvania Submitted To: City of Pittsburgh and Pennsylvania Gaming Control Board Prepared By: DKS Associates GAI Consultants December
5858 N COLLEGE, LLC N College Avenue Traffic Impact Study
 5858 N COLLEGE, LLC nue Traffic Impact Study August 22, 2016 Contents Traffic Impact Study Page Preparer Qualifications... 1 Introduction... 2 Existing Roadway Conditions... 5 Existing Traffic Conditions...
TRAFFIC OPERATIONS ANALYSIS REPORT. Pacheco Boulevard Alignment Study and Alternatives Analysis
 TRAFFIC OPERATIONS ANALYSIS REPORT Pacheco Boulevard Alignment Study and Alternatives Analysis PREPARED FOR: CITY OF MARTINEZ AND CONTRA COSTA COUNTY OCTOBER 2016 FINAL REPORT Prepared By: under contract
INDUSTRIAL BUILDING 3009 HAWTHORNE ROAD CITY OF OTTAWA TRANSPORTATION OVERVIEW REVISED. Prepared for: Canada Inc.
 INDUSTRIAL BUILDING 3009 HAWTHORNE ROAD CITY OF OTTAWA TRANSPORTATION OVERVIEW REVISED Prepared for: 7849648 Canada Inc. Octiober 1, 2015 114-598 Overview_2.doc D. J. Halpenny & Associates Ltd. Consulting
TRAFFIC IMPACT ANALYSIS
 TRAFFIC IMPACT ANALYSIS FOR THE CHAMPAIGN UNIT#4 SCHOOL DISTRICT PROPOSED HIGH SCHOOL (SPALDING PARK SITE) IN THE CITY OF CHAMPAIGN Final Report Champaign Urbana Urbanized Area Transportation Study 6/24/2014
Design Traffic Technical Memorandum
 State Road 7 Extension PD&E Study Design Traffic Technical Memorandum Palm Beach County, FL October 2010 State Road 7 Extension PD&E Study Design Traffic Technical Memorandum Palm Beach County, FL Prepared
TRANSPORTATION ANALYSIS REPORT US Route 6 Huron, Erie County, Ohio
 TRANSPORTATION ANALYSIS REPORT US Route 6 Huron, Erie County, Ohio December 12, 2012 Prepared for: The City of Huron 417 Main Huron, OH 44839 Providing Practical Experience Technical Excellence and Client
Subject: Solberg Avenue / I-229 Grade Separation: Traffic Analysis
 MEMORANDUM Transportation Bill Troe, AICP Jason Carbee, AICP 12120 Shamrock Plaza Suite 300 Omaha, NE 68154 (402) 334-8181 (402) 334-1984 (Fax) To: Project File Date: Subject: Solberg Avenue / I-229 Grade
Highway 49, Highway 351 and Highway 91 Improvements Feasibility Study Craighead County
 Highway 49, Highway 351 and Highway 91 Improvements Feasibility Study Craighead County Executive Summary March 2015 Highway 49, Highway 351 and Highway 91 Improvements Feasibility Study Craighead County
OFFICE/RETAIL DEVELOPMENT 1625 BANK STREET OTTAWA, ONTARIO TRANSPORTATION BRIEF. Prepared for: Canada Inc.
 OFFICE/RETAIL DEVELOPMENT 1625 BANK STREET OTTAWA, ONTARIO TRANSPORTATION BRIEF Prepared for: 9402209 Canada Inc. December 15, 2015 115-625 Report_2.doc D. J. Halpenny & Associates Ltd. Consulting Transportation
FRONT RANGE CROSSINGS TRAFFIC IMPACT STUDY
 FRONT RANGE CROSSINGS TRAFFIC IMPACT STUDY Prepared for: City of Thornton And Colorado Department of Transportation Prepared by: 11 Blake Street, Suite 2 Denver, Colorado 822 Contact: Brian Bern, PE, PTOE
NO BUILD TRAFFIC OPERATIONS
 3. 23 NO BUILD TRAFFIC OPERATIONS This section addresses the operations of the transportation system and details how it would be expected to function under year 23 No Build conditions with the projected
Abrams Associates. Transportation Impact Analysis. City of Rocklin. Prepared for: David Mohlenbrok City of Rocklin 4081 Alvis Court Rocklin, CA 95677
 Transportation Impact Analysis Sierra College Boulevard Commercial Project City of Rocklin Prepared for: David Mohlenbrok City of Rocklin 081 Alvis Court Rocklin, CA 95677 Prepared by: 1875 Olympic Boulevard,
PRELIMINARY DRAFT WADDLE ROAD / I-99 INTERCHANGE PROJECT ALTERNATIVE ANALYSIS FINAL TRAFFIC SUMMARY REPORT
 PRELIMINARY DRAFT WADDLE ROAD / I-99 INTERCHANGE PROJECT ALTERNATIVE ANALYSIS FINAL TRAFFIC SUMMARY REPORT Prepared by: In Association with: November 2013 EXECUTIVE SUMMARY Patton Township, in partnership
TABLE OF CONTENTS TABLE OF CONTENTS... I APPENDICES... III LIST OF EXHIBITS... V LIST OF TABLES... VII LIST OF ABBREVIATED TERMS...
 TABLE OF CONTENTS TABLE OF CONTENTS... I APPENDICES... III LIST OF EXHIBITS... V LIST OF TABLES... VII LIST OF ABBREVIATED TERMS... IX 1 INTRODUCTION... 1 1.1 Project Overview... 1 1.2 Analysis Scenarios...
DUNBOW ROAD FUNCTIONAL PLANNING
 DUNBOW ROAD FUNCTIONAL PLANNING Final Report August 3, 216 #31, 316 5th Avenue NE Calgary, AB T2A 6K4 Phone: 43.273.91 Fax: 43.273.344 wattconsultinggroup.com Dunbow Road Functional Planning Final Report
Highway 111 Corridor Study
 Highway 111 Corridor Study June, 2009 LINCOLN CO. HWY 111 CORRIDOR STUDY Draft Study Tea, South Dakota Prepared for City of Tea Sioux Falls Metropolitan Planning Organization Prepared by HDR Engineering,
MEDICAL/OFFICE BUILDING 1637 BANK STREET OTTAWA, ONTARIO TRANSPORTATION OVERVIEW. Prepared for:
 MEDICAL/OFFICE BUILDING 1637 BANK STREET OTTAWA, ONTARIO TRANSPORTATION OVERVIEW Prepared for: 2434984 Ontario Inc. 13-5510 Canotek Road Ottawa, Ontario K1J 9J5 June 4, 2015 115-613 Report_2.doc D. J.
City of Wayzata Comprehensive Plan 2030 Transportation Chapter: Appendix A
 A1. Functional Classification Table A-1 illustrates the Metropolitan Council s detailed criteria established for the functional classification of roadways within the Twin Cities Metropolitan Area. Table
Date: April 7, 2015 To: Chris Hartzell, PE Dakota County, MN From: Jacob Bongard, PE Bolton & Menk, Inc. Subject: Traffic Considerations Memorandum
 M E M O R A N D U M Date: April 7, 2015 To: Chris Hartzell, PE Dakota County, MN From: Jacob Bongard, PE Bolton & Menk, Inc. Subject: Traffic Considerations Memorandum I. Introduction The objective of
Project Report. South Kirkwood Road Traffic Study. Meadows Place, TX October 9, 2015
 Meadows Place, TX October 9, 2015 Contents 1 Introduction... 1 2 Data Collection... 1 3 Existing Roadway Network... 2 4 Traffic Volume Development... 2 5 Warrant Analysis... 3 6 Traffic Control Alternative
APPENDIXB. Traffic Operations Technical Memorandum
 APPENDIXB Traffic Operations Technical Memorandum Environmental Assessment - Lincoln County, SD 85 th Street: Sundowner Avenue to Louise Avenue November 2017 MEMORANDUM Transportation Jim Kollbaum, PE
OTTAWA TRAIN YARDS PHASE 3 DEVELOPMENT CITY OF OTTAWA TRANSPORTATION IMPACT STUDY. Prepared for:
 OTTAWA TRAIN YARDS PHASE 3 DEVELOPMENT CITY OF OTTAWA TRANSPORTATION IMPACT STUDY Prepared for: The Ottawa Train Yards Inc. 223 Colonnade Road South, Suite 212 Nepean, Ontario K2E 7K3 January 17, 2012
TABLE TRAFFIC ANALYSIS SCENARIOS
 4.11 TRANSPORTATION The potential traffic impacts of the proposed project are evaluated in the Buena Park Beach/Orangethorpe Mixed Use Project Traffic Analysis (Traffic Analysis) by Austin-Foust Associates
HILTON GARDEN INN HOTEL HOTEL EXPANSION 2400 ALERT ROAD, OTTAWA TRANSPORTATION BRIEF. Prepared for:
 HILTON GARDEN INN HOTEL HOTEL EXPANSION 2400 ALERT ROAD, OTTAWA TRANSPORTATION BRIEF Prepared for: Bona Building & Management Co. Ltd. Place Vanier, 333 North River Road Vanier, Ontario K1L 8B9 October
Traffic Impact Study WestBranch Residential Development Davidson, NC March 2016
 Traffic Impact Study WestBranch Residential Development Davidson, NC March 216 TRAFFIC IMPACT STUDY FOR THE WestBranch Residential Development LOCATED IN DAVIDSON, NC Prepared For: Lennar Carolinas, LLC
Traffic Impact Analysis Chatham County Grocery Chatham County, NC
 Chatham County Grocery Chatham County, NC TABLE OF CONTENTS 1. INTRODUCTION... 1 1.1. Location and Study Area... 1 1.2. Proposed Land Use and Access... 2 1.3. Adjacent Land Uses... 2 1.4. Existing ways...
7.0 FREEWAYS CONGESTION HOT SPOT PROBLEM & IMPROVEMENT PROJECT ANALYSIS & DEFINITION
 7.0 FREEWAYS CONGESTION HOT SPOT PROBLEM & IMPROVEMENT PROJECT ANALYSIS & DEFINITION 7.1 INTRODUCTION & METHODOLOGY FEASIBILITY REPORT Congestion hot spot problem locations have been assessed using the
Appendix C. NORTH METRO STATION AREA TRAFFIC IMPACT STATEMENT 88th Avenue Station
 Appendix C NORTH METRO STATION AREA TRAFFIC IMPACT STATEMENT 88th Avenue Station Prepared for: Regional Transportation Department and URS Corporation as part of the North Metro EIS David Evans and Associates,
List of Exhibits...ii
 One Brickell Traffic Study TABLE OF CONTENTS List of Exhibits...ii EXECUTIVE SUMMARY...1 1. INTRODUCTION...2 1.1 Study Area...2 1.2 Study Objective...5 2. EXISTING TRAFFIC CONDITIONS...6 2.1 Data Collection...6
Northwest Corridor Project Interchange Modification, Interchange Justification and System Analysis Report Reassessment (Phase I)
") Northwest Corridor Project Interchange Modification, Interchange Justification and System Analysis Report Reassessment (Phase I) Introduction The Georgia Department of Transportation (GDOT) prepared a
Northwest Corridor Project Interchange Modification, Interchange Justification and System Analysis Report Reassessment (Phase I) Introduction The Georgia Department of Transportation (GDOT) prepared a
Regional Strategic Safety Plan PLANNING TO SAVE LIVES, TIME AND MONEY.
 2012 PLANNING TO SAVE LIVES, TIME AND MONEY. 2012 HUNDREDS OF NORTH FLORIDA RESIDENTS DIE IN TRAFFIC CRASHES ANNUALLY AND MORE PEOPLE DIE FROM TRAFFIC CRASHES THAN HOMICIDES. PLANNING TO SAVE LIVES, TIME
Existing Conditions. Date: April 16 th, Dan Holderness; Coralville City Engineer Scott Larson; Coralville Assistant City Engineer
 Date: April 16 th, 2015 To: From: Re: Dan Holderness; Coralville City Engineer Scott Larson; Coralville Assistant City Engineer Darian Nagle-Gamm, Traffic Engineering Planner Highway 6 (2 nd Street) /
Traffic Impact Analysis Walton Acres at Riverwood Athletic Club Clayton, NC
 Traffic Impact Analysis Walton Acres at Riverwood Athletic Club Clayton, NC 1. TABLE OF CONTENTS INTRODUCTION...1 1.1. Site Location and Study Area...1 1.2. Proposed Land Use and Site Access...2 1.3.
Glenn Avenue Corridor Traffic Operational Evaluation
 Glenn Avenue Corridor Traffic Operational Evaluation PREPARED FOR: THE CITY OF AUBURN PREPARED BY: DECEMBER 2007 Glenn Avenue Corridor Study--Auburn, Alabama TABLE OF CONTENTS Introduction... 1 Background
Evaluation of M-99 (Broad Street) Road Diet and Intersection Operational Investigation
 Road Diet and Intersection Operational Investigation") Evaluation of M-99 (Broad Street) Road Diet and Intersection Operational Investigation City of Hillsdale, Hillsdale County, Michigan June 16, 2016 Final Report Prepared for City of Hillsdale 97 North Broad
Evaluation of M-99 (Broad Street) Road Diet and Intersection Operational Investigation City of Hillsdale, Hillsdale County, Michigan June 16, 2016 Final Report Prepared for City of Hillsdale 97 North Broad
Traffic Impact Study. Westlake Elementary School Westlake, Ohio. TMS Engineers, Inc. June 5, 2017
 TMS Engineers, Inc. Traffic Impact Study Westlake Elementary School Westlake, Ohio June 5, 2017 Prepared for: Westlake City Schools - Board of Education 27200 Hilliard Boulevard Westlake, OH 44145 TRAFFIC
Dr. M.L. King, Jr. Street North Complete Streets Resurfacing Opportunities HOUSING, LAND USE, AND TRANSPORTATION COMMITTEE MARCH 22, 2018
 Dr. M.L. King, Jr. Street North Complete Streets Resurfacing Opportunities HOUSING, LAND USE, AND TRANSPORTATION COMMITTEE MARCH 22, 2018 What s Happening The City plans to mill and resurface Dr. M.L.
INDUSTRIAL BUILDING 1660 COMSTOCK ROAD CITY OF OTTAWA TRANSPORTATION OVERVIEW. Prepared for:
 INDUSTRIAL BUILDING 1660 COMSTOCK ROAD CITY OF OTTAWA TRANSPORTATION OVERVIEW Prepared for: Simluc Contractors Limited 2550 Blackwell Street, Ottawa K1B 5R1 October 18, 2013 113-584 Overview_1.doc D. J.
JONESBORO HIGHWAY 63 HIGHWAY 18 CONNECTOR STUDY
 JONESBORO HIGHWAY 63 HIGHWAY 18 CONNECTOR STUDY Craighead County May 2007 JONESBORO HIGHWAY 63 HIGHWAY 18 CONNECTOR STUDY Craighead County May 2007 Prepared by Planning and Research Division Arkansas State
US 41 COMPLETE STREETS CORRIDOR PLANNING STUDY from University Parkway to Whitfield Avenue
 41 US 41 COMPLETE STREETS CORRIDOR PLANNING STUDY from University Parkway to Whitfield Avenue EXECUTIVE SUMMARY DRAFT FEBRUARY 2019 Project Overview The US 41 Complete Streets Corridor Planning Study,
Proposed Action, Purpose and Need Technical Memorandum
 Proposed Action, Purpose and Need Technical Memorandum MoPac (State Loop 1) Intersections, Austin District From North of Slaughter Lane to South of La Crosse Avenue CSJ: 3136-01-015 Travis County, Texas
City of Gainesville Transportation/Roadway Needs PROJECT SUMMARY
 A1 Roadway Resurfacing $23,846,000 TYPE: Preservation of existing system Roadway resurfacing A2 Signal Replacement $6,000,000 TYPE: Preservation of existing system Replace traffic signals. B1 W 6th St
Traffic Analysis and Design Report. NW Bethany Boulevard. NW Bronson Road to NW West Union Road. Washington County, Oregon
 Traffic Analysis and Design Report NW Bethany Boulevard NW Bronson Road to NW West Union Road Washington County, Oregon May 2011 Table of Contents Table of Contents Section 1 Executive Summary... 2 Section
Operational Comparison of Transit Signal Priority Strategies
 Operational Comparison of Transit Signal Priority Strategies Revision Submitted on: November, 0 Author: Adriana Rodriguez, E.I Assistant Engineer Parsons Brinckerhoff 0 South Orange Avenue, Suite 00 Orlando,
METHODOLOGY. Signalized Intersection Average Control Delay (sec/veh)
") Chapter 5 Traffic Analysis 5.1 SUMMARY US /West 6 th Street assumes a unique role in the Lawrence Douglas County transportation system. This principal arterial street currently conveys commuter traffic
Chapter 5 Traffic Analysis 5.1 SUMMARY US /West 6 th Street assumes a unique role in the Lawrence Douglas County transportation system. This principal arterial street currently conveys commuter traffic
EXECUTIVE SUMMARY. Page 1 of 6
 EXECUTIVE SUMMARY The purpose of this report is to identify conformance with the original traffic impact study for the proposed retail development on Lot 5 of Riverdale Retail Filing No. 1 located on the
Intersection Traffic Control Feasibility Study
 Intersection Traffic Control Feasibility Study CSAH 9 at CSAH 60 (185th Avenue) Prepared For: Dakota County Transportation Department Western Service Center 14955 Galaxie Avenue, 3rd Floor Apple Valley,
Route 7 Corridor Study
 Route 7 Corridor Study Executive Summary Study Area The following report analyzes a segment of the Virginia State Route 7 corridor. The corridor study area, spanning over 5 miles in length, is a multi
Public Information Meeting. Orange Camp Road. Dr. Martin Luther King Jr. Beltway to I-4. Presented by: Volusia County August 2, 2018
 Public Information Meeting Orange Camp Road Dr. Martin Luther King Jr. Beltway to I-4 Presented by: Volusia County August 2, 2018 1 Project Goals To improve the operations and safety for Orange Camp Road
DRAFT. Corridor study. Honeysuckle Road. October Prepared for the City of Dothan, AL. Prepared by Gresham, Smith and Partners
 DRAFT Corridor study Honeysuckle Road October 2017 Prepared for the City of Dothan, AL Prepared by TABLE OF CONTENTS SECTION I... 1 STUDY SUMMARY... 1 INTRODUCTION... 1 CONCLUSIONS... 5 SECTION II... 7
FAIRFIELD INN & SUITES HOTEL 135 THAD JOHNSON PRIVATE OTTAWA TRANSPORTATION BRIEF. Prepared for:
 FAIRFIELD INN & SUITES HOTEL 135 THAD JOHNSON PRIVATE OTTAWA TRANSPORTATION BRIEF Prepared for: Bona Building & Management Co. Ltd. Place Vanier, 333 North River Road Vanier, Ontario K1L 8B9 August 12,
Complete Street Analysis of a Road Diet: Orange Grove Boulevard, Pasadena, CA
 Complete Street Analysis of a Road Diet: Orange Grove Boulevard, Pasadena, CA Aaron Elias, Bill Cisco Abstract As part of evaluating the feasibility of a road diet on Orange Grove Boulevard in Pasadena,
4.12 TRANSPORTATION Executive Summary. Setting
 4.12 TRANSPORTATION 4.12.1 Executive Summary This section is based on the Multimodal Transportation Impact Study (TIS; 2016) prepared by Omni-Means, Ltd. to evaluate projected transportation impact conditions
MEETING FACILITY 2901 GIBFORD DRIVE CITY OF OTTAWA TRANSPORTATION BRIEF. Prepared for: Holiday Inn Express 2881 Gibford Drive Ottawa, ON K1V 2L9
 MEETING FACILITY 2901 GIBFORD DRIVE CITY OF OTTAWA TRANSPORTATION BRIEF Prepared for: Holiday Inn Express 2881 Gibford Drive Ottawa, ON K1V 2L9 December 18, 2012 112-566 Brief_1.doc D. J. Halpenny & Associates
FM #: ETDM #: 11241
 SR 826/Palmetto Expressway PD&E Study From SR 93/I 75 to the Golden Glades Interchange FM #: 418423 1 22 01 ETDM #: 11241 Agency/ Kick Off Meeting October 27, 2011 2 Location Map From SR 93/I 75 to Golden
Traffic Circulation Study for Neighborhood Southwest of Mockingbird Lane and Airline Road, Highland Park, Texas
 ARIZONA TEXAS NEW MEXICO OKLAHOMA February 13, 2015 Mr. Meran Dadgostar P.E., R.S. Town of Highland Park 4700 Drexel Dr. Highland Park, Texas 75205 Re: Traffic Circulation Study for Neighborhood Southwest
Appendix B: Forecasting and Traffic Operations Analysis Framework Document
 Existing Conditions Report - Appendix Appendix B: Forecasting and Traffic Operations Analysis Framework Document This document defines the methodology and assumptions that will be used in the traffic forecasting
Project Description Form 8EE
 Project Description Form 8EE Basic Project Information Submitting Jurisdiction/Agency: Town of Dumfries Project Title: Route 1 (Fraley Blvd) Widening: Brady's Hill Road to Dumfries Road Project Location:
Figure 1: East West Connector Alignment Alternatives Concept Drawing
 Page 2 of 9 Figure 1: East West Connector Alignment Alternatives Concept Drawing The Montebello Drive extension will run north south and connect Wilsonville Road to the Boones Ferry Road to Brown Road
State Road 54/56 Tampa Bay s Northern Loop. The Managed Lane Solution Linking I-75 to the Suncoast Parkway
 State Road 54/56 Tampa Bay s Northern Loop The Managed Lane Solution Linking I-75 to the Suncoast Parkway SUNCOAST PARKWAY Both I 75 and the Suncoast Parkway are planning, or in the process of constructing,
Meadow Woods Elementary School
 Drag and drop pic and stretch/crop to the limits of the blue rectangle (delete this text box) Meadow Woods Elementary School Drag and drop pic and stretch/crop to the limits of the blue rectangle (delete
3.0 PROJECT DESCRIPTION
 The following section of the Draft EIR contains a description of the proposed Elk Grove Boulevard/SR 99 Interchange Modification project, consistent with the requirements of CEQA Guidelines Section 15124.
4. ENVIRONMENTAL IMPACT ANALYSIS 9. TRANSPORTATION AND TRAFFIC
 4. ENVIRONMENTAL IMPACT ANALYSIS 9. TRANSPORTATION AND TRAFFIC 4.9.1 INTRODUCTION The following section addresses the Proposed Project s impact on transportation and traffic based on the Traffic Study
Lincoln Avenue Road Diet Trial
 Lincoln Avenue Road Diet Trial Data Collection Report June 1, 2015 Department of Transportation Table of Contents I. Introduction...... 3 II. Data Collection Methodology & Results...... 5 A. Traffic Volume
Figure 1: Vicinity Map of the Study Area
 ARIZONA TEXAS NEW MEXICO OKLAHOMA May 5, 2016 Mr. Anthony Beach, P.E. BSP Engineers 4800 Lakewood Drive, Suite 4 Waco, Texas 76710 Re: Intersection and Access Analysis along Business 190 in Copperas Cove
PART FIVE. Systems Management, Operations and Maintenance
 PART FIVE Systems Management, Operations and Maintenance Path Forward 4 Long Range Transportation Plan TRANSPORTATION SYSTEMS MANAGEMENT AND OPERATIONS TSM&O STRATEGIES INCREASE TRAVEL CHOICES AND EFFICIENCY
Donahue Drive Corridor Traffic Operational Evaluation
 Donahue Drive Corridor Traffic Operational Evaluation PREPARED FOR: THE CITY OF AUBURN PREPARED BY: JANUARY 2007 Donahue Drive Corridor Study--Auburn, Alabama TABLE OF CONTENTS Introduction... 1 Background
East 12 th Street Bikeway Feasibility Study
 Final Report East 12 th Street Bikeway Feasibility Study Prepared for: City of Oakland Public Works Agency Submitted by: 180 Grand Avenue, Suite 250 Oakland, CA 94612 Phone: (510) 839-1742; Fax: (510)
DRAFT TRAFFIC STUDY BOULDER AVENUE BRIDGE REPLACEMENT CITY OF HIGHLAND SAN BERNARDINO COUNTY, CALIFORNIA
 DRAFT CITY OF HIGHLAND SAN BERNARDINO COUNTY, CALIFORNIA August 8, 2006 DRAFT CITY OF HIGHLAND SAN BERNARDINO COUNTY, CALIFORNIA Prepared for: City of Highland 27215 Baseline Highland, California 92346
Bay to Bay Boulevard Complete Streets Project
 Bay to Bay Boulevard Complete Streets Project Dale Mabry Highway to Bayshore Boulevard February 08, 2018 Photo Source: Tampa Bay Times Alessandra Da Pra Meeting Format Introduction Resurfacing Information
3.2.2 Proposed Road Network within Phase 1B Lands
 3.2.2 Proposed Road Network within Phase 1B Lands Figure 3.1 also shows the proposed road network within the Premier Gateway Phase 1B Employment Area lands, which features two collector roads providing
Roundabout Feasibility Memorandum
 Roundabout Feasibility Memorandum To From Gwen Pipkin Bill Howell Date June 18, 2013 Subject Roundabout Feasibility Study SR 29 PD&E Study From Oil Well Road to SR 82 Collier County, FL FPID 417540-1-22-01
EAST AND SOUTH STREET CITY OF ANAHEIM, CALIFORNIA
 T R A F F I C I M P A C T A N A LY S I S EAST AND SOUTH STREET CITY OF ANAHEIM, CALIFORNIA April 217 T R A F F I C I M P A C T A N A LY S I S EAST AND SOUTH STREET CITY OF ANAHEIM, CALIFORNIA Submitted
URBAN QUARRY HEADQUARTERS 2717 STEVENAGE DRIVE CITY OF OTTAWA TRANSPORTATION OVERVIEW. Prepared for: Urban Quarry 4123 Belgreen Drive, Ottawa K1G 3N2
 URBAN QUARRY HEADQUARTERS 2717 STEVENAGE DRIVE CITY OF OTTAWA TRANSPORTATION OVERVIEW Prepared for: Urban Quarry 4123 Belgreen Drive, Ottawa K1G 3N2 February 27, 2014 113-584 Overview_1.doc D. J. Halpenny
Gateway Transportation Study
 Gateway Transportation Study Amherst, Massachusetts SUBMITTED TO University of Massachusetts Amherst Town of Amherst SUBMITTED BY Vanasse Hangen Brustlin, Inc. Watertown, Massachusetts March 213 Back of
ALLEY 24 TRAFFIC STUDY
 ALLEY 24 TRAFFIC STUDY in City of Frostburg, Maryland January 2013 3566 Teays Valley Road Hurricane, WV Office: (304) 397-5508 www.denniscorporation.com Alley 24 Traffic Study January 2013 Frostburg, Maryland
Henderson Avenue Mixed-Use Development
 Zoning Case: Z145-3 Traffic Impact Analysis Henderson Avenue Mixed-Use Development Dallas, TX October 26 th, 216 Kimley-Horn and Associates, Inc. Dallas, Texas Project #644827 Registered Firm F-928 Traffic
Shockoe Bottom Preliminary Traffic and Parking Analysis
 Shockoe Bottom Preliminary Traffic and Parking Analysis Richmond, Virginia August 14, 2013 Prepared For City of Richmond Department of Public Works Prepared By 1001 Boulders Pkwy Suite 300, Richmond, VA
5.3 TRAFFIC, CIRCULATION AND PARKING
 5.3 TRAFFIC, CIRCULATION AND PARKING This section is based upon the Downtown Lancaster Specific Plan Traffic Impact Analysis (April 2, 2008) and the Downtown Lancaster Specific Plan Parking Analysis (May
CITY OF OAKLAND. 27th Street Bikeway Feasibility and Design. Final Report (v3) March 23, Kimley-Horn and Associates, Inc.
 March 23, Kimley-Horn and Associates, Inc.") CITY OF OAKLAND 27th Street Bikeway Feasibility and Design Final Report (v3) March 23, 2007 PREPARED BY: Kimley-Horn and Associates, Inc. Table of Contents 1. Introduction 3 2. 27 th Street/Bay Place Corridor
CITY OF OAKLAND 27th Street Bikeway Feasibility and Design Final Report (v3) March 23, 2007 PREPARED BY: Kimley-Horn and Associates, Inc. Table of Contents 1. Introduction 3 2. 27 th Street/Bay Place Corridor
Grant Avenue Streetscape
 REPORT TYPE GOES HERE Grant Avenue Streetscape PREPARED FOR City of Manassas 9027 Center Street Manassas, VA 20110 PREPARED BY 8300 Boone Boulevard Suite 700 Vienna, Virginia 22182 571.389.8121 July 31,
Arterial Management Plan for US Route 250 and State Route 623
 Arterial Management Plan for US Route 250 and State Route 623 June 25, 2014 Brad Shelton, AICP Access Management and Traffic Impact Analysis Programs Manager Transportation and Mobility Planning Division
Traffic Study North Shore School District 112
 Traffic Study North Shore School District 112 Proposed Expansion of Northwood Junior High School Prepared By: May 1, 2015 1. Introduction Kenig, Lindgren, O Hara, Aboona, Inc. (KLOA, Inc.) has been retained
Low Level Road Improvements Traffic Analysis. Report
 Low Level Road Improvements Traffic Analysis Report June, 22 Table of Contents. INTRODUCTION.... LOW LEVEL ROAD PROJECT....2 STUDY AREA....2. West-End Corridor Improvements... 2.2.2 East-End Corridor Improvements...
Marina Loft (DRC 51-R-12)
") Marina Loft (DRC 51-R-12) traffic study prepared for: Cymbal Development OCtober 2012 Traf Tech October 1, 2012 Mr. Asi Cymbal - President Cymbal Development 3470 North Miami Avenue Upper Suite Miami,
Marina Loft (DRC 51-R-12) traffic study prepared for: Cymbal Development OCtober 2012 Traf Tech October 1, 2012 Mr. Asi Cymbal - President Cymbal Development 3470 North Miami Avenue Upper Suite Miami,
DRAFT Davidson Elementary School Expansion Transportation Impact Analysis
 DRAFT Davidson Elementary School Expansion Transportation Impact Analysis Prepared for: Town of Davidson 216 S. Main Street Davidson, NC 28036 Prepared by: Stantec Consulting Services Inc. 2127 Ayrsley
M-58 HIGHWAY ACCESS MANAGEMENT STUDY Mullen Road to Bel-Ray Boulevard. Prepared for CITY OF BELTON. May 2016
 M-58 HIGHWAY ACCESS MANAGEMENT STUDY Prepared for CITY OF BELTON By May 2016 Introduction Missouri State Highway 58 (M-58 Highway) is a major commercial corridor in the City of Belton. As development has
NEW YORK CENTRAL PARK SUBDIVISION BLAIS STREET/ST-PIERRE STREET EMBRUN, ONTARIO TRAFFIC IMPACT STUDY. Prepared for:
 NEW YORK CENTRAL PARK SUBDIVISION BLAIS STREET/ST-PIERRE STREET EMBRUN, ONTARIO TRAFFIC IMPACT STUDY Prepared for: Solidex Holdings Limited & Investissement Maurice Lemieux Investments Attn: Mr. Anthony
I-95 Northbound at US 1 (Exit 126) Design and Study Final Report
 Design and Study Final Report") I-95 Northbound at US 1 (Exit 126) Design and Study Final Report July 2018 Prepared by: Prepared for: TABLE OF CONTENTS 1 Introduction... 1 Study Area Limits... 1 Purpose and Need of the Study... 1 Safety
I-95 Northbound at US 1 (Exit 126) Design and Study Final Report July 2018 Prepared by: Prepared for: TABLE OF CONTENTS 1 Introduction... 1 Study Area Limits... 1 Purpose and Need of the Study... 1 Safety
Clackamas County Comprehensive Plan
 ROADWAYS The County s road system permits the movement of goods and people between communities and regions, using any of a variety of modes of travel. Roads provide access to virtually all property. They
VIVA RETIREMENT COMMUNITIES OAKVILLE TRAFFIC IMPACT STUDY
 VIVA RETIREMENT COMMUNITIES OAKVILLE TRAFFIC IMPACT STUDY VIVA RETIREMENT COMMUNITIES OAKVILLE TRAFFIC IMPACT STUDY DECEMBER 2012 READ, VOORHEES & ASSOCIATES TORONTO, ONTARIO Read, Voorhees & Associates