Erickson Living at Limestone Valley
|
|
|
- Bathsheba Gilbert
- 5 years ago
- Views:
Transcription
1 Erickson Living at Limestone Valley Howard County, Maryland July 28, 27 Adequate Road Facilities Test Evaluation and Traffic Study Prepared for: Erickson Living Steven Montgomery Vice President of Development Acquisitions 7 Maiden Choice Lane Baltimore, MD Steven.Montgomery@erickson.com
2 LIST OF FIGURES AND TABLES. INTRODUCTION and SUMMARY OF FINDINGS... Figure. Site Concept Plan... 6 Figure.2 Road Improvement Concept Plan EXISTING TRAFFIC CONDITIONS... 8 Figure 2. Study Area Map... Figure 2.2 Existing Lane Use... Figure 2.3 Existing Traffic Volumes... 3 Table 2. Summary of Existing CLV... 4 Table 2.2 Summary of Existing Delay (HCM in seconds)... 5 Table 2.3 Summary of Existing Queuing (in feet) BACKGROUND TRAFFIC CONDITIONS... 8 Figure Base Peak Hour Traffic Volumes... 2 Figure Base Peak Hour Traffic Volumes... 2 Figure 3.3 Background Development Map Table 3. Background Development Listing Figure 3.4 Combined Trips Generated by Background Developments Figure Background Peak Hour Traffic Volumes Figure Background Peak Hour Traffic Volumes Table 3.2 Summary of Background CLV Table 3.3 Summary of Background Delay (HCM in seconds) Table 3.4 Summary of Background Queuing (in feet) TOTAL TRAFFIC CONDITIONS... 3 Table 4. Trip Generation Rates... 3 Table 4.2 Trip Generation Totals Figure 4. Trip Distribution and Assignment Figure Total Peak Hour Traffic Volumes Figure Total Peak Hour Traffic Volumes Figure Adjustment to Total Peak Hour Traffic Volumes Figure Adjusted Total Peak Hour Traffic Volumes Table 4.3 Summary of Total CLV Analysis Table 4.4 Summary of Total Delay (HCM in seconds)... 4 Table 4.5 Summary of Total Queuing (in feet)... 4 Table 4.6 Future Recommended Lane Use RESULTS, RECOMMENDATIONS, AND CONCLUSIONS... 46
3 APPENDICES APPENDIX A- Concept Road Improvement Plan APPENDIX B -Intersection Turning Movement Counts and Aerial Photos APPENDIX C -Intersection Capacity Analysis Worksheets, CLV Worksheets APPENDIX D-Trip Assignment for Background Developments APPENDIX E -Synchro and Simtraffic APPENDIX F- Crash Data- MD SHA Professional Certification: I hereby certify that these documents were prepared or approved by me, and that I am a duly licensed professional engineer under the laws of the State of Maryland, License No. 2993, Expiration Date : /8/28. Prepared by: Carl R. Wilson, Jr., P.E., PTOE Fuhsiung Huang (Richard), P.E., PTOE CRW:rek (F:\2 7\27-32_Erickson_MO 8 Sit e\docs\reports\july 27\Adequate Road Facilities Test Eval and Traffic Study.docx) The Traffic Group, Inc. Traffic Engineers & Transportation Planners Merging Innovation and Excellence CORPORATE OFFICE 99 Franklin Square Drive, Suite H Baltimore, Maryland Fax: www. traffi cgroup.com
4 INTRODUCTION AND SUMMARY OF FINDINGS Study Purpose The Traffic Group, Inc. has prepared this Adequate Road Facilities Test Evaluation and Traffic Study to quantify the impact the proposed development of Erickson Living at Limestone Valley will have on the surrounding road network in Howard County, Maryland. The subject site is situated on the north side of MD 8 (Clarksville Pike), west of Sheppard Lane. A Continuing Care Retirement Community (CCRC) with up to 2 units is proposed. In addition, a 24 bed Assisted Living Facility (ALF) will also be constructed on-site. A Concept Plan for the development is shown below as Figure. and Appendix A. Access to the property is proposed via one point along MD 8 and a secondary point along an extension of Linden Linthicum Lane (Proposed Public Access Road). The MD 8 access will operate under stop control and left turns out of the facility will be restricted. The access point along Proposed Public Access Road will operate under stop control. Traffic signalization is proposed at the intersection of MD 8 and Linden Linthicum Lane/Proposed Public Access Road will. Full buildout of the project is expected within six years. Study Criteria/Methodology This study was conducted in accordance with Chapter 4 of the Howard County Design Manual Volume III (Road and Bridge Design). Chapter 4 details the requirements for the Adequate Road Facilities Test Evaluation, which require that the first intersection of a Major Collector or higher classified roadway with another Major Collector or higher classified roadway in all directions from the subject site be reviewed and analyzed. Since the site will generate more than trips, a Chapter 5 Traffic Study is also required, which subjects all classified intersections within one-half mile of the property to review, however, improvements are not required at these locations. All intersections ae reviewed using Critical Lane Volume (CLV) methodology. Intersections that are controlled by Maryland State Highway Administration (SHA) must exhibit Level of Service E or better conditions during all study periods. Because of the complexity of this project, a Synchro model was prepared for the MD 8 corridor.
5 In addition to traditional road improvements that may be required as part of the Adequate Road Facilities Test Evaluation, road improvements that will provide additional community benefit are proposed in conjunction with the CEF (Community Enhanced Floating) Zone requirement for this site. Details on the proposed improvements will be provided in later sections of this document. Scope of Services The principal scope of services undertaken for this study was as follows: Conduct a field inspection to collect physical information concerning the nearby road system, including a compilation of traffic signal plans, aerial photography and ground level photographs. Collect intersection turning movement counts during the morning and evening peak periods at each study intersection while public school is in session. Apply a regional growth factor to the road network to incorporate the design year. Prepare trip generation and trip distribution forecasts for all approved background developments. Prepare trip generation and trip distribution for the development of the subject site. Undertake intersection capacity analysis to determine existing and projected levels of service at all study intersections using Critical Lane Volume (CLV) methodology. Prepare a Synchro model and SimTraffic simulation to detail existing and projected future operations. Provide an overall evaluation of traffic operations, including recommendations for improvements at appropriate concept plans. 2
6 Summary of Findings and Recommendations This analysis will show that the Adequate Road Test Facilities study intersections are currently operating with an acceptable CLV under existing conditions. When considering the impact of background traffic, the intersection of MD 8 at Sheppard Lane is projected to operate at Level of Service F conditions during both the morning and evening peak periods. All other remaining Chapter 5 intersections will feature acceptable operations. With the additional impact associated with the development of the subject site, the intersection of MD 8 at Sheppard Lane will continue to exhibit Level of Service F conditions. Since this project is seeking CEF Zoning, additional road improvements are proposed above and beyond what would typically be required to satisfy Adequate Road Facilities Test Evaluation requirements. Below, the proposed improvements are detailed: MD 8 at Sheppard Lane Sheppard Lane currently intersects MD 8 at a 55 degree angle, which is substandard and has a negative impact on intersection operations. In addition, the Sheppard Lane approach features just a single lane for traffic accessing MD 8. Finally, the existing left turn lane from eastbound MD 8 to Sheppard Lane is only 75 feet long which results in significant queuing that blocks the through lane. The following improvements are proposed at this location: Realign Sheppard Lane to the west at an angle of a minimum of 7 degrees as acceptable to SHA. Widen the Sheppard Lane approach to provide two lanes onto MD 8, including a separate right turn lane and separate left turn lane. Provide a continuous left turn lane along eastbound MD 8, approaching Sheppard Lane. Widen the westbound MD 8 approach to provide two thru lanes and a separate right lane. Reconstruct the traffic signal and provide pedestrian accommodations as required by SHA. Provide interconnection of the traffic signal along MD 8 to MD 32. 3
7 Not only do the proposed improvements at MD 8 at Sheppard Lane improve the CLV to an acceptable level, but queuing is significantly reduced on all approaches. The queuing is an operations issue that is present under existing conditions. The reduction of queues would provide significant benefits to all roadway users. MD 8 at Linden Linthicum Lane/Proposed Public Access Road The existing intersection of MD 8 and Linden Linthicum Lane features stop control for the minor approach. As a result, significant delays are encountered during the peak period for left turning traffic. The following improvements are recommended to mitigate delays and improve operations at this intersection: Install traffic signalization once approved by SHA. Provide an extension of Linden Linthicum Lane (Proposed Public Access Road) on the north side of MD 8 to provide site access and potential future connections to commercial properties to the west. Convert the existing right turn lane along eastbound MD 8 to a shared thru/right lane. Convert the westbound MD 8 auxiliary lane to a shared thru/right lane. The construction of these improvements, including the Proposed Public Access Road on the north side of MD 8, will provide a significant community benefit. The new road will allow property owners on its west side to potentially have signalized access to MD 8. While the elimination of unsignalized access points is not recommended, drivers will have a choice to utilize signalized access to the MD 8 corridor, particularly during peak periods. In addition, the installation of the traffic signal at Linden Linthicum Lane is consistent with elements of the Clarksville Pike Streetscape Plan which was adopted by Howard County in 26. The implementation of the signal will allow for synchronized traffic signals between Sheppard Lane and MD 32, which will significantly enhance operations providing a community benefit. MD 8 at Site Access A limited access point is proposed along MD 8, opposite the existing access point for River Hill Garden Center which is approximately 475 feet west of Sheppard Lane. At this access point, which will operate under stop control, a left-in/right-in/right-out is proposed. A separate left turn lane will be provided into the site. The following enhancements are also proposed in conjunction with the access point: 4
8 Construct a five lane section along MD 8 in between Linden Linthicum Lane and Sheppard Lane, covering a distance of approximately,3 feet. Provide separate acceleration and deceleration lanes into the subject site, based on SHA requirements. Provide appropriate channelization to restrict left turns out of the subject site. The construction of the five lane section along MD 8 is consistent with the Clarksville Pike Streetscape Plan and will match the section of MD 8 to the west of Linden Linthicum Lane. This construction will provide a significant benefit to roadway users, as queuing for Sheppard Lane will no longer block thru traffic along MD 8. A preliminary Concept Plan showing the proposed road improvements can be found in Figure.2. A full size version of the plan is included in Appendix A. As previously stated, the improvements proposed in conjunction with the development of Erickson Living at Limestone will provide significant community benefits in conjunction with the proposed CEF Zoning for this site. All improvements will be consistent with SHA requirements. The details and methodology used for this study are detailed in the sections that follow. 5


 PROPOSED STREETSCAPE IMPROVEMENTS PROPOSED")
9 L PARD SHEP INDEPENDENT LIVING BUILDING.6 5 STORIES INDEPENDENT LIVING BUILDING.7 5 STORIES INDEPENDENT LIVING BUILDING.3 5 STORIES EXISTING TREES INDEPENDENT LIVING BUILDING.4 5 STORIES PEDESTRIAN BRIDGE INDEPENDENT LIVING BUILDING 2. 5 STORIES SKILLED NURSING 3 STORIES CLUBHOUSE BUILDING. 3 STORIES EXISTING SHEPPARD LANE CARE CENTER PROPOSED SHEPPARD LANE REALIGNMENT AND WIDENING ASSISTED LIVING & MEMORY CARE 4 STORIES INDEPENDENT LIVING BUILDING. 5 STORIES FLOOD PLAIN RELOCATED TRAFFIC SIGNAL CLUBHOUSE BUILDING 2. PROPOSED GATEHOUSE SALES CENTER STORY PROPOSED CLARKSVILLE PIKE WIDENING IK E INDEPENDENT LIVING BUILDING.5 4 STORIES NEIGHBORHOOD 2 INDEPENDENT LIVING UNITS 47 CCRC ACCESSORY SPACE 4,SF +/PARKING 68 GARAGE2 SURFACE CARE CENTER (assisted living, memory care, skilled nursing) 24 UNITS +/- SV I AR K TOTALS INDEPENDENT LIVING UNITS,2 CARE CENTER UNITS 2 +/CCRC ACCESSORY SPACE 8,SF +/PARKING,38 GARAGE2 3 SURFACE,68 TOTAL CL EMPLOYEE/EVENT PARKING (2 LEVEL) PROPOSED STREETSCAPE IMPROVEMENTS PROPOSED PUBLIC ACCESS ROAD RELOCATED GAS STATION POTENTIAL CONNECTION TO AUTO DRIVE NEIGHBORHOOD INDEPENDENT LIVING UNITS 73 CCRC ACCESSORY SPACE 68,SF +/PARKING 7 GARAGE2 9 SURFACE LL INDEPENDENT LIVING BUILDING STORIES PROPOSED ENTRANCE EXISTING TREES INDEPENDENT LIVING BUILDING STORIES SITE DATA STORY EP NEIGHBORHOOD TWO INDEPENDENT LIVING BUILDING.2 5 STORIES NEIGHBORHOOD ONE INDEPENDENT LIVING BUILDING STORIES INDEPENDENT LIVING BUILDING STORIES Note: conceptual plan subject to final engineering and architectural refinement. ANE RESIDENT GARDENS ILLUSTRATIVE SITE PLAN POTENTIAL ACCESS TO CLARKSVILLE COMMONS PROPOSED ENTRANCE PROPOSED TRAFFIC SIGNAL LIN LIND TH EN LA ICU NE M N 2 3 ERICKSON LIVING AT LIMESTONE VALLEY HOWARD COUNTY, MARYLAND JULY 28, 27 Figure. - Site Concept Plan Notes:. CCRC Accessory Space consists of building areas allocated for resident amenities, resident services, food service, campus administration, and campus services. CCRC Accessory Spaces are typically located within clubhouse buildings (CB) as well as on the ground/first floor of independent living buildings. 2. Resident parking is provided in garages below independent living buildings SHEET DCP-6 6


10 Figure.2 - Road Improvement Concept Plan 7
11 EXISTING TRAFFIC CONDITIONS Site Information The proposed Erickson Living at Limestone Valley community will consist of a Continuing Care Retirement Community (CCRC) containing up to,2 units and a total of up to 2 beds in an Assisted Living Facility (ALF). The subject site is located on the north side of MD 8 (Clarksville Pike), south of Sheppard Lane in Howard County. Currently, the property is used as a farm. Study Area Based on Howard County s Adequate Road Facilities Test Evaluation requirements, the following intersections were identified to be included for the Chapter 4 study: MD 8 at Sheppard Lane MD 8 at Great Star Drive Since the site will generate more than peak hour trips, the MD 32, Westbound Ramp at MD 8 is also included to satisfy Chapter 5 Traffic Study. To further complete the CEF Zoning Study, additional signalized and unsignalized local roads were also included in the study. They include: MD 8 at Auto Drive MD 8 at Linden Linthicum Lane Figure 2. details the study area. MD 8 is owned and operated by SHA. The roadway extends for a distance of 5.24 miles from the Montgomery County Line to MD 75. In the vicinity of the subject site, the roadway is classified as an urban minor arterial on the State Secondary system. MD 8 is inventoried in the east/west direction. There are no access controls in the vicinity of the subject site. Along property frontage MD 8 features one travel lane in each direction. There are limited shoulders available and no existing pedestrian facilities. Immediately opposite the proposed access point for the Erickson Living at Limestone Valley community is a full movement access point for River Hill Garden Center which operates under stop control. The access point features short acceleration and deceleration lanes in addition to a bypass lane. 8
12 With the exception of Linden Linthicum Lane, all study intersections are controlled by traffic signalization. Generally, the corridor features separate left turn lanes along mainline MD 8 with shared thru/right lanes. A two-way center left turn lane is available from Auto Drive to Linden Linthicum Lane. The intersection of MD 8 and Sheppard Lane currently intersects at a 55 degree angle which is considered substandard. In addition, the minor approach only features a single lane approaching MD 8. Observations indicate that the existing left turn lane along eastbound MD 8 is too short to accommodate peak hour demand. Figure 2.2 contains a summary of the existing lane use of the study intersections. Additional details, including aerial photographs, can be found in Appendix B. Crash Data Crash data was obtained from Howard County representatives for all study intersections. The data, compiled by SHA encompasses the most recent threeyear period extending from 24 through 26. All summarized data can be found in Appendix F. A review of Appendix F shows that there are no discernable patterns related to crashes that warrant improvements. The most notable pattern involves left turn crashes at the intersection of MD 8 at Great Star Drive. The development of the subject site will not add any left turns to the affected movements, so no improvements should be required of this developer. It is important to recognize that this data accounts for crashes that involve personal injury or involves property damage that is significant enough for vehicles to be towed from the scene. 9

13 Figure 2. Study Area Map
14 Figure 2.2 Existing Lane Use Clarksville Pike Streetscape Plan and Design Guidelines Howard County adopted the Clarksville Pike Streetscape Plan and Design Guidelines on February, 26. The document sets forth different criteria and standards that should be accounted for within the Clarksville Pike (MD 8
15 corridor). Multiple elements within the design guidelines are incorporated within the improvements that are proposed in conjunction with Erickson Living at Limestone Valley. Among them: Installation of Traffic Signalization at Linden Linthicum Lane It is acknowledged within the design guidelines that the minor approach along Linden Linthicum Lane suffers from a high level of delay during peak periods. To mitigate this delay, the installation of traffic signalization is proposed. Pedestrian/Bicycle accommodations Within the site frontage, the construction of a continuous shared use path is proposed. The shared use path will permit the safe and efficient of pedestrians and bicycle within the corridor. Connectivity to west is also proposed beyond Linden Linthicum Lane. Implementation of Crosswalks In conjunction with traffic signalization at Linden Linthicum Lane, the introduction of crosswalks is also proposed. Crosswalks will allow pedestrians to safely cross MD 8 and minor streets. Development of Roadway Cross Sections The area immediately west of the subject site features four travel lanes and a two way center left turn lane. While not specifically stated within the design guidelines, this cross section will be maintained along property frontage to Sheppard Lane. By continuing this cross section, corridor will be significantly enhanced. Traffic Volumes Intersection turning movement counts were collected at each of the study intersections between the hours of 6:3-9: AM and from 4:-6:3 PM on a typical weekday while public school was in session. The additional count hours above the standard data collection periods were added because the initial counts showed the peak hours began at 7: AM and ended at 6: PM. The resulting volumes will, however, show that those peak hours are true peaks, as the 5 minute intervals decreased beyond the peak periods. River Hill High School, which is located to the east of the subject site, is in session from 7: AM-2:3 PM. As previously stated, this school was in session at the time of the data collection and its impact is fully accounted for within this analysis. Figure 2.3 details the existing peak hour traffic volumes. Full details on the turning movement counts can be found in Appendix B. 2
16 Figure 2.3 Existing Traffic Volumes Analysis of Existing Traffic Conditions Intersection capacity analysis was undertaken at each of the study intersections using Critical Lane Volume (CLV) methodology. The results are summarized below in Table 2.. Full details on the CLV analysis can be found in Appendix C. 3
17 AM Peak Hour Table 2. Summary of Existing CLV Existing LOS / CLV MD Sheppard Lane C/28 w/improvements --- MD Great Star Dr A/79 MD Auto Dr/Signal Bell Ln A/72 MD MD 32 WB Ramps A/78 MD Linden Linthicum Ln A/773 w/improvements --- MD Site Access/Garden Center PM Peak Hour --- Existing LOS / CLV MD Sheppard Lane C/234 w/improvements --- MD Great Star Dr C/7 MD Auto Dr/Signal Bell Ln A/88 MD MD 32 WB Ramps B/24 MD Linden Linthicum Ln C/3 w/improvements --- MD Site Access/Garden Center --- A review of Table 2. shows that each intersection is currently operating with an acceptable level of service using CLV methodology. A Synchro model was also developed for the MD 8 corridor using the model provided by Howard County Department of Public Works (DPW) Traffic Engineering as a base. The model was calibrated to match existing queue length found along MD 8. Table 2.2 summarizes the Highway Capacity Manual (HCM) results developed from the Synchro model. 4
18 Table 2.2 Summary of Existing Delay (HCM in seconds) Intersection Control Type Existing LOS / Delay AM PM MD Sheppard Lane Signal C/33. C/2.3 SB D/4.7 C/34. NB EB C/22. B/5.9 WB D/4.7 C/26.2 MD Great Star Dr Signal B/2. C/27.4 SB B/6.5 C/22.8 NB B/9.9 D/46.2 EB B/2.8 C/24. WB A/8.2 B/4. MD Auto Dr/Signal Bell Ln Signal A/8. B/.7 SB C/2. C/24.8 NB C/2.5 C/26. EB A/5.4 A/7.6 WB A/8.9 A/8.2 MD MD 32 WB Ramps Signal C/2.7 C/32.4 NB D/43. D/47.8 EB A/5.5 B/5.7 WB B/4.5 C/25.8 MD Linden Linthicum Ln Two Way Stop SB/LTR F/365 F/>999 NB/LT E/46.5 F/384. EB/L B/.4 A/9.6 WB/L B/.2 C/6.9 w/signal & Improvement Signal SB NB EB WB
19 As shown in Table 2.2, the minor street delay at Linden Linthicum Lane is very high during both peak periods. The implementation of signalization to reduce the delay is discussed in later sections of this document. A SimTraffic model was also developed based on the Synchro input. The SimTraffic model incorporates queuing found at study intersections. Table 2.3 details the results of the SimTraffic analysis. Appendix E contains output from the models. 6
20 Table 2.3 Summary of Existing Queuing (in feet) Intersection MD Sheppard Lane Available Storage Existing AM PM SB/LR, LTR FOR BACK'D SB/LT SB/R EB/L EB/TR EB/L 5 Exist./>2 Total EB/T EB/R WB/L WB/T WB/T WB/R MD Great Star Dr SB/LTR NB/L NB/LT NB/R EB/L EB/T EB/TR WB/L WB/T >2' WB/TR >2' 7 6 MD Auto Dr/Signal Bell Ln SB/LT SB/R NB/LTR EB/L EB/T EB/TR WB/L WB/T WB/TR
21 Table 2.3, con t Summary of Existing Queuing (in feet) Intersection MD MD 32 WB Ramps Available Storage Existing AM PM NB/L NB/LT > NB/R EB/L EB/T EB/T WB/T WB/TR MD Linden Linthicum Ln SB/LTR SB/L SB/TR NB/LT > NB/R EB/L 9' EB/T > EB/TR EB/R >5 <25 <25 WB/L WB/T --- <25 <25 WB/T 225 <25 <25 WB/R MD Site Access/Garden Center NB/R EB/L WB/R
22 BACKGROUND TRAFFIC CONDITIONS Design Year(s) Based on the anticipated completion of the Erickson Living at Limestone Valley community, a six year horizon is considered for the Adequate Road Facilities Test Evaluation. Historic traffic volumes in the MD 8 corridor were reviewed to quantify the most accurate growth rate. As shown in Appendix D, traffic volumes have remained consistent, with even a slight decrease. To account for potential regional growth, present a conservative analysis and remain consistent the growth rate utilized by Sabra, Wang & Associates in their document titled Multimodal Traffic Study and Conceptual Improvements: Clarksville Pike (MD 8) dated April 25 a.5% annual growth rate was considered for 6 years. The growth rate was utilized based on models prepared by Baltimore Metropolitan Council (BMC). Figure 3. shows the 223 base peak hour traffic volumes. For Chapter 5 purposes, a 237 Traffic Analysis is also accounted for. Figure 3.2 details the 237 base peak hour traffic volumes which increase the existing traffic at 6% per year from 223 to 237. Background Traffic Howard County s Department of Planning and Zoning website was consulted to determine the approved but unbuilt projects in the vicinity of the subject site. As shown in Figure 3.3, a total of seven developments have been approved but remain unbuilt. Table 3. includes a list of those developments. 9
23 Figure Base Peak Hour Traffic Volumes 2
24 Figure Base Peak Hour Traffic Volumes 2
 4. Antwerpen Hyundai (SDP-4-6) 5. Coleman Fiat (SDP-5-4) 6. Antwerpen Properties (SDP-6-2) 7. River Hill Garden Center 8.")
25 Figure 3.3 Background Development Map Table 3. Background Development Listing No. Development. Criswood Manor Sec 4 Lot 22 (SDP-5-38) 2. Trotter Woods, Lot 24 (SDP-5-62) 3. TAJ Property (SDP-5-26) 4. Antwerpen Hyundai (SDP-4-6) 5. Coleman Fiat (SDP-5-4) 6. Antwerpen Properties (SDP-6-2) 7. River Hill Garden Center 8. Clarksville Commons (SDP-3-79) 22
26 It is important to recognize the redevelopment of River Hill Garden Center was incorporated within this analysis. While the development is not yet approved, it will have a direct impact on study intersections. Therefore, its inclusion represents a conservative analysis for this report. The Institute of Transportation Engineers (ITE) Trip Generation (9 th Edition) was consulted to quantify trips projected to be generated by each of the background developments. Based on current traffic patterns and anticipated future demand, the trips associated with each of the background developments were distributed and assigned to the road network. Details on the trip generation and distribution for background developments can be found in Appendix D. Figure 3.4 details the combined trips generated by all approved developments. Combining the trips projected to be generated by the approved developments with the base peak hour traffic volumes results in the 223 and 237 background peak hour traffic volumes as shown in Figures 3.5 and 3.6, respectively. 23
27 Figure 3.4 Combined Trips Generated by Background Developments 24
28 Figure Background Peak Hour Traffic Volumes 25
29 Figure Background Peak Hour Traffic Volumes Analysis of Background Traffic Conditions Critical Lane Volume Analysis was again undertaken for each of the study intersections, this time with consideration given to the development of all background developments. Complete capacity worksheets can be found in Appendix C. As shown in Table 3.2, all intersections are projected to maintain acceptable levels of service, with the exception of MD 8 at Sheppard Lane. 26
30 During both the morning and peak periods, this intersection will exhibit Level of Service F conditions. Improvements to provide acceptable operations will be detailed later in this document. AM Peak Hour Table 3.2 Summary of Background CLV Existing LOS / 223 Back'd CLV LOS / CLV 237 Back'd LOS / CLV MD Sheppard Lane C/28 F/69 F/3368 w/improvements MD Great Star Dr A/79 A/874 F/865 MD Auto Dr/Signal Bell Ln A/72 A/878 F/859 MD MD 32 WB Ramps A/78 A/988 F/265 MD Linden Linthicum Ln A/773 A/958 F/245 w/improvements MD Site Access/Garden Center PM Peak Hour Existing LOS / 223 Back'd 237 Back'd CLV LOS / CLV LOS / CLV MD Sheppard Lane C/234 F/77 F/3449 w/improvements MD Great Star Dr C/7 D/399 F/33 MD Auto Dr/Signal Bell Ln A/88 B/47 F/224 MD MD 32 WB Ramps B/24 D/362 F/292 MD Linden Linthicum Ln C/3 E/563 F/3383 w/improvements MD Site Access/Garden Center The Synchro model was also updated to incorporate the regional growth and impact from background developments. Table 3.3 summarizes the HCM levels of service associated with the intersection operations. As shown in the analysis, the intersection of MD 8 at Linden Linthicum Lane has a high level of delay on the minor approach. This is a result of the lack of signalization at this location. Improvements will be detailed to enhance the overall level of service at this location. In addition, LOS E conditions are projected at the intersection of MD 8 at Sheppard Lane. Proposed improvements at this location which are discussed in later sections of this document would mitigate the noted deficiency. 27
31 Table 3.3 Summary of Background Delay (HCM in seconds) Intersection Control Type Existing LOS / Delay 223 Back'd LOS / Delay AM PM AM PM MD Sheppard Lane Signal C/33. C/2.3 E/58.7 D/44. SB D/4.7 C/34. F/87.5 E/57.6 NB C/33.8 D/53.4 EB C/22. B/5.9 D/43. C/32.7 WB D/4.7 C/26.2 E/59.2 E/63.5 MD Great Star Dr Signal B/2. C/27.4 B/5. D/44.2 SB B/6.5 C/22.8 B/9.9 C/27.2 NB B/9.9 D/46.2 C/27.4 F/2 EB B/2.8 C/24. B/5.3 C/29.3 WB A/8.2 B/4. A/9.8 B/7.2 MD Auto Dr/Signal Bell Ln Signal A/8. B/.7 A/8.6 B/4.6 SB C/2. C/24.8 C/24.5 C/34. NB C/2.5 C/26. C/24.9 D/38. EB A/5.4 A/7.6 A/5.7 B/.5 WB A/8.9 A/8.2 A/9.2 B/.8 MD MD 32 WB Ramps Signal C/2.7 C/32.4 C/23.6 D/36.7 NB D/43. D/47.8 D/39. D/47.4 EB A/5.5 B/5.7 B/.3 C/2.9 WB B/4.5 C/25.8 C/2.3 D/36.8 MD Linden Linthicum Ln Stop SB/LTR F/365 F/>999 F/>999 F/>999 NB/LT E/46.5 F/384. F/42. F/>999 EB/L B/.4 A/9.6 B/3.2 B/.9 WB/L B/.2 C/6.9 B/.7 C/24.5 w/signal & Improvement Signal SB NB EB WB MD Site Access/Garden Stop Center NB/R, FR for Total C/7.7 E/38.2 EB/L The queuing for all study intersections is shown in Table 3.4 and output can be found in Appendix E. 28
32 Table 3.4 Summary of Background Queuing (in feet) Intersection MD Sheppard Lane Available Storage Existing 223 Back'd AM PM AM PM SB/LR, LTR FOR BACK'D SB/LT SB/R EB/L EB/TR <25 29 EB/L 5 Exist./>2 Total EB/T EB/R WB/L WB/T WB/T WB/R MD Great Star Dr SB/LTR NB/L NB/LT NB/R EB/L EB/T EB/TR WB/L WB/T >2' WB/TR >2' MD Auto Dr/Signal Bell Ln SB/LT SB/R NB/LTR EB/L EB/T EB/TR WB/L WB/T WB/TR
33 Table 3.4 con t Summary of Background Queuing (in feet) Intersection MD MD 32 WB Ramps Available Storage Existing 223 Back'd AM PM AM PM NB/L NB/LT > NB/R EB/L EB/T EB/T WB/T WB/TR MD Linden Linthicum Ln SB/LTR SB/L SB/TR NB/LT > NB/R EB/L 9' EB/T > EB/TR EB/R >5 <25 <25 <25 <25 WB/L WB/T --- <25 < WB/T 225 <25 < WB/R MD Site Access/Garden Center NB/R EB/L WB/R
34 TOTAL TRAFFIC CONDITIONS Site Information The proposed Erickson Living at Limestone Valley community is situated on the north side of MD 8, west of Sheppard Lane in Howard County, Maryland. A Continuing Care Retirement Community (CCRC) with up to 2 units is proposed. In addition, a 24 bed Assisted Living Facility (ALF) will also be constructed on-site. Access to the property is proposed via one point along MD 8 and a secondary point along an extension of Linden Linthicum Lane (Proposed Public Access Road). In order for Proposed Public Access Road to be constructed the existing Freestate gasoline station situated on the north side of MD 8 would have to be relocated. The relocation of the gas station is being considered in conjunction with this application. The MD 8 access will operate under stop control and left turns out of the facility will be restricted. The access point along Proposed Public Access Road will operate under stop control. Traffic signalization is proposed at the intersection of MD 8 and Linden Linthicum Lane/Proposed Public Access in order to safely and efficiently accommodate site traffic destined to points east along MD 8. Trip Generation/Distribution ITE s Trip Generation (9 th Edition) was again utilized to quantify the trips projected to be generated by the development of the Erickson Living at Limestone Valley Community. Table 4. details the trip generation rates for the different uses on-site. The associated trip generation for the project is shown in Table 4.2. Table 4. Trip Generation Rates Continuing Care Retirement Community (ITE-255, Units) In/Out % Morning Trips =.4 x Units 65/35 Evening Trips =.6 x Units 39/6 Assisted Living (ITE-254, Beds) Morning Trips =.4 x Beds 65/35 Evening Trips =.22 x Beds 44/56 3
35 Land Use Table 4.2 Trip Generation Totals AM Peak Hour PM Peak Hour Size In Out Total In Out Total CCRC,2 Units ALF 24 Beds Total Trips Based on current traffic counts and anticipated future demand, the trips projected to be generated by the Erickson Living at Limestone Valley Community were distributed and assigned to the road network as shown in Figure 4.. As previously stated, left turns directly to MD 8 will be restricted from the site by the use of physical channelization. Therefore, all left turn traffic is routed via Proposed Public Access Road. Erickson intends to control access to its facility and therefore route employees and deliveries to the site via Proposed Public Access Road. While trip generation does not differentiate the different types of peak hour trips at a CCRC, it is estimated that 7% of peak hour traffic is related to staff and is therefore assigned to Proposed Public Access Road. Adding the trips projected to be generated by the subject site to the background peak hour traffic volumes results in the total peak hour traffic volumes as shown in Figure 4.2 for Design Year 223 and Figure 4.3 for Design Year 237. An adjustment was made to the background minor street volumes at the intersection of MD 8 at Linden Linthicum Lane because of the implementation of signalization at this location. It is projected that during the peak periods, 25% of left turn traffic along Great Star Drive approaching MD 8 would be diverted to Linden Linthicum Lane. In addition, the development of Proposed Public Access Road would allow property owners on the north side of MD 8 west of the roadway signalized access to the corridor, if they construct driveways to it. The introduction of access to the new roadway would give drivers the opportunity to access MD 8 via a signalized intersection. Figure 4.4 shows the adjustment and the adjusted total peak hour traffic volumes can be found in Figure
36 Figure 4. Trip Distribution and Assignment 33
37 Figure Total Peak Hour Traffic Volumes 34
38 Figure Total Peak Hour Traffic Volumes 35
39 Figure Adjustment to Total Peak Hour Traffic Volumes 36
40 Figure Adjusted Total Peak Hour Traffic Volumes Analysis of Total Traffic Conditions Intersection Capacity Analysis was again undertaken, this time with consideration given to the full buildout of the Erickson Living at Limestone Valley Community. The CLV results are summarized in Table 4.3. Complete capacity worksheets can be found in Appendix C. As shown, all intersections are projected to exhibit 37
41 acceptable levels of service with the exception of MD 8 at Sheppard Lane and MD 8 at Linden Linthicum Lane. Improvements for these locations are detailed below. The 237 analysis is provided for future planning purposes only. No improvements are required to mitigate 237 conditions. AM Peak Hour Table 4.3 Summary of Total CLV Analysis Existing LOS / CLV 223 Back'd LOS / CLV 223 Total LOS/CLV 237 Back'd LOS / CLV 237 Total LOS/CLV MD Sheppard Lane C/28 F/69 F/662 F/3368 F/342 w/improvements B/ F/294 MD Great Star Dr A/79 A/874 A/92 F/865 F/92 w/adjusted Traffic A/ MD Auto Dr/Signal Bell Ln A/72 A/878 A/94 F/859 F/884 MD MD 32 WB Ramps A/78 A/988 B/52 F/265 F/229 MD Linden Linthicum Ln A/773 A/958 B/44 F/245 F/253 w/adjustment & improvements A/ F/553 MD Site Access/Garden Center A/ D/4 PM Peak Hour MD Sheppard Lane C/234 F/77 F/756 F/3449 F/3498 w/improvements C/6 --- F/2265 MD Great Star Dr C/7 D/399 D/434 F/33 F/348 w/adjusted Traffic D/ MD Auto Dr/Signal Bell Ln A/88 B/47 B/82 F/224 F/2276 MD MD 32 WB Ramps B/24 D/362 D/44 F/292 F/2965 MD Linden Linthicum Ln C/3 E/563 F/75 F/3383 F/3572 w/adjustment & improvements B/9 --- F/28 MD Site Access/Garden Center A/ F/85 The Synchro model was again modified to reflect the impact associated with the full buildout of the site and the associated road improvements. The results are shown in Table 4.4 for the HCM analysis, which demonstrates that with improvements described below, all study intersections will operate with an acceptable level of service and most will exhibit less delay under the total condition than they do under background conditions. 38
42 Table 4.5 details the queuing associated with the improvements. As shown within the table, the site will have minimal impacts at all locations. Queue lengths at unimproved intersections are typically changed by less than one vehicle length during both peak periods, with the exception of some of the residual thru queues associated with road widening. All projected turn bays are able to accommodate future demand. At improved intersections, queuing is significantly reduced in most cases. Appendix E contains Synchro/Simtraffic output. 39
43 Table 4.4 Summary of Total Delay (HCM in seconds) Intersection Control Type Existing LOS / Delay 223 Back'd LOS / Delay 223 Total w/imp LOS/Delay AM PM AM PM AM PM MD Sheppard Lane Signal C/33. C/2.3 E/58.7 D/44. C/3.8 C/3.7 SB D/4.7 C/34. F/87.5 E/57.6 D/4.5 D/49.5 NB C/33.8 D/53.4 D/52.6 D/53.2 EB C/22. B/5.9 D/43. C/32.7 C/29. C/28.5 WB D/4.7 C/26.2 E/59.2 E/63.5 C/24.8 C/27. MD Great Star Dr Signal B/2. C/27.4 B/5. D/44.2 B/7.3 D/5.7 SB B/6.5 C/22.8 B/9.9 C/27.2 D/4.6 E/77.9 NB B/9.9 D/46.2 C/27.4 F/2 C/33. E/75.8 EB B/2.8 C/24. B/5.3 C/29.3 B/8.2 D/54.9 WB A/8.2 B/4. A/9.8 B/7.2 B/2.2 C/33.4 MD Auto Dr/Signal Bell Ln Signal A/8. B/.7 A/8.6 B/4.6 A/8.3 B/5.2 SB C/2. C/24.8 C/24.5 C/34. C/28. D/36.2 NB C/2.5 C/26. C/24.9 D/38. C/28.7 D/42.5 EB A/5.4 A/7.6 A/5.7 B/.5 A/5.5 B/.6 WB A/8.9 A/8.2 A/9.2 B/.8 A/8.5 B/.8 MD MD 32 WB Ramps Signal C/2.7 C/32.4 C/23.6 D/36.7 C/22. C/32.7 NB D/43. D/47.8 D/39. D/47.4 C/27.7 D/42.6 EB A/5.5 B/5.7 B/.3 C/2.9 B/3.6 B/8.4 WB B/4.5 C/25.8 C/2.3 D/36.8 C/23.7 C/32.8 MD Linden Linthicum Ln Stop SB/LTR F/365 F/>999 F/>999 F/> NB/LT E/46.5 F/384. F/42. F/> EB/L B/.4 A/9.6 B/3.2 B/ WB/L B/.2 C/6.9 B/.7 C/ w/signal & Improvement Signal B/.8 B/8.2 SB B/9. C/32.2 NB B/8.8 C/29. EB A/9.7 B/7.8 WB B/.7 B/2.7 MD Site Access/Garden Center Stop NB/R, FR for Total C/7.7 E/ EB/L B/2.2 B/.4 4
44 Table 4.5 Summary of Total Queuing (in feet) Intersection MD Sheppard Lane Available Storage Existing 223 Back'd 223 Total Improved AM PM AM PM AM PM SB/LR, LTR FOR BACK'D SB/LT SB/R EB/L EB/TR < EB/L 5 Exist./>2 Total EB/T EB/R WB/L WB/T WB/T WB/R MD Great Star Dr SB/LTR NB/L NB/LT NB/R EB/L EB/T EB/TR WB/L WB/T >2' WB/TR >2' MD Auto Dr/Signal Bell Ln SB/LT SB/R NB/LTR EB/L EB/T EB/TR WB/L WB/T WB/TR
45 Table 4.5 (con t) Summary of Total Queuing (in feet) Intersection MD MD 32 WB Ramps Available Storage Existing 223 Back'd 223 Total Improved AM PM AM PM AM PM NB/L NB/LT > NB/R EB/L EB/T EB/T WB/T WB/TR MD Linden Linthicum Ln SB/LTR SB/L SB/TR NB/LT > NB/R EB/L 9' EB/T > EB/TR EB/R >5 <25 <25 <25 < WB/L WB/T --- <25 < WB/TR 225 <25 < MD Site Access/Garden Center NB/R <25 <25 EB/L WB/R <25 <25 Since this project is seeking CEF Zoning, additional road improvements are proposed above are beyond what would typically be required to satisfy Adequate Road Facilities Test Evaluation requirements. Below, the proposed improvements are detailed. The recommended lane use can be found in Figure 4.6. Appendix A contains a full size plan of the proposed improvements. 42
46 MD 8 at Sheppard Lane Sheppard Lane currently intersects MD 8 at a 55 degree angle, which is substandard and has a negative impact on intersection operations. In addition, the Sheppard Lane approach features just a single lane for traffic accessing MD 8. Finally, the existing left turn lane from eastbound MD 8 to Sheppard Lane is only 75 feet long which results in significant queuing that blocks the through lane. The following improvements are proposed at this location: Realign Sheppard Lane to the west at an angle of a minimum of 7 degrees as acceptable to SHA. Widen the Sheppard Lane approach to provide two lanes onto MD 8, including a separate right turn lane and separate left turn lane. Provide a continuous left turn lane along eastbound MD 8, approaching Sheppard Lane. Widen the westbound MD 8 approach to provide two thru lanes and a separate right lane. Reconstruct the traffic signal and provide pedestrian accommodations as required by SHA. Provide interconnection of the traffic signal along MD 8 to MD 32. Not only do the proposed improvements at MD 8 at Sheppard Lane improve the CLV to an acceptable level, but queuing is significantly reduced on all approaches. This operations issue is existing under current conditions which would provide significant benefits to all roadway users. MD 8 at Linden Linthicum Lane/Proposed Public Access Road The existing intersection of MD 8 and Linden Linthicum Lane features stop control for the minor approach. As a result, significant delays are encountered during the peak period for left turning traffic. The following improvements are recommended to mitigate delays and improve operations at this intersection: Install traffic signalization once approved by SHA. Provide an extension of Linden Linthicum Lane (Proposed Public Access Road) on the north side of MD 8 to provide site access and potential future connections to commercial properties to the west. 43
47 Convert the existing right turn lane along eastbound MD 8 to a shared thru/right lane. Convert the westbound MD 8 auxiliary lane to a shared thru/right lane. The construction of these improvements, including the Proposed Public Access Road on the north side of MD 8, will provide a significant community benefit. The new road will allow property owners on the west side to have signalized access to MD 8. While the elimination of unsignalized access points is not recommended, drivers will have a choice to utilize signalized access to the MD 8 corridor, particularly during peak periods. In addition, the installation of the traffic signal at Linden Linthicum Lane is consistent with elements of the Clarksville Pike Streetscape Plan which was adopted by Howard County in 26. The implementation of the signal will allow for synchronized traffic signals between Sheppard Lane and MD 32, which will significantly enhance operations providing a community benefit. MD 8 at Site Access A limited access point is proposed along MD 8, opposite the existing access point for River Hill Garden Center which is approximately 475 feet west of Sheppard Lane. At this access point, which will operate under stop control, a left-in/right-in/right-out is proposed. A separate left turn lane will be provided into the site. The following enhancements are also proposed in conjunction with the access point: Construct a five lane section along MD 8 in between Linden Linthicum Lane and Sheppard Lane, covering a distance of approximately,3 feet. Provide separate acceleration and deceleration lanes into the subject site, based on SHA requirements. Provide appropriate channelization to restrict left turns out of the subject site. The construction of the five lane section along MD 8 is consistent with the Clarksville Pike Streetscape Plan and will match the section of MD 8 to the west of Linden Linthicum Lane. This construction will provide a significant benefit to roadway users, as queuing for Sheppard Lane will no longer block thru traffic along MD 8. A full size version of the plan is included in Appendix A. 44
48 Figure 4.6 Future Recommended Lane Use 45
49 RESULTS, RECOMMENDATIONS, AND CONCLUSIONS Study Purpose The Traffic Group, Inc. has prepared this Adequate Road Facilities Test Evaluation and Traffic Study to quantify the impact the proposed development of Erickson Living at Limestone will have on the surrounding road network in Howard County, Maryland. The subject site is situated on the north side of MD 8, west of Sheppard Lane. A total of,2 units within a continuing care retirement community are proposed. In addition, 24 beds within an assisted living facility will also be constructed on-site. Access to the property is proposed via one access point along MD 8 and a secondary point of access along an extension of Linden Linthicum Lane. The MD 8 access will operate under stop control and left turns out of the facility will be restricted. The access point along the new public road will operate under stop control. Traffic signalization is proposed at the intersection of MD 8 and Linden Linthicum Lane. Full buildout of the project is expected within three years. Study Criteria/Methodology This study was conducted in accordance with Chapter 4 of the Howard County Design Manual Volume III (Road and Bridge Design). Chapter4 details the requirements for the Adequate Road Facilities Test Evaluation. Chapter 4 studies require that the first intersection of a Major Collector or higher classified roadway with another Major Collector or higher classified roadway in all directions from the subject site be reviewed and analyzed. Since the site will generate more than trips, a Chapter 5 traffic study is also required. For this traffic study, all classified intersections within one-half mile of the subject site must be reviewed. However, improvements are not required at these locations. All intersections ae reviewed using Critical Lane Volume (CLV) methodology. Intersections that are controlled by Maryland State Highway Administration (SHA) must exhibit Level of Service E or better conditions during all study periods. Because of the complexity of this project, a Synchro model was prepared for the MD 8 corridor. 46
50 In addition to traditional road improvements that may be required as part of the Adequate Road Facilities Test Evaluation road improvements that will provide additional community benefit are proposed in conjunction with the CEF (Community Enhanced Floating Zone) requirement for this site. Details on the proposed improvements will be provided in later sections of this document. Summary of Findings and Recommendations This analysis will show that all study intersections are currently operating within acceptable level of service when considering CLV under existing conditions. When considering the impact of background traffic, the intersection of MD 8 at Sheppard Lane is projected to operate at Level of Service F conditions during both the morning and evening peak periods. All other remaining intersections will feature acceptable operations. With the additional impact associated with the development of the subject site, the intersection of MD 8 at Sheppard Lane will continue to exhibit Level of Service F conditions. Since this project is seeking CEF Zoning, additional road improvements are proposed above and beyond what would typically be required to satisfy Adequate Road Facilities Test Evaluation requirements. Below, the proposed improvements are detailed. MD 8 at Sheppard Lane Sheppard Lane currently intersects MD 8 at a 55 degree angle, which is substandard and has a negative impact on intersection operations. In addition, the Sheppard Lane approach features just a single lane for traffic accessing MD 8. Finally, the existing left turn lane from eastbound MD 8 to Sheppard Lane is only 75 feet long which results in significant queuing that blocks the through lane. The following improvements are proposed at this location: Realign Sheppard Lane to the west at an angle of a minimum of 7 degrees as acceptable to SHA. Widen the Sheppard Lane approach to provide two lanes onto MD 8, including a separate right turn lane and separate left turn lane. Provide a continuous left turn lane along eastbound MD 8, approaching Sheppard Lane. 47
51 Widen the westbound MD 8 approach to provide two thru lanes and a separate right lane. Reconstruct the traffic signal and provide pedestrian accommodations as required by SHA. Provide interconnection of the traffic signal along MD 8 to MD 32. Not only do the proposed improvements at MD 8 at Sheppard Lane improve the CLV to an acceptable level, but queuing is significantly reduced on all approaches with the implementation of these improvements. This operations issue is existing under current conditions which would provide significant benefits to all roadway users. MD 8 at Linden Linthicum Lane The existing intersection of MD 8 and Linden Linthicum Lane features stop control for the minor approach. As a result, significant delays are encountered during the peak period for left turning traffic. The following improvements are recommended to mitigate delays and improve operations at this intersection: Install traffic signalization once approved by SHA. Provide an extension of Linden Linthicum Lane (Proposed Public Access Road) on the north side of MD 8 to provide site access and potential future connections to commercial properties to the west. Convert the existing right turn lane along eastbound MD 8 to a shared thru/right lane. Convert the westbound MD 8 auxiliary lane to a shared thru/right lane. The construction of these improvements, including the proposed access road on the north side of MD 8, will provide a significant community benefit. The access road will allow property owners on the west side to have signalized access to MD 8. While the elimination of unsignalized access points is not recommended, drivers will have a choice to utilize signalized access to the corridor, particularly during peak periods. In addition, the installation of the traffic signal at Linden Linthicum Lane is consistent with elements of the Clarksville Pike streetscape plan which was adopted by Howard County in 26. The implementation of the signal will allow for synchronized traffic signals between Sheppard Lane and MD 32, which will significantly enhance operations providing a community benefit. 48
52 MD 8 at Site Access A limited access point is proposed along MD 8, opposite the existing access point for River Hill Garden Center which is approximately 475 feet west of Sheppard Lane. At this access point, which will operate under stop control, a left-in/right-in/right-out is proposed. A separate left turn lane will be provided into the site. The following enhancements are also proposed in conjunction with the access point: Construct a five lane section along MD 8 in between Linden Linthicum Lane and Sheppard Lane, which is a distance of approximately,3 feet. Provide separate acceleration and deceleration lanes into the subject site. Provide appropriate channelization to restrict left turns out of the subject site. The construction of the five lane section along MD 8 is consistent with the Clarksville Pike streetscape plan and will match the section of MD 8 to the west of Linden Linthicum Lane. This construction will provide a significant benefit to roadway users, as queuing for Sheppard Lane will no longer block through traffic along MD 8. As previously stated, the improvements proposed in conjunction with the development of Erickson Living at Limestone will provide significant community benefits in conjunction with the proposed CEF Zoning for this site. 49
53 APPENDIX A Concept Road Improvement Plan
54 L PARD SHEP INDEPENDENT LIVING BUILDING.6 5 STORIES INDEPENDENT LIVING BUILDING.7 5 STORIES INDEPENDENT LIVING BUILDING.3 5 STORIES EXISTING TREES INDEPENDENT LIVING BUILDING.4 5 STORIES PEDESTRIAN BRIDGE INDEPENDENT LIVING BUILDING 2. 5 STORIES SKILLED NURSING 3 STORIES CLUBHOUSE BUILDING. 3 STORIES EXISTING SHEPPARD LANE CARE CENTER PROPOSED SHEPPARD LANE REALIGNMENT AND WIDENING ASSISTED LIVING & MEMORY CARE 4 STORIES INDEPENDENT LIVING BUILDING. 5 STORIES FLOOD PLAIN RELOCATED TRAFFIC SIGNAL CLUBHOUSE BUILDING 2. PROPOSED GATEHOUSE SALES CENTER STORY PROPOSED CLARKSVILLE PIKE WIDENING IK E INDEPENDENT LIVING BUILDING.5 4 STORIES SV I AR K CL EMPLOYEE/EVENT PARKING (2 LEVEL) PROPOSED STREETSCAPE IMPROVEMENTS PROPOSED PUBLIC ACCESS ROAD RELOCATED GAS STATION POTENTIAL CONNECTION TO AUTO DRIVE NEIGHBORHOOD INDEPENDENT LIVING UNITS 73 CCRC ACCESSORY SPACE 68,SF +/PARKING 7 GARAGE2 9 SURFACE NEIGHBORHOOD 2 INDEPENDENT LIVING UNITS 47 CCRC ACCESSORY SPACE 4,SF +/PARKING 68 GARAGE2 SURFACE CARE CENTER (assisted living, memory care, skilled nursing) 24 UNITS +/- LL INDEPENDENT LIVING BUILDING STORIES PROPOSED ENTRANCE EXISTING TREES INDEPENDENT LIVING BUILDING STORIES SITE DATA STORY EP NEIGHBORHOOD TWO INDEPENDENT LIVING BUILDING.2 5 STORIES NEIGHBORHOOD ONE INDEPENDENT LIVING BUILDING STORIES INDEPENDENT LIVING BUILDING STORIES Note: conceptual plan subject to final engineering and architectural refinement. ANE RESIDENT GARDENS ILLUSTRATIVE SITE PLAN POTENTIAL ACCESS TO CLARKSVILLE COMMONS PROPOSED ENTRANCE PROPOSED TRAFFIC SIGNAL LIN LIND TH EN LA ICU NE M N 2 3 ERICKSON LIVING AT LIMESTONE VALLEY HOWARD COUNTY, MARYLAND JULY 28, 27 TOTALS INDEPENDENT LIVING UNITS,2 CARE CENTER UNITS 2 +/CCRC ACCESSORY SPACE 8,SF +/PARKING,38 GARAGE2 3 SURFACE,68 TOTAL Notes:. CCRC Accessory Space consists of building areas allocated for resident amenities, resident services, food service, campus administration, and campus services. CCRC Accessory Spaces are typically located within clubhouse buildings (CB) as well as on the ground/first floor of independent living buildings. 2. Resident parking is provided in garages below independent living buildings SHEET DCP-6
55 2


56 3
57 APPENDIX B Intersection Turning Movement Counts, and Photos
58 TOTALS TURNING MOVEMENT COUNT - SUMMARY Counted by: VCU Intersection of: MD 8 Date: April 26, 27 Wednesday and: Sheppard Lane Weather: Cool, Light Rain Location: Howard County, Maryland Entered by: BGJ Star Rating: 3 TRAFFIC FROM NORTH TRAFFIC FROM SOUTH TRAFFIC FROM EAST TRAFFIC FROM WEST TOTAL on: MD 8 on: MD 8 on: on: Sheppard Lane N + S TIME + RIGHT THRU LEFT U-TN TOTAL RIGHT THRU LEFT U-TN TOTAL RIGHT THRU LEFT U-TN TOTAL RIGHT THRU LEFT U-TN TOTAL E + W AM 6:3-6: :45-7: : - 7: :5-7: :3-7: :45-8: : - 8: :5-8: :3-8: :45-9: Hr Totals Hr Totals 6:3-7: :45-7: : - 8: :5-8: :3-8: :45-8: : - 9: PEAK HOUR 7: - 8: PM 2:3-2: :45-3: : - 3: :5-3: :3-3: :45-4: : - 4: :5-4: :3-4: :45-5: : - 5: :5-5: :3-5: :45-6: : - 6: :5-6: Hr Totals Hr Totals 2:3-3: :45-3: : - 4: :5-4: :3-4: :45-4: : - 5: :5-5: :3-5: :45-5: : - 6: :5-6: :3-6: PEAK HOUR 5: - 6:
59 PEDESTRIAN AND BICYCLE OBSERVATIONS - SUMMARY TIME Counted by: VCU Intersection of: MD 8 Date: April 26, 27 Wednesday and: Sheppard Lane Weather: Cool, Light Rain Location: Howard County, Maryland Entered by: BGJ Star Rating: 3 AM 6:3-6:45 6:45-7: 7: - 7:5 7:5-7:3 7:3-7:45 7:45-8: 8: - 8:5 8:5-8:3 8:3-8:45 8:45-9: TOTALS PM 2:3-2:45 2:45-3: 3: - 3:5 3:5-3:3 3:3-3:45 3:45-4: 4: - 4:5 4:5-4:3 4:3-4:45 4:45-5: 5: - 5:5 5:5-5:3 5:3-5:45 5:45-6: 6: - 6:5 6:5-6:3 TOTALS NORTH LEG SOUTH LEG MD 8 MD 8 Pedestrians Bicycles Pedestrians Bicycles AM 6:3-6:45 6:45-7: 7: - 7:5 7:5-7:3 7:3-7:45 7:45-8: 8: - 8:5 8:5-8:3 8:3-8:45 8:45-9: TOTALS PM 2:3-2:45 2:45-3: 3: - 3:5 3:5-3:3 3:3-3:45 3:45-4: 4: - 4:5 4:5-4:3 4:3-4:45 4:45-5: 5: - 5:5 5:5-5:3 5:3-5:45 5:45-6: 6: - 6:5 6:5-6:3 TOTALS EAST LEG WEST LEG Sheppard Lane Pedestrians Bicycles Pedestrians Bicycles 2

60 3
61 TOTALS TURNING MOVEMENT COUNT - SUMMARY Counted by: VCU Intersection of: MD 8 Date: April 26, 27 Wednesday and: Great Star Drive Weather: Cool, Light Rain Location: Howard County, Maryland Entered by: BGJ Star Rating: 3 TRAFFIC FROM NORTH TRAFFIC FROM SOUTH TRAFFIC FROM EAST TRAFFIC FROM WEST TOTAL on: MD 8 on: MD 8 on: Great Star Drive on: Kendall Hardware Store N + S TIME + RIGHT THRU LEFT U-TN TOTAL RIGHT THRU LEFT U-TN TOTAL RIGHT THRU LEFT U-TN TOTAL RIGHT THRU LEFT U-TN TOTAL E + W AM 6:3-6: :45-7: : - 7: :5-7: :3-7: :45-8: : - 8: :5-8: :3-8: :45-9: : - 9: :5-9: :3-9: :45 - : : - : :5 - : :3 - : :45 - : : - : :5 - : :3 - : :45-2: : - 2: :5-2: :3-2: :45 - : : - : :5 - : :3 - : :45-2: : - 2: :5-2: :3-2: :45-3: : - 3: :5-3: :3-3: :45-4: : - 4: :5-4: :3-4: :45-5: : - 5: :5-5: :3-5: :45-6: : - 6: :5-6: :3-6: :45-7: Hr Totals
62 TOTALS TURNING MOVEMENT COUNT - SUMMARY Counted by: VCU Intersection of: MD 8 Date: April 26, 27 Wednesday and: Great Star Drive Weather: Cool, Light Rain Location: Howard County, Maryland Entered by: BGJ Star Rating: 3 TRAFFIC FROM NORTH TRAFFIC FROM SOUTH TRAFFIC FROM EAST TRAFFIC FROM WEST TOTAL on: MD 8 on: MD 8 on: Great Star Drive on: Kendall Hardware Store N + S TIME + RIGHT THRU LEFT U-TN TOTAL RIGHT THRU LEFT U-TN TOTAL RIGHT THRU LEFT U-TN TOTAL RIGHT THRU LEFT U-TN TOTAL E + W Hr Totals 6:3-7: :45-7: : - 8: :5-8: :3-8: :45-8: : - 9: :5-9: :3-9: :45-9: : - : :5 - : :3 - : :45 - : : - : :5 - : :3 - : :45 - : : - 2: :5-2: :3-2: :45-2: : - : :5 - : :3 - : :45 - : : - 2: :5-2: :3-2: :45-2: : - 3: :5-3: :3-3: :45-3: : - 4: :5-4: :3-4: :45-4: : - 5: :5-5: :3-5: :45-5: : - 6: :5-6: :3-6: :45-6: : - 7: PEAK HOUR 7: - 8: : - 6:
63 PEDESTRIAN AND BICYCLE OBSERVATIONS - SUMMARY TIME AM Counted by: VCU Intersection of: MD 8 Date: April 26, 27 Wednesday and: Great Star Drive Weather: Cool, Light Rain Location: Howard County, Maryland Entered by: BGJ Star Rating: 3 NORTH LEG SOUTH LEG MD 8 MD 8 Pedestrians Bicycles Pedestrians Bicycles 6:3-6:45 6:45-7: 7: - 7:5 7:5-7:3 7:3-7:45 7:45-8: 8: - 8:5 8:5-8:3 8:3-8:45 8:45-9: 9: - 9:5 9:5-9:3 9:3-9:45 9:45 - : : - :5 :5 - :3 :3 - :45 :45 - : 2 : - :5 :5 - :3 :3 - :45 :45-2: 2: - 2:5 2:5-2:3 2:3-2:45 2:45 - : : - :5 :5 - :3 :3 - :45 :45-2: 2: - 2:5 2:5-2:3 2:3-2:45 2:45-3: 3: - 3:5 3:5-3:3 3:3-3:45 3:45-4: 4: - 4:5 4:5-4:3 4:3-4:45 4:45-5: 5: - 5:5 5:5-5:3 5:3-5:45 5:45-6: 6: - 6:5 6:5-6:3 6:3-6:45 6:45-7: TOTALS 8 3 6
64 PEDESTRIAN AND BICYCLE OBSERVATIONS - SUMMARY AM Counted by: VCU Intersection of: MD 8 Date: April 26, 27 Wednesday and: Great Star Drive Weather: Cool, Light Rain Location: Howard County, Maryland Entered by: BGJ Star Rating: 3 EAST LEG WEST LEG Great Star Drive Kendall Hardware Store Pedestrians Bicycles Pedestrians Bicycles 6:3-6:45 6:45-7: 7: - 7:5 7:5-7:3 7:3-7:45 7:45-8: 8: - 8:5 8:5-8:3 8:3-8:45 8:45-9: 9: - 9:5 9:5-9:3 9:3-9:45 9:45 - : : - :5 :5 - :3 :3 - :45 :45 - : 2 : - :5 :5 - :3 :3 - :45 :45-2: 2: - 2:5 2:5-2:3 2:3-2:45 2:45 - : : - :5 :5 - :3 :3 - :45 :45-2: 2: - 2:5 2:5-2:3 2:3-2:45 2:45-3: 3: - 3:5 3:5-3:3 3:3-3:45 3:45-4: 4: - 4:5 4:5-4:3 4:3-4:45 4:45-5: 5: - 5:5 5:5-5:3 5:3-5:45 5:45-6: 6: - 6:5 6:5-6:3 6:3-6:45 6:45-7: TOTALS 3 2 7

65 8
66 CARS TURNING MOVEMENT COUNT - SUMMARY Counted by: VCU Intersection of: MD 8 Date: April 26, 27 Wednesday and: Auto Drive Weather: Cool, Light Rain Location: Howard County, Maryland Entered by: BGJ Star Rating: 5 TRAFFIC FROM NORTH TRAFFIC FROM SOUTH TRAFFIC FROM EAST TRAFFIC FROM WEST TOTAL on: MD 8 on: MD 8 on: Signal Bell Lane on: Auto Drive N + S TIME + RIGHT THRU LEFT U-TN TOTAL RIGHT THRU LEFT U-TN TOTAL RIGHT THRU LEFT U-TN TOTAL RIGHT THRU LEFT U-TN TOTAL E + W AM 6:3-6: :45-7: : - 7: :5-7: :3-7: :45-8: : - 8: :5-8: :3-8: :45-9: Hr Totals Hr Totals 6:3-7: :45-7: : - 8: :5-8: :3-8: :45-8: : - 9: PEAK HOUR 7:3-8: PM 2:3-2: :45-3: : - 3: :5-3: :3-3: :45-4: : - 4: :5-4: :3-4: :45-5: : - 5: :5-5: :3-5: :45-6: : - 6: :5-6: Hr Totals Hr Totals 2:3-3: :45-3: : - 4: :5-4: :3-4: :45-4: : - 5: :5-5: :3-5: :45-5: : - 6: :5-6: :3-6: PEAK HOUR 5: - 6:
67 PEDESTRIAN AND BICYCLE OBSERVATIONS - SUMMARY TIME Counted by: VCU Intersection of: MD 8 Date: April 26, 27 Wednesday and: Auto Drive Weather: Cool, Light Rain Location: Howard County, Maryland Entered by: BGJ Star Rating: 5 AM 6:3-6:45 6:45-7: 7: - 7:5 7:5-7:3 7:3-7:45 7:45-8: 8: - 8:5 8:5-8:3 8:3-8:45 8:45-9: 2 TOTALS 2 3 PM 2:3-2:45 2:45-3: 3: - 3:5 3:5-3:3 3:3-3:45 3:45-4: 4: - 4:5 4:5-4:3 4:3-4:45 4:45-5: 5: - 5:5 5:5-5:3 5:3-5:45 5:45-6: 2 6: - 6:5 6:5-6:3 TOTALS NORTH LEG SOUTH LEG MD 8 MD 8 Pedestrians Bicycles Pedestrians Bicycles 4 AM 6:3-6:45 6:45-7: 7: - 7:5 7:5-7:3 7:3-7:45 7:45-8: 8: - 8:5 8:5-8:3 8:3-8:45 8:45-9: TOTALS PM 2:3-2:45 2:45-3: 3: - 3:5 3:5-3:3 3:3-3:45 3:45-4: 4: - 4:5 4:5-4:3 4:3-4:45 4:45-5: 5: - 5:5 5:5-5:3 5:3-5:45 5:45-6: 6: - 6:5 6:5-6:3 TOTALS EAST LEG WEST LEG Signal Bell Lane Auto Drive Pedestrians Bicycles Pedestrians Bicycles 2

68
69 TOTALS TURNING MOVEMENT COUNT - SUMMARY Counted by: VCU Intersection of: MD 8 Date: April 26, 27 Wednesday and: MD 32 WB Ramps Weather: Cool, Light Rain Location: Howard County, Maryland Entered by: BGJ Star Rating: 5 TRAFFIC FROM NORTH TRAFFIC FROM SOUTH TRAFFIC FROM EAST TRAFFIC FROM WEST TOTAL on: MD 8 on: MD 8 on: MD 32 WB Off Ramp on: MD 32 WB On Ramp N + S TIME + RIGHT THRU LEFT U-TN TOTAL RIGHT THRU LEFT U-TN TOTAL RIGHT THRU LEFT U-TN TOTAL RIGHT THRU LEFT U-TN TOTAL E + W AM 6:3-6: :45-7: : - 7: :5-7: :3-7: :45-8: : - 8: :5-8: :3-8: :45-9: Hr Totals Hr Totals 6:3-7: :45-7: : - 8: :5-8: :3-8: :45-8: : - 9: PEAK HOUR 7: - 8: PM 2:3-2: :45-3: : - 3: :5-3: :3-3: :45-4: : - 4: :5-4: :3-4: :45-5: : - 5: :5-5: :3-5: :45-6: : - 6: :5-6: Hr Totals Hr Totals 2:3-3: :45-3: : - 4: :5-4: :3-4: :45-4: : - 5: :5-5: :3-5: :45-5: : - 6: :5-6: :3-6: PEAK HOUR 5: - 6:
70 PEDESTRIAN AND BICYCLE OBSERVATIONS - SUMMARY TIME Counted by: VCU Intersection of: MD 8 Date: April 26, 27 Wednesday and: MD 32 WB Ramps Weather: Cool, Light Rain Location: Howard County, Maryland Entered by: BGJ Star Rating: 5 AM 6:3-6:45 6:45-7: 7: - 7:5 7:5-7:3 7:3-7:45 7:45-8: 8: - 8:5 8:5-8:3 8:3-8:45 8:45-9: TOTALS PM 2:3-2:45 2:45-3: 3: - 3:5 3:5-3:3 3:3-3:45 3:45-4: 4: - 4:5 4:5-4:3 4:3-4:45 4:45-5: 5: - 5:5 5:5-5:3 5:3-5:45 5:45-6: 6: - 6:5 6:5-6:3 TOTALS NORTH LEG SOUTH LEG MD 8 MD 8 Pedestrians Bicycles Pedestrians Bicycles AM 6:3-6:45 6:45-7: 7: - 7:5 7:5-7:3 7:3-7:45 7:45-8: 8: - 8:5 8:5-8:3 8:3-8:45 8:45-9: TOTALS PM 2:3-2:45 2:45-3: 3: - 3:5 6 3:5-3:3 3:3-3:45 3:45-4: 4: - 4:5 4:5-4:3 4:3-4:45 2 4:45-5: 4 5: - 5:5 5:5-5:3 5:3-5:45 5:45-6: 6: - 6:5 6:5-6:3 TOTALS EAST LEG WEST LEG MD 32 WB Off Ramp MD 32 WB ON Ramp Pedestrians Bicycles Pedestrians Bicycles 4 3

71 4
72 TOTALS TURNING MOVEMENT COUNT - SUMMARY Counted by: VCU Intersection of: MD 8 Date: April 26, 27 Wednesday and: Linden Lithincum Lane Weather: Cool, Light Rain Location: Howard County, Maryland Entered by: BGJ Star Rating: 4 TRAFFIC FROM NORTH TRAFFIC FROM SOUTH TRAFFIC FROM EAST TRAFFIC FROM WEST TOTAL on: MD 8 on: MD 8 on: Linden Lithincum Lane on: Freestate Gas Station N + S TIME + RIGHT THRU LEFT U-TN TOTAL RIGHT THRU LEFT U-TN TOTAL RIGHT THRU LEFT U-TN TOTAL RIGHT THRU LEFT U-TN TOTAL E + W AM 6:3-6: :45-7: : - 7: :5-7: :3-7: :45-8: : - 8: :5-8: :3-8: :45-9: : - 9: :5-9: :3-9: :45 - : : - : :5 - : :3 - : :45 - : : - : :5 - : :3 - : :45-2: : - 2: :5-2: :3-2: :45 - : : - : :5 - : :3 - : :45-2: : - 2: :5-2: :3-2: :45-3: : - 3: :5-3: :3-3: :45-4: : - 4: :5-4: :3-4: :45-5: : - 5: :5-5: :3-5: :45-6: : - 6: :5-6: :3-6: :45-7: Hr Totals
73 TOTALS TURNING MOVEMENT COUNT - SUMMARY Counted by: VCU Intersection of: MD 8 Date: April 26, 27 Wednesday and: Linden Lithincum Lane Weather: Cool, Light Rain Location: Howard County, Maryland Entered by: BGJ Star Rating: 4 TRAFFIC FROM NORTH TRAFFIC FROM SOUTH TRAFFIC FROM EAST TRAFFIC FROM WEST TOTAL on: MD 8 on: MD 8 on: Linden Lithincum Lane on: Freestate Gas Station N + S TIME + RIGHT THRU LEFT U-TN TOTAL RIGHT THRU LEFT U-TN TOTAL RIGHT THRU LEFT U-TN TOTAL RIGHT THRU LEFT U-TN TOTAL E + W Hr Totals 6:3-7: :45-7: : - 8: :5-8: :3-8: :45-8: : - 9: :5-9: :3-9: :45-9: : - : :5 - : :3 - : :45 - : : - : :5 - : :3 - : :45 - : : - 2: :5-2: :3-2: :45-2: : - : :5 - : :3 - : :45 - : : - 2: :5-2: :3-2: :45-2: : - 3: :5-3: :3-3: :45-3: : - 4: :5-4: :3-4: :45-4: : - 5: :5-5: :3-5: :45-5: : - 6: :5-6: :3-6: :45-6: : - 7: PEAK HOUR 7: - 8: : - 6:
74 PEDESTRIAN AND BICYCLE OBSERVATIONS - SUMMARY TIME AM Counted by: VCU Intersection of: MD 8 Date: April 26, 27 Wednesday and: Linden Lithincum Lane Weather: Cool, Light Rain Location: Howard County, Maryland Entered by: BGJ Star Rating: 4 NORTH LEG SOUTH LEG MD 8 MD 8 Pedestrians Bicycles Pedestrians Bicycles 6:3-6:45 6:45-7: 7: - 7:5 7:5-7:3 7:3-7:45 7:45-8: 8: - 8:5 8:5-8:3 8:3-8:45 8:45-9: 9: - 9:5 9:5-9:3 9:3-9:45 9:45 - : : - :5 :5 - :3 :3 - :45 :45 - : : - :5 :5 - :3 :3 - :45 :45-2: 2: - 2:5 2:5-2:3 2:3-2:45 2:45 - : : - :5 :5 - :3 :3 - :45 :45-2: 2: - 2:5 2:5-2:3 2:3-2:45 2:45-3: 3: - 3:5 3:5-3:3 3:3-3:45 3:45-4: 4: - 4:5 4:5-4:3 4:3-4:45 4:45-5: 5: - 5:5 5:5-5:3 5:3-5:45 5:45-6: 6: - 6:5 6:5-6:3 6:3-6:45 6:45-7: TOTALS 2 7
75 PEDESTRIAN AND BICYCLE OBSERVATIONS - SUMMARY AM Counted by: VCU Intersection of: MD 8 Date: April 26, 27 Wednesday and: Linden Lithincum Lane Weather: Cool, Light Rain Location: Howard County, Maryland Entered by: BGJ Star Rating: 4 EAST LEG WEST LEG Linden Lithincum Lane Freestate Gas Station Pedestrians Bicycles Pedestrians Bicycles 6:3-6:45 6:45-7: 7: - 7:5 7:5-7:3 7:3-7:45 7:45-8: 8: - 8:5 8:5-8:3 8:3-8:45 8:45-9: 9: - 9:5 9:5-9:3 9:3-9:45 9:45 - : : - :5 :5 - :3 :3 - :45 :45 - : : - :5 :5 - :3 :3 - :45 :45-2: 2: - 2:5 2:5-2:3 2:3-2:45 2:45 - : : - :5 :5 - :3 :3 - :45 :45-2: 2: - 2:5 2:5-2:3 2:3-2:45 2:45-3: 3: - 3:5 3:5-3:3 3:3-3:45 3:45-4: 4: - 4:5 4:5-4:3 4:3-4:45 4:45-5: 5: - 5:5 5:5-5:3 5:3-5:45 5:45-6: 6: - 6:5 6:5-6:3 6:3-6:45 6:45-7: TOTALS 8

76 9
77 APPENDIX C Intersection Capacity Analysis Worksheets CLV Worksheets
78 CRITICAL LANE VOLUME (CLV) METHODOLOGY for MSHA E/W Road Name: Sheppard Lane Date of Count: 4/26/27 N/S Road Name: MD 8 Day of Count: Wednesday Conditions: Existing Traffic Analyst: Richard Huang rh, 732\initial\clv\.xls-clv, f5/23/7 MD 8 AM Peak: 7: -8: PM Peak: 5: -6: PM 4 53 AM R T SHEPPARD LANE R T PM AM L 6 42 R LR L T L T AM PM Capacity Analysis Morning Peak Hour MD 8 Evening Peak Hour Thru Volumes + Opposing Lefts AM Thru Volumes + Opposing Lefts PM Dir VOL x LUF = Total VOL x LUF = Total CLV Dir VOL x LUF = Total VOL x LUF = Total CLV EB EB NB NB SB SB CLV TOTAL=,28 CLV TOTAL=,234 Level of Service (LOS )= C Level of Service (LOS )= C Scenario ID - EXIST CLV V/C =.76 CLV V/C =.77
79 CRITICAL LANE VOLUME (CLV) METHODOLOGY for MSHA E/W Road: Garden Center Access/Sheppard Lane Date of Count: 4/26/27 N/S Road: MD 8 Day of Week: Wednesday Conditions: 223 Background Traffic Analyst: Richard Huang rh, 732\rev\clv\imp.xls-clv, f7/3/7 MD 8 Peak: 7: -8: Peak: 5: -6: PM AM 2 R T L adjusted lefts R LT SHEPPARD LANE LTR R 6 2 T 3 L 67 8 AM PM PM AM L 4 4 T R LTR GARDEN CENTER ACCESS L TR L T R AM PM MD 8 Capacity Analysis - East/West Split Morning Peak Hour Evening Peak Hour Thru Volumes + Opposing Lefts AM Thru Volumes + Opposing Lefts PM Dir VOL x LUF = Total VOL x LUF = Total CLV Dir VOL x LUF = Total VOL x LUF = Total CLV EB EB WB WB NB NB SB SB CLV TOTAL=,69 CLV TOTAL=,77 Level of Service (LOS )= F Level of Service (LOS )= F Scenario ID - BACK AM V/C =. PM V/C =.7 2
80 CRITICAL LANE VOLUME (CLV) METHODOLOGY for MSHA E/W Road: Garden Center Access/Sheppard Lane Date of Count: 4/26/27 N/S Road: MD 8 Day of Week: Wednesday Conditions: 223 Total Traffic Analyst: Richard Huang rh, 732\rev\clv\imp.xls-clv, f7/3/7 MD 8 Peak: 7: -8: Peak: 5: -6: PM AM 2 R T L adjusted lefts R LT SHEPPARD LANE LTR R 6 2 T 3 L 67 8 AM PM PM AM L 4 4 T R LTR GARDEN CENTER ACCESS L TR L T R AM PM MD 8 Capacity Analysis - East/West Split Morning Peak Hour Evening Peak Hour Thru Volumes + Opposing Lefts AM Thru Volumes + Opposing Lefts PM Dir VOL x LUF = Total VOL x LUF = Total CLV Dir VOL x LUF = Total VOL x LUF = Total CLV EB EB WB WB NB NB SB SB CLV TOTAL=,662 CLV TOTAL=,756 Level of Service (LOS )= F Level of Service (LOS )= F Scenario ID - TOT AM V/C =.4 PM V/C =. 3
81 CRITICAL LANE VOLUME (CLV) METHODOLOGY for MSHA E/W Road: Garden Center Access/Sheppard Lane Date of Count: 4/26/27 N/S Road: MD 8 Day of Week: Wednesday Conditions: 237 Background Traffic Analyst: Richard Huang rh, 732\rev\clv\imp.xls-clv, f7/3/7 MD 8 Peak: 7: -8: Peak: 5: -6: PM AM 2 R T L adjusted lefts R LT SHEPPARD LANE LTR R 6 2 T 3 L 67 8 AM PM PM AM 4 2 L 4 4 T 44 2 R LTR GARDEN CENTER ACCESS L TR L T R AM PM MD 8 Capacity Analysis - East/West Split Morning Peak Hour Evening Peak Hour Thru Volumes + Opposing Lefts AM Thru Volumes + Opposing Lefts PM Dir VOL x LUF = Total VOL x LUF = Total CLV Dir VOL x LUF = Total VOL x LUF = Total CLV EB EB WB WB NB NB SB SB CLV TOTAL= 3,368 CLV TOTAL= 3,449 Level of Service (LOS )= F Level of Service (LOS )= F Scenario ID - BACK2 AM V/C =2. PM V/C =2.6 4
82 CRITICAL LANE VOLUME (CLV) METHODOLOGY for MSHA E/W Road: Garden Center Access/Sheppard Lane Date of Count: 4/26/27 N/S Road: MD 8 Day of Week: Wednesday Conditions: 237 Total Traffic Analyst: Richard Huang rh, 732\rev\clv\imp.xls-clv, f7/3/7 MD 8 Peak: 7: -8: Peak: 5: -6: PM AM 2 R T L adjusted lefts R LT SHEPPARD LANE LTR R 6 2 T 3 L 67 8 AM PM PM AM 4 2 L 4 4 T R LTR GARDEN CENTER ACCESS L TR L T R AM PM MD 8 Capacity Analysis - East/West Split Morning Peak Hour Evening Peak Hour Thru Volumes + Opposing Lefts AM Thru Volumes + Opposing Lefts PM Dir VOL x LUF = Total VOL x LUF = Total CLV Dir VOL x LUF = Total VOL x LUF = Total CLV EB EB WB WB NB NB SB SB CLV TOTAL= 3,42 CLV TOTAL= 3,498 Level of Service (LOS )= F Level of Service (LOS )= F Scenario ID - TOT2 AM V/C =2.4 PM V/C =2.9 5
83 CRITICAL LANE VOLUME (CLV) METHODOLOGY for MSHA E/W Road: Sheppard Lane/Garden Center Date of Count: 4/26/27 N/S Road: MD 8 Day of Week: Wednesday Conditions: 223 Total Traffic Analyst: Richard Huang w/imp rh, 732\initial\clv\imp.xls-clv, f7/26/7 MD 8 Peak: 7: -8: Peak: 5: -6: PM AM R T L R T T L SHEPPARD LANE LTR R 6 2 T 3 L 67 8 AM PM PM AM L 4 4 T LT R R GARDEN CENTER ACCESS L T R L T R AM PM MD 8 Capacity Analysis - East/West Split Morning Peak Hour Evening Peak Hour Thru Volumes + Opposing Lefts AM Thru Volumes + Opposing Lefts PM Dir VOL x LUF = Total VOL x LUF = Total CLV Dir VOL x LUF = Total VOL x LUF = Total CLV EB EB WB WB NB NB SB SB CLV TOTAL=,86 CLV TOTAL=,6 Level of Service (LOS )= B Level of Service (LOS )= C AM V/C =.68 PM V/C =.73 6
84 CRITICAL LANE VOLUME (CLV) METHODOLOGY for MSHA E/W Road: Sheppard Lane/Garden Center Date of Count: 4/26/27 N/S Road: MD 8 Day of Week: Wednesday Conditions: 237 Total Traffic Analyst: Richard Huang w/imp rh, 732\initial\clv\imp.xls-clv, f7/26/7 MD 8 Peak: 7: -8: Peak: 5: -6: PM AM R T L R T T L SHEPPARD LANE LTR R 6 2 T 3 L 67 8 AM PM PM AM 4 2 L 4 4 T LT R R GARDEN CENTER ACCESS L T R L T R AM PM MD 8 Capacity Analysis - East/West Split Morning Peak Hour Evening Peak Hour Thru Volumes + Opposing Lefts AM Thru Volumes + Opposing Lefts PM Dir VOL x LUF = Total VOL x LUF = Total CLV Dir VOL x LUF = Total VOL x LUF = Total CLV EB EB WB WB NB NB SB SB CLV TOTAL= 2,94 CLV TOTAL= 2,265 Level of Service (LOS )= F Level of Service (LOS )= F AM V/C =.37 PM V/C =.42 7
85 CRITICAL LANE VOLUME (CLV) METHODOLOGY for MSHA E/W Road: Great Star Drive/Kendall Hardware Store Date of Count: 4/26/27 N/S Road: MD 8 Day of Week: Wednesday Conditions: Existing Traffic Analyst: Richard Huang rh, 732\rev\clv\2.xls-clv, f7/3/7 MD 8 Peak: 7: -8: Peak: 5: -6: PM AM R T L TR T L KENDALL HARDWARE STORE R R LT T 8 L L AM PM PM AM 3 5 L 5 2 T 24 7 R LTR GREAT STAR DRIVE L T TR L T R AM PM MD 8 Capacity Analysis - East/West Split Morning Peak Hour Evening Peak Hour Thru Volumes + Opposing Lefts AM Thru Volumes + Opposing Lefts PM Dir VOL x LUF = Total VOL x LUF = Total CLV Dir VOL x LUF = Total VOL x LUF = Total CLV EB EB WB WB NB NB SB SB CLV TOTAL= 79 CLV TOTAL=,7 Level of Service (LOS )= A Level of Service (LOS )= C Scenario ID - EXIST2 AM V/C =.45 PM V/C =.73 8
86 CRITICAL LANE VOLUME (CLV) METHODOLOGY for MSHA E/W Road: Great Star Drive/Kendall Hardware Store Date of Count: 4/26/27 N/S Road: MD 8 Day of Week: Wednesday Conditions: 223 Background Traffic Analyst: Richard Huang rh, 732\rev\clv\2.xls-clv, f7/3/7 MD 8 Peak: 7: -8: Peak: 5: -6: PM AM R T L TR T L KENDALL HARDWARE STORE R R LT T 2 2 L L AM PM PM AM 34 5 L 6 2 T 26 8 R LTR GREAT STAR DRIVE L T TR L T R AM PM MD 8 Capacity Analysis - East/West Split Morning Peak Hour Evening Peak Hour Thru Volumes + Opposing Lefts AM Thru Volumes + Opposing Lefts PM Dir VOL x LUF = Total VOL x LUF = Total CLV Dir VOL x LUF = Total VOL x LUF = Total CLV EB EB WB WB NB NB SB SB CLV TOTAL= 874 CLV TOTAL=,399 Level of Service (LOS )= A Level of Service (LOS )= D Scenario ID - BACK2 AM V/C =.55 PM V/C =.87 9
87 CRITICAL LANE VOLUME (CLV) METHODOLOGY for MSHA E/W Road: Great Star Drive/Kendall Hardware Store Date of Count: 4/26/27 N/S Road: MD 8 Day of Week: Wednesday Conditions: 223 Total Traffic Analyst: Richard Huang rh, 732\rev\clv\2.xls-clv, f7/3/7 MD 8 Peak: 7: -8: Peak: 5: -6: PM AM R T L TR T L KENDALL HARDWARE STORE R R LT T 2 2 L L AM PM PM AM 34 5 L 6 2 T 26 8 R LTR GREAT STAR DRIVE L T TR L T R AM PM MD 8 Capacity Analysis - East/West Split Morning Peak Hour Evening Peak Hour Thru Volumes + Opposing Lefts AM Thru Volumes + Opposing Lefts PM Dir VOL x LUF = Total VOL x LUF = Total CLV Dir VOL x LUF = Total VOL x LUF = Total CLV EB EB WB WB NB NB SB SB CLV TOTAL= 92 CLV TOTAL=,434 Level of Service (LOS )= A Level of Service (LOS )= D Scenario ID - TOT2 AM V/C =.58 PM V/C =.9
88 CRITICAL LANE VOLUME (CLV) METHODOLOGY for MSHA E/W Road: Great Star Drive/Kendall Hardware Store Date of Count: 4/26/27 N/S Road: MD 8 Day of Week: Wednesday Conditions: 237 Background Traffic Analyst: Richard Huang rh, 732\rev\clv\2.xls-clv, f7/3/7 MD 8 Peak: 7: -8: Peak: 5: -6: PM AM R T L TR T L KENDALL HARDWARE STORE R R LT T L L AM PM PM AM 77 L 36 5 T 59 8 R LTR GREAT STAR DRIVE L T TR L T R AM PM MD 8 Capacity Analysis - East/West Split Morning Peak Hour Evening Peak Hour Thru Volumes + Opposing Lefts AM Thru Volumes + Opposing Lefts PM Dir VOL x LUF = Total VOL x LUF = Total CLV Dir VOL x LUF = Total VOL x LUF = Total CLV EB EB WB WB NB NB SB SB CLV TOTAL=,865 CLV TOTAL= 3,3 Level of Service (LOS )= F Level of Service (LOS )= F Scenario ID - BACK22 AM V/C =.7 PM V/C =.88
89 CRITICAL LANE VOLUME (CLV) METHODOLOGY for MSHA E/W Road: Great Star Drive/Kendall Hardware Store Date of Count: 4/26/27 N/S Road: MD 8 Day of Week: Wednesday Conditions: 237 Total Traffic Analyst: Richard Huang rh, 732\rev\clv\2.xls-clv, f7/3/7 MD 8 Peak: 7: -8: Peak: 5: -6: PM AM R T L TR T L KENDALL HARDWARE STORE R R LT T L L AM PM PM AM 77 L 36 5 T 59 8 R LTR GREAT STAR DRIVE L T TR L T R AM PM MD 8 Capacity Analysis - East/West Split Morning Peak Hour Evening Peak Hour Thru Volumes + Opposing Lefts AM Thru Volumes + Opposing Lefts PM Dir VOL x LUF = Total VOL x LUF = Total CLV Dir VOL x LUF = Total VOL x LUF = Total CLV EB EB WB WB NB NB SB SB CLV TOTAL=,92 CLV TOTAL= 3,48 Level of Service (LOS )= F Level of Service (LOS )= F Scenario ID - TOT22 AM V/C =.2 PM V/C =.9 2
90 CRITICAL LANE VOLUME (CLV) METHODOLOGY for MSHA E/W Road: Great Star Drive/Kendall Hardware Store Date of Count: 4/26/27 N/S Road: MD 8 Day of Week: Wednesday Conditions: Adjusted 223 Total Traffic Analyst: Richard Huang rh, 732\rev\clv\2.xls-clv, f7/3/7 MD 8 Peak: 7: -8: Peak: 5: -6: PM AM R T L TR T L KENDALL HARDWARE STORE R R LT T 2 2 L L 3 24 AM PM PM AM 34 5 L 6 2 T 26 8 R LTR GREAT STAR DRIVE L T TR L T R AM PM MD 8 Capacity Analysis - East/West Split Morning Peak Hour Evening Peak Hour Thru Volumes + Opposing Lefts AM Thru Volumes + Opposing Lefts PM Dir VOL x LUF = Total VOL x LUF = Total CLV Dir VOL x LUF = Total VOL x LUF = Total CLV EB EB WB WB NB NB SB SB CLV TOTAL= 898 CLV TOTAL=,434 Level of Service (LOS )= A Level of Service (LOS )= D Scenario ID - TOT32 AM V/C =.56 PM V/C =.9 3
91 CRITICAL LANE VOLUME (CLV) METHODOLOGY for MSHA E/W Road: Signal Bell Lane/Auto Drive Date of Count: 4/26/27 N/S Road: MD 8 Day of Count: Wednesday Conditions: Existing Traffic Analyst: Richard Huang rh, 732\rev\clv\3.xls-clv, f7/3/7 MD 8 Peak: 7:3-8:3 Peak: 5: -6: PM AM R T L TR T L AUTO DRIVE LTR R 3 25 T 5 3 L AM PM 9 2 adjusted lefts adjusted lefts PM AM 99 9 L 7 4 T LT 72 4 R R SIGNAL BELL LANE L T TR L T R AM PM MD 8 Capacity Analysis Morning Peak Hour Evening Peak Hour Thru Volumes + Opposing Lefts AM Thru Volumes + Opposing Lefts PM Dir VOL x LUF = Total VOL x LUF = Total CLV Dir VOL x LUF = Total VOL x LUF = Total CLV NB NB SB SB EB EB WB WB CLV TOTAL= 72 CLV TOTAL= 88 Level of Service (LOS )= A Level of Service (LOS )= A Scenario ID - EXIST3 AM V/C =.45 PM V/C =.5 4
92 CRITICAL LANE VOLUME (CLV) METHODOLOGY for MSHA E/W Road: Signal Bell Lane/Auto Drive Date of Count: 4/26/27 N/S Road: MD 8 Day of Count: Wednesday Conditions: 223 Background Traffic Analyst: Richard Huang rh, 732\rev\clv\3.xls-clv, f7/3/7 MD 8 Peak: 7:3-8:3 Peak: 5: -6: PM AM R T L TR T L AUTO DRIVE LTR R 3 27 T 9 7 L AM PM adjusted lefts adjusted lefts PM AM 7 24 L 24 5 T LT R R SIGNAL BELL LANE L T TR L T R AM PM MD 8 Capacity Analysis Morning Peak Hour Evening Peak Hour Thru Volumes + Opposing Lefts AM Thru Volumes + Opposing Lefts PM Dir VOL x LUF = Total VOL x LUF = Total CLV Dir VOL x LUF = Total VOL x LUF = Total CLV NB NB SB SB EB EB WB WB CLV TOTAL= 878 CLV TOTAL=,47 Level of Service (LOS )= A Level of Service (LOS )= B Scenario ID - BACK3 AM V/C =.55 PM V/C =.65 5
93 CRITICAL LANE VOLUME (CLV) METHODOLOGY for MSHA E/W Road: Signal Bell Lane/Auto Drive Date of Count: 4/26/27 N/S Road: MD 8 Day of Count: Wednesday Conditions: 223 Total Traffic Analyst: Richard Huang rh, 732\rev\clv\3.xls-clv, f7/3/7 MD 8 Peak: 7:3-8:3 Peak: 5: -6: PM AM R T L TR T L AUTO DRIVE LTR R 3 27 T 9 7 L AM PM adjusted lefts adjusted lefts PM AM 7 24 L 24 5 T LT R R SIGNAL BELL LANE L T TR L T R AM PM MD 8 Capacity Analysis Morning Peak Hour Evening Peak Hour Thru Volumes + Opposing Lefts AM Thru Volumes + Opposing Lefts PM Dir VOL x LUF = Total VOL x LUF = Total CLV Dir VOL x LUF = Total VOL x LUF = Total CLV NB NB SB SB EB EB WB WB CLV TOTAL= 94 CLV TOTAL=,82 Level of Service (LOS )= A Level of Service (LOS )= B Scenario ID - TOT3 AM V/C =.57 PM V/C =.68 6
94 CRITICAL LANE VOLUME (CLV) METHODOLOGY for MSHA E/W Road: Signal Bell Lane/Auto Drive Date of Count: 4/26/27 N/S Road: MD 8 Day of Count: Wednesday Conditions: 237 Background Traffic Analyst: Richard Huang rh, 732\rev\clv\3.xls-clv, f7/3/7 MD 8 Peak: 7:3-8:3 Peak: 5: -6: PM AM R T L TR T L AUTO DRIVE LTR R 7 6 T 5 35 L 6 63 AM PM adjusted lefts adjusted lefts PM AM L 48 T LT R R SIGNAL BELL LANE L T TR L T R AM PM MD 8 Capacity Analysis Morning Peak Hour Evening Peak Hour Thru Volumes + Opposing Lefts AM Thru Volumes + Opposing Lefts PM Dir VOL x LUF = Total VOL x LUF = Total CLV Dir VOL x LUF = Total VOL x LUF = Total CLV NB NB SB SB EB EB WB WB CLV TOTAL=,859 CLV TOTAL= 2,24 Level of Service (LOS )= F Level of Service (LOS )= F Scenario ID - BACK23 AM V/C =.6 PM V/C =.4 7
95 CRITICAL LANE VOLUME (CLV) METHODOLOGY for MSHA E/W Road: Signal Bell Lane/Auto Drive Date of Count: 4/26/27 N/S Road: MD 8 Day of Count: Wednesday Conditions: 237 Total Traffic Analyst: Richard Huang rh, 732\rev\clv\3.xls-clv, f7/3/7 MD 8 Peak: 7:3-8:3 Peak: 5: -6: PM AM R T L TR T L AUTO DRIVE LTR R 7 6 T 5 35 L 6 63 AM PM adjusted lefts adjusted lefts PM AM L 48 T LT R R SIGNAL BELL LANE L T TR L T R AM PM MD 8 Capacity Analysis Morning Peak Hour Evening Peak Hour Thru Volumes + Opposing Lefts AM Thru Volumes + Opposing Lefts PM Dir VOL x LUF = Total VOL x LUF = Total CLV Dir VOL x LUF = Total VOL x LUF = Total CLV NB NB SB SB EB EB WB WB CLV TOTAL=,884 CLV TOTAL= 2,276 Level of Service (LOS )= F Level of Service (LOS )= F Scenario ID - TOT23 AM V/C =.8 PM V/C =.42 8
96 CRITICAL LANE VOLUME (CLV) METHODOLOGY for MSHA E/W Road: MD 32 WB Off Ramp/Md 32 Wb On Ramp Date of Count: 4/26/27 N/S Road: MD 8 Day of Week: Wednesday Conditions: Existing Traffic Analyst: Richard Huang rh, 732\rev\clv\4.xls-clv, f7/3/7 MD 8 Peak: 7: -8: Peak: 5: -6: PM AM R T L TR T MD 32 WB ON RAMP R R LT T 42 L L AM PM PM AM L T R MD 32 WB OFF RAMP L T T L T R AM PM MD 8 Capacity Analysis - East/West Split Morning Peak Hour Evening Peak Hour Thru Volumes + Opposing Lefts AM Thru Volumes + Opposing Lefts PM Dir VOL x LUF = Total VOL x LUF = Total CLV Dir VOL x LUF = Total VOL x LUF = Total CLV EB. EB. WB WB NB NB SB SB CLV TOTAL= 78 CLV TOTAL=,24 Level of Service (LOS )= A Level of Service (LOS )= B Scenario ID - EXIST4 AM V/C =.49 PM V/C =.7 9
97 CRITICAL LANE VOLUME (CLV) METHODOLOGY for MSHA E/W Road: MD 32 WB Off Ramp/Md 32 Wb On Ramp Date of Count: 4/26/27 N/S Road: MD 8 Day of Week: Wednesday Conditions: 223 Background Traffic Analyst: Richard Huang rh, 732\rev\clv\4.xls-clv, f7/3/7 MD 8 Peak: 7: -8: Peak: 5: -6: PM 2 93 AM R T L TR T MD 32 WB ON RAMP R R LT T 46 L L AM PM PM AM L T R MD 32 WB OFF RAMP L T T L T R AM PM MD 8 Capacity Analysis - East/West Split Morning Peak Hour Evening Peak Hour Thru Volumes + Opposing Lefts AM Thru Volumes + Opposing Lefts PM Dir VOL x LUF = Total VOL x LUF = Total CLV Dir VOL x LUF = Total VOL x LUF = Total CLV EB. EB. WB WB NB NB SB SB CLV TOTAL= 988 CLV TOTAL=,362 Level of Service (LOS )= A Level of Service (LOS )= D Scenario ID - BACK4 AM V/C =.62 PM V/C =.85 2
98 CRITICAL LANE VOLUME (CLV) METHODOLOGY for MSHA E/W Road: MD 32 WB Off Ramp/Md 32 Wb On Ramp Date of Count: 4/26/27 N/S Road: MD 8 Day of Week: Wednesday Conditions: 223 Total Traffic Analyst: Richard Huang rh, 732\rev\clv\4.xls-clv, f7/3/7 MD 8 Peak: 7: -8: Peak: 5: -6: PM AM R T L TR T MD 32 WB ON RAMP R R LT T 46 L L AM PM PM AM L T R MD 32 WB OFF RAMP L T T L T R AM PM MD 8 Capacity Analysis - East/West Split Morning Peak Hour Evening Peak Hour Thru Volumes + Opposing Lefts AM Thru Volumes + Opposing Lefts PM Dir VOL x LUF = Total VOL x LUF = Total CLV Dir VOL x LUF = Total VOL x LUF = Total CLV EB. EB. WB WB NB NB SB SB CLV TOTAL=,52 CLV TOTAL=,44 Level of Service (LOS )= B Level of Service (LOS )= D Scenario ID - TOT4 AM V/C =.66 PM V/C =.88 2
99 CRITICAL LANE VOLUME (CLV) METHODOLOGY for MSHA E/W Road: MD 32 WB Off Ramp/Md 32 Wb On Ramp Date of Count: 4/26/27 N/S Road: MD 8 Day of Week: Wednesday Conditions: 237 Background Traffic Analyst: Richard Huang rh, 732\rev\clv\4.xls-clv, f7/3/7 MD 8 Peak: 7: -8: Peak: 5: -6: PM AM R T L TR T MD 32 WB ON RAMP R R LT T 4 L L AM PM PM AM L T R MD 32 WB OFF RAMP L T T L T R AM PM MD 8 Capacity Analysis - East/West Split Morning Peak Hour Evening Peak Hour Thru Volumes + Opposing Lefts AM Thru Volumes + Opposing Lefts PM Dir VOL x LUF = Total VOL x LUF = Total CLV Dir VOL x LUF = Total VOL x LUF = Total CLV EB. EB. WB WB NB NB SB SB CLV TOTAL= 2,65 CLV TOTAL= 2,92 Level of Service (LOS )= F Level of Service (LOS )= F Scenario ID - BACK24 AM V/C =.29 PM V/C =.82 22
100 CRITICAL LANE VOLUME (CLV) METHODOLOGY for MSHA E/W Road: MD 32 WB Off Ramp/Md 32 Wb On Ramp Date of Count: 4/26/27 N/S Road: MD 8 Day of Week: Wednesday Conditions: 237 Total Traffic Analyst: Richard Huang rh, 732\rev\clv\4.xls-clv, f7/3/7 MD 8 Peak: 7: -8: Peak: 5: -6: PM AM R T L TR T MD 32 WB ON RAMP R R 82 8 LT T 4 L L AM PM PM AM L T R MD 32 WB OFF RAMP L T T L T R AM PM MD 8 Capacity Analysis - East/West Split Morning Peak Hour Evening Peak Hour Thru Volumes + Opposing Lefts AM Thru Volumes + Opposing Lefts PM Dir VOL x LUF = Total VOL x LUF = Total CLV Dir VOL x LUF = Total VOL x LUF = Total CLV EB. EB. WB WB NB NB SB SB CLV TOTAL= 2,29 CLV TOTAL= 2,965 Level of Service (LOS )= F Level of Service (LOS )= F Scenario ID - TOT24 AM V/C =.33 PM V/C =.85 23
101 CRITICAL LANE VOLUME (CLV) METHODOLOGY for MSHA E/W Road: Linden Lithincum Lane/Freestate Gas Station Date of Count: 4/26/27 N/S Road: MD 8 Day of Count: Wednesday Conditions: Existing Traffic Analyst: Richard Huang rh, 732\rev\clv\6.xls-clv, f7/3/7 MD 8 Peak: 7: -8: Peak: 5: -6: PM AM R T L TR T L FREESTATE GAS STATION R R 25 LT T L AM PM 7 adjusted lefts adjusted lefts PM AM 5 L T R LTR LINDEN LITHINCUM LANE L T R L T R AM PM MD 8 Capacity Analysis Morning Peak Hour Evening Peak Hour Thru Volumes + Opposing Lefts AM Thru Volumes + Opposing Lefts PM Dir VOL x LUF = Total VOL x LUF = Total CLV Dir VOL x LUF = Total VOL x LUF = Total CLV NB NB SB SB EB EB WB WB CLV TOTAL= 773 CLV TOTAL=,3 Level of Service (LOS )= A Level of Service (LOS )= C Scenario ID - EXIST6 AM V/C =.48 PM V/C =.8 24
102 CRITICAL LANE VOLUME (CLV) METHODOLOGY for MSHA E/W Road: Linden Lithincum Lane/Freestate Gas Station Date of Count: 4/26/27 N/S Road: MD 8 Day of Count: Wednesday Conditions: 223 Background Traffic Analyst: Richard Huang rh, 732\rev\clv\6.xls-clv, f7/3/7 MD 8 Peak: 7: -8: Peak: 5: -6: PM 73 5 AM R T L TR T L FREESTATE GAS STATION R R 9 37 LT T L AM PM 8 2 adjusted lefts adjusted lefts 28 3 PM AM 6 L T 5 36 R LTR LINDEN LITHINCUM LANE L T R L T R AM PM MD 8 Capacity Analysis Morning Peak Hour Evening Peak Hour Thru Volumes + Opposing Lefts AM Thru Volumes + Opposing Lefts PM Dir VOL x LUF = Total VOL x LUF = Total CLV Dir VOL x LUF = Total VOL x LUF = Total CLV NB NB SB SB EB EB WB WB CLV TOTAL= 958 CLV TOTAL=,563 Level of Service (LOS )= A Level of Service (LOS )= E Scenario ID - BACK6 AM V/C =.6 PM V/C =.98 25
103 CRITICAL LANE VOLUME (CLV) METHODOLOGY for MSHA E/W Road: Linden Lithincum Lane/Freestate Gas Station Date of Count: 4/26/27 N/S Road: MD 8 Day of Count: Wednesday Conditions: 237 Background Traffic Analyst: Richard Huang rh, 732\rev\clv\6.xls-clv, f7/3/7 MD 8 Peak: 7: -8: Peak: 5: -6: PM AM R T L TR T L FREESTATE GAS STATION R R LT T 2 L AM PM 72 5 adjusted lefts adjusted lefts PM AM L 2 2 T 5 8 R LTR LINDEN LITHINCUM LANE L T R L T R AM PM MD 8 Capacity Analysis Morning Peak Hour Evening Peak Hour Thru Volumes + Opposing Lefts AM Thru Volumes + Opposing Lefts PM Dir VOL x LUF = Total VOL x LUF = Total CLV Dir VOL x LUF = Total VOL x LUF = Total CLV NB NB SB SB EB EB WB WB CLV TOTAL= 2,45 CLV TOTAL= 3,383 Level of Service (LOS )= F Level of Service (LOS )= F Scenario ID - BACK26 AM V/C =.28 PM V/C =2. 26
104 CRITICAL LANE VOLUME (CLV) METHODOLOGY for MSHA E/W Road: Linden Lithincum Lane Date of Count: 4/26/27 N/S Road: MD 8 Day of Count: Wednesday Conditions: 223 Total Traffic Analyst: Richard Huang rh, 732\rev\clv\6.xls-clv, f7/3/7 MD 8 Peak: 7: -8: Peak: 5: -6: PM AM R T L TR T L FREESTATE GAS STATION R R 9 37 LT T L AM PM 75 4 adjusted lefts adjusted lefts 28 3 PM AM L T 7 68 R LTR LINDEN LITHINCUM LANE L T R L T R AM PM MD 8 Capacity Analysis Morning Peak Hour Evening Peak Hour Thru Volumes + Opposing Lefts AM Thru Volumes + Opposing Lefts PM Dir VOL x LUF = Total VOL x LUF = Total CLV Dir VOL x LUF = Total VOL x LUF = Total CLV NB NB SB SB EB EB WB WB CLV TOTAL=,44 CLV TOTAL=,75 Level of Service (LOS )= B Level of Service (LOS )= F AM V/C =.65 PM V/C =.7 27
105 CRITICAL LANE VOLUME (CLV) METHODOLOGY for MSHA E/W Road: Linden Lithincum Lane Date of Count: 4/26/27 N/S Road: MD 8 Day of Count: Wednesday Conditions: 237 Total Traffic Analyst: Richard Huang rh, 732\rev\clv\6.xls-clv, f7/3/7 MD 8 Peak: 7: -8: Peak: 5: -6: PM AM R T L TR T L FREESTATE GAS STATION R R LT T 2 L AM PM 76 adjusted lefts adjusted lefts PM AM 88 5 L 2 2 T 8 3 R LTR LINDEN LITHINCUM LANE L T R L T R AM PM MD 8 Capacity Analysis Morning Peak Hour Evening Peak Hour Thru Volumes + Opposing Lefts AM Thru Volumes + Opposing Lefts PM Dir VOL x LUF = Total VOL x LUF = Total CLV Dir VOL x LUF = Total VOL x LUF = Total CLV NB NB SB SB EB EB WB WB CLV TOTAL= 2,53 CLV TOTAL= 3,572 Level of Service (LOS )= F Level of Service (LOS )= F AM V/C =.35 PM V/C =
106 CRITICAL LANE VOLUME (CLV) METHODOLOGY for MSHA E/W Road: Linden Lithincum Lane Date of Count: 4/26/27 N/S Road: MD 8 Day of Count: Wednesday Conditions: Adjusted 223 Total Traffic Analyst: Richard Huang rh, 732\rev\clv\6.xls-clv, f7/3/7 MD 8 Peak: 7: -8: Peak: 5: -6: PM AM R T L TR T L FREESTATE GAS STATION R R 9 37 LT T L AM PM 6 53 adjusted lefts adjusted lefts 69 3 PM AM L T 7 68 R LTR LINDEN LITHINCUM LANE L T R L T R AM PM MD 8 Capacity Analysis Morning Peak Hour Evening Peak Hour Thru Volumes + Opposing Lefts AM Thru Volumes + Opposing Lefts PM Dir VOL x LUF = Total VOL x LUF = Total CLV Dir VOL x LUF = Total VOL x LUF = Total CLV NB NB SB SB EB EB WB WB CLV TOTAL=,95 CLV TOTAL=,736 Level of Service (LOS )= B Level of Service (LOS )= F AM V/C =.68 PM V/C =.9 29
107 CRITICAL LANE VOLUME (CLV) METHODOLOGY for MSHA E/W Road: Linden Lithincum Lane Date of Count: 4/26/27 N/S Road: MD 8 Day of Count: Wednesday Conditions: 237 Total Traffic Analyst: Richard Huang w/imp rh, 732\rev\clv\6.xls-imp2, f7/4/7 MD 8 Peak: 7: -8: Peak: 5: -6: PM AM R T L TR T L LINDEN LITHINCUM LANE R R LT T 2 L AM PM adjusted lefts PM AM 88 5 L 2 2 T L 8 3 R TR LINDEN LITHINCUM LANE L T TR L T R AM PM Capacity Analysis Morning Peak Hour MD 8 Evening Peak Hour Thru Volumes + Opposing Lefts AM Thru Volumes + Opposing Lefts PM Dir VOL x LUF = Total VOL x LUF = Total CLV Dir VOL x LUF = Total VOL x LUF = Total CLV NB NB SB SB EB EB WB WB CLV TOTAL=,553 CLV TOTAL= 2,8 Level of Service (LOS )= E Level of Service (LOS )= F AM V/C =.97 PM V/C =.36 3
108 CRITICAL LANE VOLUME (CLV) METHODOLOGY for MSHA E/W Road: Linden Lithincum Lane Date of Count: 4/26/27 N/S Road: MD 8 Day of Count: Wednesday Conditions: 223 Total Traffic Analyst: Richard Huang w/imp rh, 732\rev\clv\6.xls-imp2, f7/4/7 MD 8 Peak: 7: -8: Peak: 5: -6: PM AM R T L TR T L LINDEN LITHINCUM LANE R R 9 37 LT T L AM PM adjusted lefts 69 6 PM AM L T L 7 68 R TR LINDEN LITHINCUM LANE L T TR L T R AM PM Capacity Analysis Morning Peak Hour MD 8 Evening Peak Hour Thru Volumes + Opposing Lefts AM Thru Volumes + Opposing Lefts PM Dir VOL x LUF = Total VOL x LUF = Total CLV Dir VOL x LUF = Total VOL x LUF = Total CLV NB NB SB SB EB EB WB WB CLV TOTAL= 89 CLV TOTAL=,9 Level of Service (LOS )= A Level of Service (LOS )= B AM V/C =.5 PM V/C =.7 3
109 CRITICAL LANE VOLUME (CLV) METHODOLOGY for MSHA E/W Road: Garden Center/Site Access Date of Count: N/S Road: MD 8 Day of Count: Conditions: 223 Total Traffic Analyst: Richard Huang rh, 732\rev\clv\7.xls-clv, f7/26/7 MD PM AM R T L R T T SITE ACCESS R R 7 2 T L AM PM PM AM L T 29 4 R FR L T T R GARDEN CENTER L T R AM PM MD 8 Capacity Analysis Morning Peak Hour Evening Peak Hour Thru Volumes + Opposing Lefts AM Thru Volumes + Opposing Lefts PM Dir VOL x LUF = Total VOL x LUF = Total CLV Dir VOL x LUF = Total VOL x LUF = Total CLV NB NB SB SB EB.. EB WB WB CLV TOTAL= 685 CLV TOTAL= 858 Level of Service (LOS )= A Level of Service (LOS )= A AM V/C =.43 PM V/C =.54 32
110 CRITICAL LANE VOLUME (CLV) METHODOLOGY for MSHA E/W Road: Garden Center/Site Access Date of Count: N/S Road: MD 8 Day of Count: Conditions: 237 Total Traffic Analyst: Richard Huang rh, 732\rev\clv\7.xls-clv, f7/26/7 MD PM AM R T L R T T SITE ACCESS R R 7 2 T L AM PM PM AM L T 29 4 R FR L T T R GARDEN CENTER L T R AM PM MD 8 Capacity Analysis Morning Peak Hour Evening Peak Hour Thru Volumes + Opposing Lefts AM Thru Volumes + Opposing Lefts PM Dir VOL x LUF = Total VOL x LUF = Total CLV Dir VOL x LUF = Total VOL x LUF = Total CLV NB NB SB SB EB.. EB WB WB CLV TOTAL=,4 CLV TOTAL=,85 Level of Service (LOS )= D Level of Service (LOS )= F AM V/C =.88 PM V/C =.3 33

111 APPENDIX D Trip Assignment for Background Developments

112 TRAFFIC GROWTH PROJECTION Average Growth: -.7% Mathematical Growth: -.9% Year ADT Volume Vol. increase % increase Average % 26 2, ,272.%.% 28 9, % -.5% 29 9, % -.65% 2 9,99 2.6% -.33% 2 9, % -.27% 22 9, % -.87% 23 9,26 4.2% -.7% 24 9, % -.66% 25 9, % -.3% 26 2, % -.7% 2, 2,5 ADT Volumes 2, 9,5 9, 8,5 8, Year EXHIBIT D- TRAFFIC GROWTH PROJECTION MD 8 N. of MD 32 rh, 732\initial\adt.xls-md 8, f7/4/7
113 2
114 3
115 4
116 5
117 6
118 APPENDIX E Synchro & SimTraffic
119 SimTraffic Simulation Summary MD 8 Summary of All Intervals SimTraffic Report Existing AM Run Number Start Time 6:5 6:5 6:5 6:5 6:5 6:5 6:5 End Time 8: 8: 8: 8: 8: 8: 8: Total Time (min) Time Recorded (min) # of Intervals # of Recorded Intervals Vehs Entered Vehs Exited Starting Vehs Ending Vehs Travel Distance (mi) Travel Time (hr) Total Delay (hr) Total Stops Fuel Used (gal) Summary of All Intervals Run Number Avg Start Time 6:5 6:5 6:5 6:5 End Time 8: 8: 8: 8: Total Time (min) Time Recorded (min) # of Intervals # of Recorded Intervals Vehs Entered Vehs Exited Starting Vehs Ending Vehs Travel Distance (mi) Travel Time (hr) Total Delay (hr) Total Stops Fuel Used (gal) Interval # Information Seeding Start Time 6:5 End Time 7: Total Time (min) Volumes adjusted by Growth Factors. No data recorded this interval. SWA 7/7/27 Page
120 Queuing and Blocking Report MD 8 Intersection: : MD 8 & Sheppard Lane SimTraffic Report Existing AM Movement EB NB NB SB SB Directions Served LR L T T R Maximum Queue (ft) Average Queue (ft) th Queue (ft) Link Distance (ft) Upstream Blk Time (%) 2 Queuing Penalty (veh) 5 Storage Bay Dist (ft) Storage Blk Time (%) 4 5 Queuing Penalty (veh) Intersection: 2: MD 8 & Hardware Store/Great Star Drive Movement EB WB WB WB NB NB NB SB SB SB Directions Served LTR L LT R L T TR L T TR Maximum Queue (ft) Average Queue (ft) th Queue (ft) Link Distance (ft) Upstream Blk Time (%) Queuing Penalty (veh) Storage Bay Dist (ft) Storage Blk Time (%) 2 Queuing Penalty (veh) Intersection: 3: MD 8 & Auto Dr./Signal Bell Ln Movement EB EB WB NB NB NB SB SB SB Directions Served LT R LTR L T TR L T TR Maximum Queue (ft) Average Queue (ft) th Queue (ft) Link Distance (ft) Upstream Blk Time (%) Queuing Penalty (veh) Storage Bay Dist (ft) Storage Blk Time (%) Queuing Penalty (veh) SWA 7/7/27 Page 6 2
121 Queuing and Blocking Report MD 8 Intersection: 4: MD 8 & MD 32 WB Ramps SimTraffic Report Existing AM Movement WB WB WB NB NB NB SB SB Directions Served L LT R L T T T TR Maximum Queue (ft) Average Queue (ft) th Queue (ft) Link Distance (ft) Upstream Blk Time (%) Queuing Penalty (veh) Storage Bay Dist (ft) Storage Blk Time (%) Queuing Penalty (veh) Intersection: 5: MD 8 & MD32 EB Ramps Movement EB EB NB NB SB SB SB Directions Served L LTR TR R L T T Maximum Queue (ft) Average Queue (ft) th Queue (ft) Link Distance (ft) Upstream Blk Time (%) 43 3 Queuing Penalty (veh) 2 Storage Bay Dist (ft) 75 4 Storage Blk Time (%) Queuing Penalty (veh) 3 36 Intersection: 6: MD 8 & Gas Station/Linden Linthicum Lane Movement EB WB WB NB NB NB SB SB SB Directions Served LTR LT R L T R L T TR Maximum Queue (ft) Average Queue (ft) th Queue (ft) Link Distance (ft) Upstream Blk Time (%) 3 Queuing Penalty (veh) Storage Bay Dist (ft) 5 Storage Blk Time (%) 2 Queuing Penalty (veh) 5 SWA 7/7/27 Page 7 3
122 Queuing and Blocking Report MD 8 Intersection: 7: MD 8 & Garden Center SimTraffic Report Existing AM Movement NE Directions Served T Maximum Queue (ft) 53 Average Queue (ft) 9 95th Queue (ft) 74 Link Distance (ft) 424 Upstream Blk Time (%) Queuing Penalty (veh) Storage Bay Dist (ft) Storage Blk Time (%) Queuing Penalty (veh) Zone Summary Zone wide Queuing Penalty: 69 SWA 7/7/27 Page 8 4
123 SimTraffic Simulation Summary MD 8 Summary of All Intervals SimTraffic Report Existing PM Run Number Start Time 4:5 4:5 4:5 4:5 4:5 4:5 4:5 End Time 6: 6: 6: 6: 6: 6: 6: Total Time (min) Time Recorded (min) # of Intervals # of Recorded Intervals Vehs Entered Vehs Exited Starting Vehs Ending Vehs Travel Distance (mi) Travel Time (hr) Total Delay (hr) Total Stops Fuel Used (gal) Summary of All Intervals Run Number Avg Start Time 4:5 4:5 4:5 4:5 End Time 6: 6: 6: 6: Total Time (min) Time Recorded (min) # of Intervals # of Recorded Intervals Vehs Entered Vehs Exited Starting Vehs Ending Vehs Travel Distance (mi) Travel Time (hr) Total Delay (hr) Total Stops Fuel Used (gal) Interval # Information Seeding Start Time 4:5 End Time 5: Total Time (min) Volumes adjusted by Growth Factors. No data recorded this interval. SWA Page 5
124 Queuing and Blocking Report MD 8 Intersection: : MD 8 & Sheppard Lane SimTraffic Report Existing PM Movement EB NB NB SB SB Directions Served LR L T T R Maximum Queue (ft) Average Queue (ft) th Queue (ft) Link Distance (ft) Upstream Blk Time (%) 9 Queuing Penalty (veh) 9 Storage Bay Dist (ft) Storage Blk Time (%) Queuing Penalty (veh) Intersection: 2: MD 8 & Hardware Store/Great Star Drive Movement EB WB WB WB NB NB NB SB SB SB Directions Served LTR L LT R L T TR L T TR Maximum Queue (ft) Average Queue (ft) th Queue (ft) Link Distance (ft) Upstream Blk Time (%) 2 Queuing Penalty (veh) 4 2 Storage Bay Dist (ft) Storage Blk Time (%) Queuing Penalty (veh) Intersection: 3: MD 8 & Auto Dr./Signal Bell Ln Movement EB EB WB NB NB NB SB SB SB Directions Served LT R LTR L T TR L T TR Maximum Queue (ft) Average Queue (ft) th Queue (ft) Link Distance (ft) Upstream Blk Time (%) Queuing Penalty (veh) Storage Bay Dist (ft) Storage Blk Time (%) 2 2 Queuing Penalty (veh) 2 SWA Page 6 6
125 Queuing and Blocking Report MD 8 Intersection: 4: MD 8 & MD 32 WB Ramps SimTraffic Report Existing PM Movement WB WB WB NB NB NB SB SB Directions Served L LT R L T T T TR Maximum Queue (ft) Average Queue (ft) th Queue (ft) Link Distance (ft) Upstream Blk Time (%) Queuing Penalty (veh) Storage Bay Dist (ft) Storage Blk Time (%) 8 2 Queuing Penalty (veh) Intersection: 5: MD 8 & MD32 EB Ramps Movement EB EB NB SB SB SB Directions Served L LTR TR L T T Maximum Queue (ft) Average Queue (ft) th Queue (ft) Link Distance (ft) Upstream Blk Time (%) Queuing Penalty (veh) Storage Bay Dist (ft) 75 4 Storage Blk Time (%) Queuing Penalty (veh) Intersection: 6: MD 8 & Gas Station/Linden Linthicum Lane Movement EB WB WB NB NB NB SB SB SB Directions Served LTR LT R L T R L T TR Maximum Queue (ft) Average Queue (ft) th Queue (ft) Link Distance (ft) Upstream Blk Time (%) Queuing Penalty (veh) 2 7 Storage Bay Dist (ft) 5 Storage Blk Time (%) 2 Queuing Penalty (veh) 28 SWA Page 7 7
126 Queuing and Blocking Report MD 8 Intersection: 7: MD 8 & Garden Center SimTraffic Report Existing PM Movement NE NE B7 Directions Served T R T Maximum Queue (ft) Average Queue (ft) th Queue (ft) Link Distance (ft) Upstream Blk Time (%) 3 2 Queuing Penalty (veh) Storage Bay Dist (ft) 75 Storage Blk Time (%) 5 Queuing Penalty (veh) Zone Summary Zone wide Queuing Penalty: 8 SWA Page 8 8
127 SimTraffic Simulation Summary MD 8 Erickson Summary of All Intervals SimTraffic Report Background AM Run Number Start Time 6:5 6:5 6:5 6:5 6:5 6:5 6:5 End Time 8: 8: 8: 8: 8: 8: 8: Total Time (min) Time Recorded (min) # of Intervals # of Recorded Intervals Vehs Entered Vehs Exited Starting Vehs Ending Vehs Travel Distance (mi) Travel Time (hr) Total Delay (hr) Total Stops Fuel Used (gal) Summary of All Intervals Run Number Avg Start Time 6:5 6:5 6:5 6:5 End Time 8: 8: 8: 8: Total Time (min) Time Recorded (min) # of Intervals # of Recorded Intervals Vehs Entered Vehs Exited Starting Vehs Ending Vehs Travel Distance (mi) Travel Time (hr) Total Delay (hr) Total Stops Fuel Used (gal) Interval # Information Seeding Start Time 6:5 End Time 7: Total Time (min) Volumes adjusted by Growth Factors. No data recorded this interval. RH 7/4/27 Page 9
128 Queuing and Blocking Report MD 8 Erickson Intersection: : MD 8 & Sheppard Lane SimTraffic Report Background AM Movement EB WB WB NB NB NB SB SB SB Directions Served LTR L TR L T R L T R Maximum Queue (ft) Average Queue (ft) th Queue (ft) Link Distance (ft) Upstream Blk Time (%) Queuing Penalty (veh) 3 Storage Bay Dist (ft) 5 5 Storage Blk Time (%) Queuing Penalty (veh) Intersection: 2: MD 8 & Hardware Store/Great Star Drive Movement EB WB WB WB NB NB NB SB SB SB Directions Served LTR L LT R L T TR L T TR Maximum Queue (ft) Average Queue (ft) th Queue (ft) Link Distance (ft) Upstream Blk Time (%) Queuing Penalty (veh) 7 7 Storage Bay Dist (ft) Storage Blk Time (%) 5 5 Queuing Penalty (veh) Intersection: 3: MD 8 & Auto Dr./Signal Bell Ln Movement EB EB WB NB NB NB SB SB SB Directions Served LT R LTR L T TR L T TR Maximum Queue (ft) Average Queue (ft) th Queue (ft) Link Distance (ft) Upstream Blk Time (%) 4 4 Queuing Penalty (veh) 2 2 Storage Bay Dist (ft) Storage Blk Time (%) 4 Queuing Penalty (veh) 8 RH 7/4/27 Page 6
129 Queuing and Blocking Report MD 8 Erickson Intersection: 4: MD 8 & MD 32 WB Ramps SimTraffic Report Background AM Movement WB WB WB NB NB NB SB SB Directions Served L LT R L T T T TR Maximum Queue (ft) Average Queue (ft) th Queue (ft) Link Distance (ft) Upstream Blk Time (%) 3 3 Queuing Penalty (veh) 2 4 Storage Bay Dist (ft) Storage Blk Time (%) 4 3 Queuing Penalty (veh) Intersection: 6: MD 8 & Gas Station/Linden Linthicum Lane Movement EB WB WB NB NB NB SB SB SB Directions Served LTR LT R L T R L T TR Maximum Queue (ft) Average Queue (ft) th Queue (ft) Link Distance (ft) Upstream Blk Time (%) Queuing Penalty (veh) 6 7 Storage Bay Dist (ft) 5 Storage Blk Time (%) 3 4 Queuing Penalty (veh) 25 Intersection: 7: MD 8 & Garden Center Movement NW NE NE B7 SW Directions Served R T R T T Maximum Queue (ft) Average Queue (ft) th Queue (ft) Link Distance (ft) Upstream Blk Time (%) Queuing Penalty (veh) Storage Bay Dist (ft) 75 Storage Blk Time (%) 7 4 Queuing Penalty (veh) 9 Zone Summary Zone wide Queuing Penalty: 852 RH 7/4/27 Page 7
130 SimTraffic Simulation Summary MD 8 Erickson Summary of All Intervals SimTraffic Report Background PM Run Number Start Time 4:5 4:5 4:5 4:5 4:5 4:5 4:5 End Time 6: 6: 6: 6: 6: 6: 6: Total Time (min) Time Recorded (min) # of Intervals # of Recorded Intervals Vehs Entered Vehs Exited Starting Vehs Ending Vehs Travel Distance (mi) Travel Time (hr) Total Delay (hr) Total Stops Fuel Used (gal) Summary of All Intervals Run Number Avg Start Time 4:5 4:5 4:5 4:5 End Time 6: 6: 6: 6: Total Time (min) Time Recorded (min) # of Intervals # of Recorded Intervals Vehs Entered Vehs Exited Starting Vehs Ending Vehs Travel Distance (mi) Travel Time (hr) Total Delay (hr) Total Stops Fuel Used (gal) Interval # Information Seeding Start Time 4:5 End Time 5: Total Time (min) Volumes adjusted by Growth Factors. No data recorded this interval. RH 7/4/27 Page 2
131 Queuing and Blocking Report MD 8 Erickson Intersection: : MD 8 & Sheppard Lane SimTraffic Report Background PM Movement EB WB WB NB NB NB SB SB SB Directions Served LTR L TR L T R L T R Maximum Queue (ft) Average Queue (ft) th Queue (ft) Link Distance (ft) Upstream Blk Time (%) Queuing Penalty (veh) 387 Storage Bay Dist (ft) Storage Blk Time (%) Queuing Penalty (veh) Intersection: 2: MD 8 & Hardware Store/Great Star Drive Movement EB WB WB WB NB NB NB SB SB SB Directions Served LTR L LT R L T TR L T TR Maximum Queue (ft) Average Queue (ft) th Queue (ft) Link Distance (ft) Upstream Blk Time (%) Queuing Penalty (veh) Storage Bay Dist (ft) Storage Blk Time (%) Queuing Penalty (veh) Intersection: 3: MD 8 & Auto Dr./Signal Bell Ln Movement EB EB WB NB NB NB SB SB SB Directions Served LT R LTR L T TR L T TR Maximum Queue (ft) Average Queue (ft) th Queue (ft) Link Distance (ft) Upstream Blk Time (%) Queuing Penalty (veh) Storage Bay Dist (ft) Storage Blk Time (%) Queuing Penalty (veh) RH 7/4/27 Page 6 3
132 Queuing and Blocking Report MD 8 Erickson Intersection: 4: MD 8 & MD 32 WB Ramps SimTraffic Report Background PM Movement WB WB WB NB NB NB SB SB Directions Served L LT R L T T T TR Maximum Queue (ft) Average Queue (ft) th Queue (ft) Link Distance (ft) Upstream Blk Time (%) Queuing Penalty (veh) 5 47 Storage Bay Dist (ft) Storage Blk Time (%) Queuing Penalty (veh) Intersection: 6: MD 8 & Gas Station/Linden Linthicum Lane Movement EB WB WB NB NB NB SB SB SB Directions Served LTR LT R L T R L T TR Maximum Queue (ft) Average Queue (ft) th Queue (ft) Link Distance (ft) Upstream Blk Time (%) Queuing Penalty (veh) Storage Bay Dist (ft) 5 Storage Blk Time (%) 2 Queuing Penalty (veh) 42 Intersection: 7: MD 8 & Garden Center Movement NW NE NE B7 SW Directions Served R T R T T Maximum Queue (ft) Average Queue (ft) th Queue (ft) Link Distance (ft) Upstream Blk Time (%) Queuing Penalty (veh) Storage Bay Dist (ft) 75 Storage Blk Time (%) 2 8 Queuing Penalty (veh) Zone Summary Zone wide Queuing Penalty: 4273 RH 7/4/27 Page 7 4
133 SimTraffic Simulation Summary MD 8 Erickson Summary of All Intervals SimTraffic Report 223 Total AM w/improvement & Traffic Adjustment Run Number Start Time 6:5 6:5 6:5 6:5 6:5 6:5 6:5 End Time 8: 8: 8: 8: 8: 8: 8: Total Time (min) Time Recorded (min) # of Intervals # of Recorded Intervals Vehs Entered Vehs Exited Starting Vehs Ending Vehs Travel Distance (mi) Travel Time (hr) Total Delay (hr) Total Stops Fuel Used (gal) Summary of All Intervals Run Number Avg Start Time 6:5 6:5 6:5 6:5 End Time 8: 8: 8: 8: Total Time (min) Time Recorded (min) # of Intervals # of Recorded Intervals Vehs Entered Vehs Exited Starting Vehs Ending Vehs Travel Distance (mi) Travel Time (hr) Total Delay (hr) Total Stops Fuel Used (gal) Interval # Information Seeding Start Time 6:5 End Time 7: Total Time (min) Volumes adjusted by Growth Factors. No data recorded this interval. RH 7/27/27 Page 5
134 SimTraffic Simulation Summary MD 8 Erickson Interval # Information Recording Start Time 7: End Time 8: Total Time (min) 6 Volumes adjusted by Growth Factors. SimTraffic Report 223 Total AM w/improvement & Traffic Adjustment Run Number Vehs Entered Vehs Exited Starting Vehs Ending Vehs Travel Distance (mi) Travel Time (hr) Total Delay (hr) Total Stops Fuel Used (gal) Interval # Information Recording Start Time 7: End Time 8: Total Time (min) 6 Volumes adjusted by Growth Factors. Run Number Avg Vehs Entered Vehs Exited Starting Vehs Ending Vehs Travel Distance (mi) Travel Time (hr) Total Delay (hr) Total Stops Fuel Used (gal) RH 7/27/27 Page 2 6
135 Queuing and Blocking Report MD 8 Erickson Intersection: : MD 8 & Sheppard Lane SimTraffic Report 223 Total AM w/improvement & Traffic Adjustment Movement EB EB WB WB B2 NB NB NB SB SB SB SB Directions Served LT R L TR T L T R L T T R Maximum Queue (ft) Average Queue (ft) th Queue (ft) Link Distance (ft) Upstream Blk Time (%) Queuing Penalty (veh) Storage Bay Dist (ft) 2 5 Storage Blk Time (%) 7 9 Queuing Penalty (veh) 7 4 Intersection: 2: MD 8 & Hardware Store/Great Star Drive Movement EB WB WB WB NB NB NB SB SB SB Directions Served LTR L LT R L T TR L T TR Maximum Queue (ft) Average Queue (ft) th Queue (ft) Link Distance (ft) Upstream Blk Time (%) Queuing Penalty (veh) Storage Bay Dist (ft) Storage Blk Time (%) 5 Queuing Penalty (veh) 7 2 Intersection: 3: MD 8 & Auto Dr./Signal Bell Ln Movement EB EB WB NB NB NB SB SB SB Directions Served LT R LTR L T TR L T TR Maximum Queue (ft) Average Queue (ft) th Queue (ft) Link Distance (ft) Upstream Blk Time (%) Queuing Penalty (veh) Storage Bay Dist (ft) Storage Blk Time (%) 2 Queuing Penalty (veh) RH 7/27/27 Page 3 7
136 Queuing and Blocking Report MD 8 Erickson Intersection: 4: MD 32 WB Ramp & MD 8 SimTraffic Report 223 Total AM w/improvement & Traffic Adjustment Movement WB WB WB NB NB NB SB SB Directions Served L LT R L T T T TR Maximum Queue (ft) Average Queue (ft) th Queue (ft) Link Distance (ft) Upstream Blk Time (%) 2 Queuing Penalty (veh) 7 2 Storage Bay Dist (ft) Storage Blk Time (%) Queuing Penalty (veh) Intersection: 6: MD 8 & New Road/Linden Linthicum Lane Movement EB EB WB WB NB NB NB SB SB SB B7 Directions Served L TR LT R L T TR L T TR T Maximum Queue (ft) Average Queue (ft) th Queue (ft) Link Distance (ft) Upstream Blk Time (%) Queuing Penalty (veh) 4 Storage Bay Dist (ft) 25 Storage Blk Time (%) Queuing Penalty (veh) Intersection: 7: MD 8 & Garden Center Movement NB NB NB SB SB SB Directions Served L T T T T R Maximum Queue (ft) Average Queue (ft) th Queue (ft) Link Distance (ft) Upstream Blk Time (%) Queuing Penalty (veh) Storage Bay Dist (ft) 5 Storage Blk Time (%) Queuing Penalty (veh) Zone Summary Zone wide Queuing Penalty: 66 RH 7/27/27 Page 4 8
137 SimTraffic Report SimTraffic Simulation Summary Summary of All Intervals MD 8 Erickson Total PM w/improvement Run Number Start Time 4:5 4:5 4:5 4:5 4:5 4:5 4:5 End Time 6: 6: 6: 6: 6: 6: 6: Total Time (min) Time Recorded (min) # of Intervals # of Recorded Intervals Vehs Entered Vehs Exited Starting Vehs Ending Vehs Travel Distance (mi) Travel Time (hr) Total Delay (hr) Total Stops Fuel Used (gal) Summary of All Intervals Run Number Avg Start Time 4:5 4:5 4:5 4:5 End Time 6: 6: 6: 6: Total Time (min) Time Recorded (min) # of Intervals # of Recorded Intervals Vehs Entered Vehs Exited Starting Vehs Ending Vehs Travel Distance (mi) Travel Time (hr) Total Delay (hr) Total Stops Fuel Used (gal) Interval # Information Seeding Start Time 4:5 End Time 5: Total Time (min) Volumes adjusted by Growth Factors. No data recorded this interval. RH 7/27/27 Page 9
138 SimTraffic Report SimTraffic Simulation Summary Interval # Information Recording Start Time 5: End Time 6: Total Time (min) 6 Volumes adjusted by Growth Factors. MD 8 Erickson Total PM w/improvement Run Number Vehs Entered Vehs Exited Starting Vehs Ending Vehs Travel Distance (mi) Travel Time (hr) Total Delay (hr) Total Stops Fuel Used (gal) Interval # Information Recording Start Time 5: End Time 6: Total Time (min) 6 Volumes adjusted by Growth Factors. Run Number Avg Vehs Entered Vehs Exited Starting Vehs Ending Vehs Travel Distance (mi) Travel Time (hr) Total Delay (hr) Total Stops Fuel Used (gal) RH 7/27/27 Page 2 2
139 SimTraffic Report Queuing and Blocking Report Intersection: : MD 8 & Sheppard Lane MD 8 Erickson Total PM w/improvement Movement EB EB WB WB B2 NB NB NB SB SB SB SB Directions Served LT R L TR T L T R L T T R Maximum Queue (ft) Average Queue (ft) th Queue (ft) Link Distance (ft) Upstream Blk Time (%) Queuing Penalty (veh) 4 3 Storage Bay Dist (ft) 2 5 Storage Blk Time (%) 23 5 Queuing Penalty (veh) 9 9 Intersection: 2: MD 8 & Hardware Store/Great Star Drive Movement EB WB WB WB NB NB NB SB SB SB Directions Served LTR L LT R L T TR L T TR Maximum Queue (ft) Average Queue (ft) th Queue (ft) Link Distance (ft) Upstream Blk Time (%) Queuing Penalty (veh) Storage Bay Dist (ft) Storage Blk Time (%) Queuing Penalty (veh) Intersection: 3: MD 8 & Auto Dr./Signal Bell Ln Movement EB EB WB NB NB NB SB SB SB Directions Served LT R LTR L T TR L T TR Maximum Queue (ft) Average Queue (ft) th Queue (ft) Link Distance (ft) Upstream Blk Time (%) Queuing Penalty (veh) Storage Bay Dist (ft) Storage Blk Time (%) Queuing Penalty (veh) RH 7/27/27 Page 3 2
140 SimTraffic Report Queuing and Blocking Report Intersection: 4: MD 8 & MD 32 WB Ramps MD 8 Erickson Total PM w/improvement Movement WB WB WB NB NB NB SB SB Directions Served L LT R L T T T TR Maximum Queue (ft) Average Queue (ft) th Queue (ft) Link Distance (ft) Upstream Blk Time (%) Queuing Penalty (veh) Storage Bay Dist (ft) Storage Blk Time (%) Queuing Penalty (veh) Intersection: 6: MD 8 & New Road/Linden Linthicum Lane Movement EB EB WB WB NB NB NB SB SB SB B7 Directions Served L TR LT R L T TR L T TR T Maximum Queue (ft) Average Queue (ft) th Queue (ft) Link Distance (ft) Upstream Blk Time (%) 3 6 Queuing Penalty (veh) Storage Bay Dist (ft) 25 Storage Blk Time (%) 9 Queuing Penalty (veh) 8 Intersection: 7: MD 8 & Garden Center Movement NB NB NB NB SB Directions Served L T T R R Maximum Queue (ft) Average Queue (ft) th Queue (ft) Link Distance (ft) Upstream Blk Time (%) Queuing Penalty (veh) Storage Bay Dist (ft) 5 75 Storage Blk Time (%) Queuing Penalty (veh) Zone Summary Zone wide Queuing Penalty: 863 RH 7/27/27 Page 4 22
141 HCM 2 Signalized Intersection Summary MD 8 : MD 8 & Sheppard Lane Existing AM Movement EBL EBR NBL NBT SBT SBR Lane Configurations Traffic Volume (veh/h) Future Volume (veh/h) Number Initial Q (Qb), veh Ped-Bike Adj(A_pbT).... Parking Bus, Adj Adj Sat Flow, veh/h/ln Adj Flow Rate, veh/h Adj No. of Lanes Peak Hour Factor Percent Heavy Veh, % Cap, veh/h Arrive On Green Sat Flow, veh/h Grp Volume(v), veh/h Grp Sat Flow(s),veh/h/ln Q Serve(g_s), s Cycle Q Clear(g_c), s Prop In Lane Lane Grp Cap(c), veh/h V/C Ratio(X) Avail Cap(c_a), veh/h HCM Platoon Ratio Upstream Filter(I) Uniform Delay (d), s/veh Incr Delay (d2), s/veh Initial Q Delay(d3),s/veh %ile BackOfQ(95%),veh/ln LnGrp Delay(d),s/veh LnGrp LOS D C C D Approach Vol, veh/h Approach Delay, s/veh Approach LOS D C D Timer Assigned Phs Phs Duration (G+Y+Rc), s Change Period (Y+Rc), s Max Green Setting (Gmax), s Max Q Clear Time (g_c+i), s Green Ext Time (p_c), s Intersection Summary HCM 2 Ctrl Delay 33. HCM 2 LOS C Notes User approved volume balancing among the lanes for turning movement. SWA Synchro Report 7/4/27 Page 23
142 HCM 2 Signalized Intersection Summary MD 8 2: MD 8 & Hardware Store/Great Star Drive Existing AM Movement EBL EBT EBR WBL WBT WBR NBL NBT NBR SBL SBT SBR Lane Configurations Traffic Volume (veh/h) Future Volume (veh/h) Number Initial Q (Qb), veh Ped-Bike Adj(A_pbT) Parking Bus, Adj Adj Sat Flow, veh/h/ln Adj Flow Rate, veh/h Adj No. of Lanes Peak Hour Factor Percent Heavy Veh, % Cap, veh/h Arrive On Green Sat Flow, veh/h Grp Volume(v), veh/h Grp Sat Flow(s),veh/h/ln Q Serve(g_s), s Cycle Q Clear(g_c), s Prop In Lane Lane Grp Cap(c), veh/h V/C Ratio(X) Avail Cap(c_a), veh/h HCM Platoon Ratio Upstream Filter(I) Uniform Delay (d), s/veh Incr Delay (d2), s/veh Initial Q Delay(d3),s/veh %ile BackOfQ(95%),veh/ln LnGrp Delay(d),s/veh LnGrp LOS B B C A B B A A A Approach Vol, veh/h Approach Delay, s/veh Approach LOS B B B A Timer Assigned Phs Phs Duration (G+Y+Rc), s Change Period (Y+Rc), s Max Green Setting (Gmax), 9.s Max Q Clear Time (g_c+i), 2.2s Green Ext Time (p_c), s Intersection Summary HCM 2 Ctrl Delay 2. HCM 2 LOS B Notes User approved volume balancing among the lanes for turning movement. SWA Synchro Report 7/4/27 Page 2 24
143 HCM 2 Signalized Intersection Summary MD 8 3: MD 8 & Auto Dr./Signal Bell Ln Existing AM Movement EBL EBT EBR WBL WBT WBR NBL NBT NBR SBL SBT SBR Lane Configurations Traffic Volume (veh/h) Future Volume (veh/h) Number Initial Q (Qb), veh Ped-Bike Adj(A_pbT) Parking Bus, Adj Adj Sat Flow, veh/h/ln Adj Flow Rate, veh/h Adj No. of Lanes 2 2 Peak Hour Factor Percent Heavy Veh, % Cap, veh/h Arrive On Green Sat Flow, veh/h Grp Volume(v), veh/h Grp Sat Flow(s),veh/h/ln Q Serve(g_s), s Cycle Q Clear(g_c), s Prop In Lane Lane Grp Cap(c), veh/h V/C Ratio(X) Avail Cap(c_a), veh/h HCM Platoon Ratio Upstream Filter(I) Uniform Delay (d), s/veh Incr Delay (d2), s/veh Initial Q Delay(d3),s/veh %ile BackOfQ(95%),veh/ln LnGrp Delay(d),s/veh LnGrp LOS B C C A A A A A A Approach Vol, veh/h Approach Delay, s/veh Approach LOS C C A A Timer Assigned Phs Phs Duration (G+Y+Rc), s Change Period (Y+Rc), s 5. * Max Green Setting (Gmax), 9. s * Max Q Clear Time (g_c+i), 3.6s Green Ext Time (p_c), s Intersection Summary HCM 2 Ctrl Delay 8. HCM 2 LOS A Notes * HCM 2 computational engine requires equal clearance times for the phases crossing the barrier. SWA Synchro Report 7/4/27 Page 3 25
144 HCM Signalized Intersection Capacity Analysis MD 8 4: MD 8 & MD 32 WB Ramps Existing AM Movement EBL EBT EBR WBL WBT WBR NBL NBT NBR SBL SBT SBR Lane Configurations Traffic Volume (vph) Future Volume (vph) Ideal Flow (vphpl) Total Lost time (s) Lane Util. Factor Frt Flt Protected Satd. Flow (prot) Flt Permitted Satd. Flow (perm) Peak-hour factor, PHF Adj. Flow (vph) RTOR Reduction (vph) 5 Lane Group Flow (vph) Turn Type Perm NA Perm custom NA NA Protected Phases Permitted Phases Actuated Green, G (s) Effective Green, g (s) Actuated g/c Ratio Clearance Time (s) Vehicle Extension (s) Lane Grp Cap (vph) v/s Ratio Prot. c.6 c.24 v/s Ratio Perm.4.4 c.8.3 v/c Ratio Uniform Delay, d Progression Factor Incremental Delay, d Delay (s) Level of Service D D D A A B Approach Delay (s) Approach LOS A D A B Intersection Summary HCM 2 Control Delay 2.7 HCM 2 Level of Service C HCM 2 Volume to Capacity ratio.49 Actuated Cycle Length (s) 2. Sum of lost time (s) 9. Intersection Capacity Utilization 75.8% ICU Level of Service D Analysis Period (min) 5 c Critical Lane Group SWA Synchro Report 7/4/27 Page 26
145 HCM 2 TWSC MD 8 6: MD 8 & Gas Station/Linden Linthicum Lane Existing AM Intersection Int Delay, s/veh 2.7 Movement EBL EBT EBR WBL WBT WBR NBL NBT NBR SBL SBT SBR Lane Configurations Traffic Vol, veh/h Future Vol, veh/h Conflicting Peds, #/hr Sign Control Stop Stop Stop Stop Stop Stop Free Free Free Free Free Free RT Channelized - - None - - None - - Free - - None Storage Length Veh in Median Storage, # Grade, % Peak Hour Factor Heavy Vehicles, % Mvmt Flow Major/Minor Minor2 Minor Major Major2 Conflicting Flow All Stage Stage Critical Hdwy Critical Hdwy Stg Critical Hdwy Stg Follow-up Hdwy Pot Cap- Maneuver Stage Stage Platoon blocked, % Mov Cap- Maneuver ~ Mov Cap-2 Maneuver ~ Stage Stage Approach EB WB NB SB HCM Control Delay, s $ HCM LOS F E Minor Lane/Major Mvmt NBL NBT EBLnWBLnWBLn2 SBL SBT SBR Capacity (veh/h) HCM Lane V/C Ratio HCM Control Delay (s).4 -$ HCM Lane LOS B - F F C B - - HCM 95th %tile Q(veh) Notes ~: Volume exceeds capacity $: Delay exceeds 3s +: Computation Not Defined *: All major volume in platoon SWA Synchro Report 7/4/27 Page 6 27
146 HCM 2 TWSC MD 8 7: MD 8 & Garden Center Existing AM Intersection Int Delay, s/veh Movement NWL NWR NET NER SWL SWT Lane Configurations Traffic Vol, veh/h Future Vol, veh/h Conflicting Peds, #/hr Sign Control Stop Stop Free Free Free Free RT Channelized - None - None - None Storage Length Veh in Median Storage, # Grade, % Peak Hour Factor Heavy Vehicles, % Mvmt Flow Major/Minor Minor Major Major2 Conflicting Flow All Stage Stage Critical Hdwy Critical Hdwy Stg Critical Hdwy Stg Follow-up Hdwy Pot Cap- Maneuver Stage Stage Platoon blocked, % Mov Cap- Maneuver Mov Cap-2 Maneuver Stage Stage Approach NW NE SW HCM Control Delay, s HCM LOS A Minor Lane/Major Mvmt NET NERNWLnNWLn2 SWL SWT Capacity (veh/h) HCM Lane V/C Ratio HCM Control Delay (s) HCM Lane LOS - - A A A - HCM 95th %tile Q(veh) SWA Synchro Report 7/4/27 Page 7 28
147 HCM 2 Signalized Intersection Summary MD 8 : MD 8 & Sheppard Lane Existing PM Movement EBL EBR NBL NBT SBT SBR Lane Configurations Traffic Volume (veh/h) Future Volume (veh/h) Number Initial Q (Qb), veh Ped-Bike Adj(A_pbT).... Parking Bus, Adj Adj Sat Flow, veh/h/ln Adj Flow Rate, veh/h Adj No. of Lanes Peak Hour Factor Percent Heavy Veh, % Cap, veh/h Arrive On Green Sat Flow, veh/h Grp Volume(v), veh/h Grp Sat Flow(s),veh/h/ln Q Serve(g_s), s Cycle Q Clear(g_c), s Prop In Lane Lane Grp Cap(c), veh/h V/C Ratio(X) Avail Cap(c_a), veh/h HCM Platoon Ratio Upstream Filter(I) Uniform Delay (d), s/veh Incr Delay (d2), s/veh Initial Q Delay(d3),s/veh %ile BackOfQ(95%),veh/ln LnGrp Delay(d),s/veh LnGrp LOS C C A C Approach Vol, veh/h Approach Delay, s/veh Approach LOS C B C Timer Assigned Phs Phs Duration (G+Y+Rc), s Change Period (Y+Rc), s Max Green Setting (Gmax), s Max Q Clear Time (g_c+i), s Green Ext Time (p_c), s Intersection Summary HCM 2 Ctrl Delay 2.3 HCM 2 LOS C Notes User approved volume balancing among the lanes for turning movement. SWA Synchro Report 7/4/27 Page 29
148 HCM 2 Signalized Intersection Summary MD 8 2: MD 8 & Hardware Store/Great Star Drive Existing PM Movement EBL EBT EBR WBL WBT WBR NBL NBT NBR SBL SBT SBR Lane Configurations Traffic Volume (veh/h) Future Volume (veh/h) Number Initial Q (Qb), veh Ped-Bike Adj(A_pbT) Parking Bus, Adj Adj Sat Flow, veh/h/ln Adj Flow Rate, veh/h Adj No. of Lanes Peak Hour Factor Percent Heavy Veh, % Cap, veh/h Arrive On Green Sat Flow, veh/h Grp Volume(v), veh/h Grp Sat Flow(s),veh/h/ln Q Serve(g_s), s Cycle Q Clear(g_c), s Prop In Lane Lane Grp Cap(c), veh/h V/C Ratio(X) Avail Cap(c_a), veh/h HCM Platoon Ratio Upstream Filter(I) Uniform Delay (d), s/veh Incr Delay (d2), s/veh Initial Q Delay(d3),s/veh %ile BackOfQ(95%),veh/ln LnGrp Delay(d),s/veh LnGrp LOS C C E B C C B B B Approach Vol, veh/h Approach Delay, s/veh Approach LOS C D C B Timer Assigned Phs Phs Duration (G+Y+Rc), s Change Period (Y+Rc), s Max Green Setting (Gmax), 5.5s Max Q Clear Time (g_c+i), 2.5s Green Ext Time (p_c), s Intersection Summary HCM 2 Ctrl Delay 27.4 HCM 2 LOS C Notes User approved volume balancing among the lanes for turning movement. SWA Synchro Report 7/4/27 Page 2 3
149 HCM 2 Signalized Intersection Summary MD 8 3: MD 8 & Auto Dr./Signal Bell Ln Existing PM Movement EBL EBT EBR WBL WBT WBR NBL NBT NBR SBL SBT SBR Lane Configurations Traffic Volume (veh/h) Future Volume (veh/h) Number Initial Q (Qb), veh Ped-Bike Adj(A_pbT) Parking Bus, Adj Adj Sat Flow, veh/h/ln Adj Flow Rate, veh/h Adj No. of Lanes 2 2 Peak Hour Factor Percent Heavy Veh, % Cap, veh/h Arrive On Green Sat Flow, veh/h Grp Volume(v), veh/h Grp Sat Flow(s),veh/h/ln Q Serve(g_s), s Cycle Q Clear(g_c), s Prop In Lane Lane Grp Cap(c), veh/h V/C Ratio(X) Avail Cap(c_a), veh/h HCM Platoon Ratio Upstream Filter(I) Uniform Delay (d), s/veh Incr Delay (d2), s/veh Initial Q Delay(d3),s/veh %ile BackOfQ(95%),veh/ln LnGrp Delay(d),s/veh LnGrp LOS C C C A A A A A A Approach Vol, veh/h Approach Delay, s/veh Approach LOS C C A A Timer Assigned Phs Phs Duration (G+Y+Rc), s Change Period (Y+Rc), s Max Green Setting (Gmax), 4.5s Max Q Clear Time (g_c+i), 3.s Green Ext Time (p_c), s Intersection Summary HCM 2 Ctrl Delay.7 HCM 2 LOS B SWA Synchro Report 7/4/27 Page 3 3
150 HCM Signalized Intersection Capacity Analysis MD 8 4: MD 8 & MD 32 WB Ramps Existing PM Movement EBL EBT EBR WBL WBT WBR NBL NBT NBR SBL SBT SBR Lane Configurations Traffic Volume (vph) Future Volume (vph) Ideal Flow (vphpl) Total Lost time (s) Lane Util. Factor Frt Flt Protected Satd. Flow (prot) Flt Permitted Satd. Flow (perm) Peak-hour factor, PHF Adj. Flow (vph) RTOR Reduction (vph) 7 Lane Group Flow (vph) Turn Type Perm NA Perm custom NA NA Protected Phases Permitted Phases Actuated Green, G (s) Effective Green, g (s) Actuated g/c Ratio Clearance Time (s) Vehicle Extension (s) Lane Grp Cap (vph) v/s Ratio Prot. c.2 c.28 v/s Ratio Perm v/c Ratio Uniform Delay, d Progression Factor Incremental Delay, d Delay (s) Level of Service D D D C B C Approach Delay (s) Approach LOS A D B C Intersection Summary HCM 2 Control Delay 32.4 HCM 2 Level of Service C HCM 2 Volume to Capacity ratio.62 Actuated Cycle Length (s) 5. Sum of lost time (s) 9. Intersection Capacity Utilization 68.9% ICU Level of Service C Analysis Period (min) 5 c Critical Lane Group SWA Synchro Report 7/4/27 Page 32
151 HCM 2 TWSC MD 8 6: MD 8 & Gas Station/Linden Linthicum Lane Existing PM Intersection Int Delay, s/veh 29.3 Movement EBL EBT EBR WBL WBT WBR NBL NBT NBR SBL SBT SBR Lane Configurations Traffic Vol, veh/h Future Vol, veh/h Conflicting Peds, #/hr Sign Control Stop Stop Stop Stop Stop Stop Free Free Free Free Free Free RT Channelized - - None - - None - - Free - - None Storage Length Veh in Median Storage, # Grade, % Peak Hour Factor Heavy Vehicles, % Mvmt Flow Major/Minor Minor2 Minor Major Major2 Conflicting Flow All Stage Stage Critical Hdwy Critical Hdwy Stg Critical Hdwy Stg Follow-up Hdwy Pot Cap- Maneuver ~ ~ 24 2 ~ Stage Stage Platoon blocked, % Mov Cap- Maneuver ~ 5 4 ~ Mov Cap-2 Maneuver ~ Stage Stage Approach EB WB NB SB HCM Control Delay, s $ HCM LOS - F Minor Lane/Major Mvmt NBL NBT EBLnWBLnWBLn2 SBL SBT SBR Capacity (veh/h) HCM Lane V/C Ratio HCM Control Delay (s) $ HCM Lane LOS A - - F F C - - HCM 95th %tile Q(veh) Notes ~: Volume exceeds capacity $: Delay exceeds 3s +: Computation Not Defined *: All major volume in platoon SWA Synchro Report 7/4/27 Page 5 33
152 HCM 2 TWSC MD 8 7: MD 8 & Garden Center Existing PM Intersection Int Delay, s/veh Movement NWL NWR NET NER SWL SWT Lane Configurations Traffic Vol, veh/h Future Vol, veh/h Conflicting Peds, #/hr Sign Control Stop Stop Free Free Free Free RT Channelized - None - None - None Storage Length Veh in Median Storage, # Grade, % Peak Hour Factor Heavy Vehicles, % Mvmt Flow Major/Minor Minor Major Major2 Conflicting Flow All Stage Stage Critical Hdwy Critical Hdwy Stg Critical Hdwy Stg Follow-up Hdwy Pot Cap- Maneuver Stage Stage Platoon blocked, % Mov Cap- Maneuver Mov Cap-2 Maneuver Stage Stage Approach NW NE SW HCM Control Delay, s HCM LOS A Minor Lane/Major Mvmt NET NERNWLnNWLn2 SWL SWT Capacity (veh/h) HCM Lane V/C Ratio HCM Control Delay (s) HCM Lane LOS - - A A A - HCM 95th %tile Q(veh) SWA Synchro Report 7/4/27 Page 6 34
153 HCM 2 Signalized Intersection Summary MD 8 Erickson : MD 8 & Sheppard Lane Background AM Movement EBL EBT EBR WBL WBT WBR NBL NBT NBR SBL SBT SBR Lane Configurations Traffic Volume (veh/h) Future Volume (veh/h) Number Initial Q (Qb), veh Ped-Bike Adj(A_pbT) Parking Bus, Adj Adj Sat Flow, veh/h/ln Adj Flow Rate, veh/h Adj No. of Lanes Peak Hour Factor Percent Heavy Veh, % Cap, veh/h Arrive On Green Sat Flow, veh/h Grp Volume(v), veh/h Grp Sat Flow(s),veh/h/ln Q Serve(g_s), s Cycle Q Clear(g_c), s Prop In Lane Lane Grp Cap(c), veh/h V/C Ratio(X) Avail Cap(c_a), veh/h HCM Platoon Ratio Upstream Filter(I) Uniform Delay (d), s/veh Incr Delay (d2), s/veh Initial Q Delay(d3),s/veh %ile BackOfQ(95%),veh/ln LnGrp Delay(d),s/veh LnGrp LOS F D C F C B D E Approach Vol, veh/h Approach Delay, s/veh Approach LOS F C D E Timer Assigned Phs Phs Duration (G+Y+Rc), s Change Period (Y+Rc), s Max Green Setting (Gmax), s Max Q Clear Time (g_c+i), s Green Ext Time (p_c), s Intersection Summary HCM 2 Ctrl Delay 58.7 HCM 2 LOS E RH Synchro Report 7/4/27 Page 35
154 HCM 2 Signalized Intersection Summary MD 8 Erickson 2: MD 8 & Hardware Store/Great Star Drive Background AM Movement EBL EBT EBR WBL WBT WBR NBL NBT NBR SBL SBT SBR Lane Configurations Traffic Volume (veh/h) Future Volume (veh/h) Number Initial Q (Qb), veh Ped-Bike Adj(A_pbT) Parking Bus, Adj Adj Sat Flow, veh/h/ln Adj Flow Rate, veh/h Adj No. of Lanes Peak Hour Factor Percent Heavy Veh, % Cap, veh/h Arrive On Green Sat Flow, veh/h Grp Volume(v), veh/h Grp Sat Flow(s),veh/h/ln Q Serve(g_s), s Cycle Q Clear(g_c), s Prop In Lane Lane Grp Cap(c), veh/h V/C Ratio(X) Avail Cap(c_a), veh/h HCM Platoon Ratio Upstream Filter(I) Uniform Delay (d), s/veh Incr Delay (d2), s/veh Initial Q Delay(d3),s/veh %ile BackOfQ(95%),veh/ln LnGrp Delay(d),s/veh LnGrp LOS B C C A B B A B A Approach Vol, veh/h Approach Delay, s/veh Approach LOS B C B A Timer Assigned Phs Phs Duration (G+Y+Rc), s Change Period (Y+Rc), s Max Green Setting (Gmax), s Max Q Clear Time (g_c+i), s Green Ext Time (p_c), s Intersection Summary HCM 2 Ctrl Delay 5. HCM 2 LOS B Notes User approved volume balancing among the lanes for turning movement. RH Synchro Report 7/4/27 Page 36
155 HCM 2 Signalized Intersection Summary MD 8 Erickson 3: MD 8 & Auto Dr./Signal Bell Ln Background AM Movement EBL EBT EBR WBL WBT WBR NBL NBT NBR SBL SBT SBR Lane Configurations Traffic Volume (veh/h) Future Volume (veh/h) Number Initial Q (Qb), veh Ped-Bike Adj(A_pbT) Parking Bus, Adj Adj Sat Flow, veh/h/ln Adj Flow Rate, veh/h Adj No. of Lanes 2 2 Peak Hour Factor Percent Heavy Veh, % Cap, veh/h Arrive On Green Sat Flow, veh/h Grp Volume(v), veh/h Grp Sat Flow(s),veh/h/ln Q Serve(g_s), s Cycle Q Clear(g_c), s Prop In Lane Lane Grp Cap(c), veh/h V/C Ratio(X) Avail Cap(c_a), veh/h HCM Platoon Ratio Upstream Filter(I) Uniform Delay (d), s/veh Incr Delay (d2), s/veh Initial Q Delay(d3),s/veh %ile BackOfQ(95%),veh/ln LnGrp Delay(d),s/veh LnGrp LOS C C C A A A A A A Approach Vol, veh/h Approach Delay, s/veh Approach LOS C C A A Timer Assigned Phs Phs Duration (G+Y+Rc), s Change Period (Y+Rc), s 5. * Max Green Setting (Gmax), s 9. * Max Q Clear Time (g_c+i), s Green Ext Time (p_c), s Intersection Summary HCM 2 Ctrl Delay 8.6 HCM 2 LOS A Notes * HCM 2 computational engine requires equal clearance times for the phases crossing the barrier. RH Synchro Report 7/4/27 Page 37
156 HCM Signalized Intersection Capacity Analysis MD 8 Erickson 4: MD 8 & MD 32 WB Ramps Background AM Movement EBL EBT EBR WBL WBT WBR NBL NBT NBR SBL SBT SBR Lane Configurations Traffic Volume (vph) Future Volume (vph) Ideal Flow (vphpl) Total Lost time (s) Lane Util. Factor Frt Flt Protected Satd. Flow (prot) Flt Permitted Satd. Flow (perm) Peak-hour factor, PHF Adj. Flow (vph) RTOR Reduction (vph) 7 Lane Group Flow (vph) Turn Type Perm NA Perm custom NA NA Protected Phases Permitted Phases Actuated Green, G (s) Effective Green, g (s) Actuated g/c Ratio Clearance Time (s) Vehicle Extension (s) Lane Grp Cap (vph) v/s Ratio Prot. c.2 c.3 v/s Ratio Perm.5.5 c.23.7 v/c Ratio Uniform Delay, d Progression Factor Incremental Delay, d Delay (s) Level of Service D D D C A C Approach Delay (s) Approach LOS A D B C Intersection Summary HCM 2 Control Delay 23.6 HCM 2 Level of Service C HCM 2 Volume to Capacity ratio.6 Actuated Cycle Length (s) 2. Sum of lost time (s) 9. Intersection Capacity Utilization 6.% ICU Level of Service B Analysis Period (min) 5 c Critical Lane Group RH Synchro Report 7/4/27 Page 38
157 HCM 2 TWSC MD 8 Erickson 6: MD 8 & Gas Station/Linden Linthicum Lane Background AM Intersection Int Delay, s/veh 62.8 Movement EBL EBT EBR WBL WBT WBR NBL NBT NBR SBL SBT SBR Lane Configurations Traffic Vol, veh/h Future Vol, veh/h Conflicting Peds, #/hr Sign Control Stop Stop Stop Stop Stop Stop Free Free Free Free Free Free RT Channelized - - None - - None - - Free - - None Storage Length Veh in Median Storage, # Grade, % Peak Hour Factor Heavy Vehicles, % Mvmt Flow Major/Minor Minor2 Minor Major Major2 Conflicting Flow All Stage Stage Critical Hdwy Critical Hdwy Stg Critical Hdwy Stg Follow-up Hdwy Pot Cap- Maneuver ~ Stage Stage Platoon blocked, % Mov Cap- Maneuver ~ ~ Mov Cap-2 Maneuver ~ ~ Stage Stage Approach EB WB NB SB HCM Control Delay, s $ HCM LOS F F Minor Lane/Major Mvmt NBL NBT EBLnWBLnWBLn2 SBL SBT SBR Capacity (veh/h) HCM Lane V/C Ratio HCM Control Delay (s) 3.2 $ $ HCM Lane LOS B - F F E B - - HCM 95th %tile Q(veh) Notes ~: Volume exceeds capacity $: Delay exceeds 3s +: Computation Not Defined *: All major volume in platoon RH Synchro Report 7/4/27 Page 5 39
158 HCM 2 TWSC MD 8 Erickson 7: MD 8 & Garden Center Background AM Intersection Int Delay, s/veh. Movement NWL NWR NET NER SWL SWT Lane Configurations Traffic Vol, veh/h Future Vol, veh/h Conflicting Peds, #/hr Sign Control Stop Stop Free Free Free Free RT Channelized - None - None - None Storage Length Veh in Median Storage, # Grade, % Peak Hour Factor Heavy Vehicles, % Mvmt Flow Major/Minor Minor Major Major2 Conflicting Flow All Stage Stage Critical Hdwy Critical Hdwy Stg Critical Hdwy Stg Follow-up Hdwy Pot Cap- Maneuver Stage Stage Platoon blocked, % Mov Cap- Maneuver Mov Cap-2 Maneuver Stage Stage Approach NW NE SW HCM Control Delay, s 7.7 HCM LOS C Minor Lane/Major Mvmt NET NERNWLnNWLn2 SWL SWT Capacity (veh/h) HCM Lane V/C Ratio HCM Control Delay (s) HCM Lane LOS - - A C A - HCM 95th %tile Q(veh) RH Synchro Report 7/4/27 Page 6 4
159 HCM 2 Signalized Intersection Summary MD 8 Erickson : MD 8 & Sheppard Lane Background PM Movement EBL EBT EBR WBL WBT WBR NBL NBT NBR SBL SBT SBR Lane Configurations Traffic Volume (veh/h) Future Volume (veh/h) Number Initial Q (Qb), veh Ped-Bike Adj(A_pbT) Parking Bus, Adj Adj Sat Flow, veh/h/ln Adj Flow Rate, veh/h Adj No. of Lanes Peak Hour Factor Percent Heavy Veh, % Cap, veh/h Arrive On Green Sat Flow, veh/h Grp Volume(v), veh/h Grp Sat Flow(s),veh/h/ln Q Serve(g_s), s Cycle Q Clear(g_c), s Prop In Lane Lane Grp Cap(c), veh/h V/C Ratio(X) Avail Cap(c_a), veh/h HCM Platoon Ratio Upstream Filter(I) Uniform Delay (d), s/veh Incr Delay (d2), s/veh Initial Q Delay(d3),s/veh %ile BackOfQ(95%),veh/ln LnGrp Delay(d),s/veh LnGrp LOS E E D E B A C E Approach Vol, veh/h Approach Delay, s/veh Approach LOS E D C E Timer Assigned Phs Phs Duration (G+Y+Rc), s Change Period (Y+Rc), s * 5 Max Green Setting (Gmax), s * 4 Max Q Clear Time (g_c+i), s Green Ext Time (p_c), s Intersection Summary HCM 2 Ctrl Delay 44. HCM 2 LOS D Notes * HCM 2 computational engine requires equal clearance times for the phases crossing the barrier. RH Synchro Report 7/4/27 Page 4
160 HCM 2 Signalized Intersection Summary MD 8 Erickson 2: MD 8 & Hardware Store/Great Star Drive Background PM Movement EBL EBT EBR WBL WBT WBR NBL NBT NBR SBL SBT SBR Lane Configurations Traffic Volume (veh/h) Future Volume (veh/h) Number Initial Q (Qb), veh Ped-Bike Adj(A_pbT) Parking Bus, Adj Adj Sat Flow, veh/h/ln Adj Flow Rate, veh/h Adj No. of Lanes Peak Hour Factor Percent Heavy Veh, % Cap, veh/h Arrive On Green Sat Flow, veh/h Grp Volume(v), veh/h Grp Sat Flow(s),veh/h/ln Q Serve(g_s), s Cycle Q Clear(g_c), s Prop In Lane Lane Grp Cap(c), veh/h V/C Ratio(X) Avail Cap(c_a), veh/h HCM Platoon Ratio Upstream Filter(I) Uniform Delay (d), s/veh Incr Delay (d2), s/veh Initial Q Delay(d3),s/veh %ile BackOfQ(95%),veh/ln LnGrp Delay(d),s/veh LnGrp LOS C C F B C C C B B Approach Vol, veh/h Approach Delay, s/veh Approach LOS C F C B Timer Assigned Phs Phs Duration (G+Y+Rc), s Change Period (Y+Rc), s Max Green Setting (Gmax), 5.5s Max Q Clear Time (g_c+i), 2.6s Green Ext Time (p_c), s Intersection Summary HCM 2 Ctrl Delay 44.2 HCM 2 LOS D Notes User approved volume balancing among the lanes for turning movement. RH Synchro Report 7/4/27 Page 2 42
161 HCM 2 Signalized Intersection Summary MD 8 Erickson 3: MD 8 & Auto Dr./Signal Bell Ln Background PM Movement EBL EBT EBR WBL WBT WBR NBL NBT NBR SBL SBT SBR Lane Configurations Traffic Volume (veh/h) Future Volume (veh/h) Number Initial Q (Qb), veh Ped-Bike Adj(A_pbT) Parking Bus, Adj Adj Sat Flow, veh/h/ln Adj Flow Rate, veh/h Adj No. of Lanes 2 2 Peak Hour Factor Percent Heavy Veh, % Cap, veh/h Arrive On Green Sat Flow, veh/h Grp Volume(v), veh/h Grp Sat Flow(s),veh/h/ln Q Serve(g_s), s Cycle Q Clear(g_c), s Prop In Lane Lane Grp Cap(c), veh/h V/C Ratio(X) Avail Cap(c_a), veh/h HCM Platoon Ratio Upstream Filter(I) Uniform Delay (d), s/veh Incr Delay (d2), s/veh Initial Q Delay(d3),s/veh %ile BackOfQ(95%),veh/ln LnGrp Delay(d),s/veh LnGrp LOS C D D A B B A B B Approach Vol, veh/h Approach Delay, s/veh Approach LOS C D B B Timer Assigned Phs Phs Duration (G+Y+Rc), s Change Period (Y+Rc), s Max Green Setting (Gmax), 4.5s Max Q Clear Time (g_c+i), 4.s Green Ext Time (p_c), s Intersection Summary HCM 2 Ctrl Delay 4.6 HCM 2 LOS B RH Synchro Report 7/4/27 Page 3 43
162 HCM Signalized Intersection Capacity Analysis MD 8 Erickson 4: MD 8 & MD 32 WB Ramps Background PM Movement EBL EBT EBR WBL WBT WBR NBL NBT NBR SBL SBT SBR Lane Configurations Traffic Volume (vph) Future Volume (vph) Ideal Flow (vphpl) Total Lost time (s) Lane Util. Factor Frt Flt Protected Satd. Flow (prot) Flt Permitted Satd. Flow (perm) Peak-hour factor, PHF Adj. Flow (vph) RTOR Reduction (vph) 9 Lane Group Flow (vph) Turn Type Perm NA Perm custom NA NA Protected Phases Permitted Phases Actuated Green, G (s) Effective Green, g (s) Actuated g/c Ratio Clearance Time (s) Vehicle Extension (s) Lane Grp Cap (vph) v/s Ratio Prot.3 c.27 c.36 v/s Ratio Perm.28.3 c.32.5 v/c Ratio Uniform Delay, d Progression Factor Incremental Delay, d Delay (s) Level of Service D D D D B D Approach Delay (s) Approach LOS A D C D Intersection Summary HCM 2 Control Delay 36.7 HCM 2 Level of Service D HCM 2 Volume to Capacity ratio.77 Actuated Cycle Length (s) 5. Sum of lost time (s) 9. Intersection Capacity Utilization 79.8% ICU Level of Service D Analysis Period (min) 5 c Critical Lane Group RH Synchro Report 7/4/27 Page 44
163 HCM 2 TWSC MD 8 Erickson 6: MD 8 & Gas Station/Linden Linthicum Lane Background PM Intersection Int Delay, s/veh 86.8 Movement EBL EBT EBR WBL WBT WBR NBL NBT NBR SBL SBT SBR Lane Configurations Traffic Vol, veh/h Future Vol, veh/h Conflicting Peds, #/hr Sign Control Stop Stop Stop Stop Stop Stop Free Free Free Free Free Free RT Channelized - - None - - None - - Free - - None Storage Length Veh in Median Storage, # Grade, % Peak Hour Factor Heavy Vehicles, % Mvmt Flow Major/Minor Minor2 Minor Major Major2 Conflicting Flow All Stage Stage Critical Hdwy Critical Hdwy Stg Critical Hdwy Stg Follow-up Hdwy Pot Cap- Maneuver ~ ~ 8 ~ Stage Stage Platoon blocked, % Mov Cap- Maneuver ~ 5 4 ~ Mov Cap-2 Maneuver ~ Stage Stage Approach EB WB NB SB HCM Control Delay, s $ HCM LOS - F Minor Lane/Major Mvmt NBL NBT EBLnWBLnWBLn2 SBL SBT SBR Capacity (veh/h) HCM Lane V/C Ratio HCM Control Delay (s).9 - $ $ HCM Lane LOS B - - F F C - - HCM 95th %tile Q(veh) Notes ~: Volume exceeds capacity $: Delay exceeds 3s +: Computation Not Defined *: All major volume in platoon RH Synchro Report 7/4/27 Page 5 45
164 HCM 2 TWSC MD 8 Erickson 7: MD 8 & Garden Center Background PM Intersection Int Delay, s/veh.3 Movement NWL NWR NET NER SWL SWT Lane Configurations Traffic Vol, veh/h Future Vol, veh/h Conflicting Peds, #/hr Sign Control Stop Stop Free Free Free Free RT Channelized - None - None - None Storage Length Veh in Median Storage, # Grade, % Peak Hour Factor Heavy Vehicles, % Mvmt Flow Major/Minor Minor Major Major2 Conflicting Flow All Stage Stage Critical Hdwy Critical Hdwy Stg Critical Hdwy Stg Follow-up Hdwy Pot Cap- Maneuver Stage Stage Platoon blocked, % Mov Cap- Maneuver Mov Cap-2 Maneuver Stage Stage Approach NW NE SW HCM Control Delay, s 38.2 HCM LOS E Minor Lane/Major Mvmt NET NERNWLnNWLn2 SWL SWT Capacity (veh/h) HCM Lane V/C Ratio HCM Control Delay (s) HCM Lane LOS - - A E A - HCM 95th %tile Q(veh) RH Synchro Report 7/4/27 Page 6 46
165 HCM 2 Signalized Intersection Summary MD 8 Erickson : MD 8 & Sheppard Lane 223 Total AM w/improvement & Traffic Adjustment Movement EBL EBT EBR WBL WBT WBR NBL NBT NBR SBL SBT SBR Lane Configurations Traffic Volume (veh/h) Future Volume (veh/h) Number Initial Q (Qb), veh Ped-Bike Adj(A_pbT) Parking Bus, Adj Adj Sat Flow, veh/h/ln Adj Flow Rate, veh/h Adj No. of Lanes 2 Peak Hour Factor Percent Heavy Veh, % Cap, veh/h Arrive On Green Sat Flow, veh/h Grp Volume(v), veh/h Grp Sat Flow(s),veh/h/ln Q Serve(g_s), s Cycle Q Clear(g_c), s Prop In Lane Lane Grp Cap(c), veh/h V/C Ratio(X) Avail Cap(c_a), veh/h HCM Platoon Ratio Upstream Filter(I) Uniform Delay (d), s/veh Incr Delay (d2), s/veh Initial Q Delay(d3),s/veh %ile BackOfQ(5%),veh/ln LnGrp Delay(d),s/veh LnGrp LOS C D D D B C C C C Approach Vol, veh/h Approach Delay, s/veh Approach LOS D D C C Timer Assigned Phs Phs Duration (G+Y+Rc), s Change Period (Y+Rc), s Max Green Setting (Gmax), s Max Q Clear Time (g_c+i), s Green Ext Time (p_c), s Intersection Summary HCM 2 Ctrl Delay 3.8 HCM 2 LOS C RH Synchro Report 7/26/27 Page 47
166 HCM 2 Signalized Intersection Summary MD 8 Erickson 2: MD 8 & Hardware Store/Great Star Drive 223 Total AM w/improvement & Traffic Adjustment Movement EBL EBT EBR WBL WBT WBR NBL NBT NBR SBL SBT SBR Lane Configurations Traffic Volume (veh/h) Future Volume (veh/h) Number Initial Q (Qb), veh Ped-Bike Adj(A_pbT) Parking Bus, Adj Adj Sat Flow, veh/h/ln Adj Flow Rate, veh/h Adj No. of Lanes Peak Hour Factor Percent Heavy Veh, % Cap, veh/h Arrive On Green Sat Flow, veh/h Grp Volume(v), veh/h Grp Sat Flow(s),veh/h/ln Q Serve(g_s), s Cycle Q Clear(g_c), s Prop In Lane Lane Grp Cap(c), veh/h V/C Ratio(X) Avail Cap(c_a), veh/h HCM Platoon Ratio Upstream Filter(I) Uniform Delay (d), s/veh Incr Delay (d2), s/veh Initial Q Delay(d3),s/veh %ile BackOfQ(5%),veh/ln LnGrp Delay(d),s/veh LnGrp LOS D C D B B B B B B Approach Vol, veh/h Approach Delay, s/veh Approach LOS D C B B Timer Assigned Phs Phs Duration (G+Y+Rc), s Change Period (Y+Rc), s Max Green Setting (Gmax), 8.s Max Q Clear Time (g_c+i), 8.s Green Ext Time (p_c), s Intersection Summary HCM 2 Ctrl Delay 7.3 HCM 2 LOS B Notes User approved volume balancing among the lanes for turning movement. RH Synchro Report 7/4/27 Page 2 48
167 HCM 2 Signalized Intersection Summary MD 8 Erickson 3: MD 8 & Auto Dr./Signal Bell Ln 223 Total AM w/improvement & Traffic Adjustment Movement EBL EBT EBR WBL WBT WBR NBL NBT NBR SBL SBT SBR Lane Configurations Traffic Volume (veh/h) Future Volume (veh/h) Number Initial Q (Qb), veh Ped-Bike Adj(A_pbT) Parking Bus, Adj Adj Sat Flow, veh/h/ln Adj Flow Rate, veh/h Adj No. of Lanes 2 2 Peak Hour Factor Percent Heavy Veh, % Cap, veh/h Arrive On Green Sat Flow, veh/h Grp Volume(v), veh/h Grp Sat Flow(s),veh/h/ln Q Serve(g_s), s Cycle Q Clear(g_c), s Prop In Lane Lane Grp Cap(c), veh/h V/C Ratio(X) Avail Cap(c_a), veh/h HCM Platoon Ratio Upstream Filter(I) Uniform Delay (d), s/veh Incr Delay (d2), s/veh Initial Q Delay(d3),s/veh %ile BackOfQ(5%),veh/ln LnGrp Delay(d),s/veh LnGrp LOS C C C A A A A A A Approach Vol, veh/h Approach Delay, s/veh Approach LOS C C A A Timer Assigned Phs Phs Duration (G+Y+Rc), s Change Period (Y+Rc), s Max Green Setting (Gmax), 5.s Max Q Clear Time (g_c+i), 4.3s Green Ext Time (p_c), s Intersection Summary HCM 2 Ctrl Delay 8.3 HCM 2 LOS A RH Synchro Report 7/4/27 Page 3 49
168 HCM 2 Signalized Intersection Summary MD 8 Erickson 4: MD 32 WB Ramp & MD Total AM w/improvement & Traffic Adjustment Movement EBL EBT EBR WBL WBT WBR NBL NBT NBR SBL SBT SBR Lane Configurations Traffic Volume (veh/h) Future Volume (veh/h) Number Initial Q (Qb), veh Ped-Bike Adj(A_pbT) Parking Bus, Adj Adj Sat Flow, veh/h/ln Adj Flow Rate, veh/h Adj No. of Lanes Peak Hour Factor Percent Heavy Veh, % Cap, veh/h Arrive On Green Sat Flow, veh/h Grp Volume(v), veh/h Grp Sat Flow(s),veh/h/ln Q Serve(g_s), s Cycle Q Clear(g_c), s Prop In Lane Lane Grp Cap(c), veh/h V/C Ratio(X) Avail Cap(c_a), veh/h HCM Platoon Ratio Upstream Filter(I) Uniform Delay (d), s/veh Incr Delay (d2), s/veh Initial Q Delay(d3),s/veh %ile BackOfQ(5%),veh/ln LnGrp Delay(d),s/veh LnGrp LOS C C B B C C Approach Vol, veh/h Approach Delay, s/veh Approach LOS C B C Timer Assigned Phs Phs Duration (G+Y+Rc), s Change Period (Y+Rc), s Max Green Setting (Gmax), s Max Q Clear Time (g_c+i), s Green Ext Time (p_c), s Intersection Summary HCM 2 Ctrl Delay 22. HCM 2 LOS C Notes User approved volume balancing among the lanes for turning movement. RH Synchro Report 7/4/27 Page 4 5
169 HCM 2 Signalized Intersection Summary MD 8 Erickson 6: MD 8 & New Road/Linden Linthicum Lane 223 Total AM w/improvement & Traffic Adjustment Movement EBL EBT EBR WBL WBT WBR NBL NBT NBR SBL SBT SBR Lane Configurations Traffic Volume (veh/h) Future Volume (veh/h) Number Initial Q (Qb), veh Ped-Bike Adj(A_pbT) Parking Bus, Adj Adj Sat Flow, veh/h/ln Adj Flow Rate, veh/h Adj No. of Lanes 2 2 Peak Hour Factor Percent Heavy Veh, % Cap, veh/h Arrive On Green Sat Flow, veh/h Grp Volume(v), veh/h Grp Sat Flow(s),veh/h/ln Q Serve(g_s), s Cycle Q Clear(g_c), s Prop In Lane Lane Grp Cap(c), veh/h V/C Ratio(X) Avail Cap(c_a), veh/h HCM Platoon Ratio Upstream Filter(I) Uniform Delay (d), s/veh Incr Delay (d2), s/veh Initial Q Delay(d3),s/veh %ile BackOfQ(5%),veh/ln LnGrp Delay(d),s/veh LnGrp LOS C B B B A A A A B B Approach Vol, veh/h Approach Delay, s/veh Approach LOS B B A B Timer Assigned Phs Phs Duration (G+Y+Rc), s Change Period (Y+Rc), s Max Green Setting (Gmax), s Max Q Clear Time (g_c+i), s Green Ext Time (p_c), s Intersection Summary HCM 2 Ctrl Delay.8 HCM 2 LOS B RH Synchro Report 7/27/27 Page 5
170 HCM 2 TWSC MD 8 Erickson 7: MD 8 & Garden Center 223 Total AM w/improvement & Traffic Adjustment Intersection Int Delay, s/veh. Movement EBL EBT EBR WBL WBT WBR NBL NBT NBR SBL SBT SBR Lane Configurations Traffic Vol, veh/h Future Vol, veh/h Conflicting Peds, #/hr Sign Control Stop Stop Stop Stop Stop Stop Free Free Free Free Free Free RT Channelized - - Free - - Free - - Free - - None Storage Length Veh in Median Storage, # Grade, % Peak Hour Factor Heavy Vehicles, % Mvmt Flow Major/Minor Minor2 Minor Major Major2 Conflicting Flow All Stage Stage Critical Hdwy Critical Hdwy Stg Critical Hdwy Stg Follow-up Hdwy Pot Cap- Maneuver Stage Stage Platoon blocked, % Mov Cap- Maneuver Mov Cap-2 Maneuver Stage Stage Approach EB WB NB SB HCM Control Delay, s.3 HCM LOS A A Minor Lane/Major Mvmt NBL NBT EBLnWBLn SBT SBR Capacity (veh/h) HCM Lane V/C Ratio HCM Control Delay (s) HCM Lane LOS B - A A - - HCM 95th %tile Q(veh) RH Synchro Report 7/26/27 Page 52
171 HCM 2 Signalized Intersection Summary MD 8 Erickson : MD 8 & Sheppard Lane Total PM w/improvement Movement EBL EBT EBR WBL WBT WBR NBL NBT NBR SBL SBT SBR Lane Configurations Traffic Volume (veh/h) Future Volume (veh/h) Number Initial Q (Qb), veh Ped-Bike Adj(A_pbT) Parking Bus, Adj Adj Sat Flow, veh/h/ln Adj Flow Rate, veh/h Adj No. of Lanes 2 Peak Hour Factor Percent Heavy Veh, % Cap, veh/h Arrive On Green Sat Flow, veh/h Grp Volume(v), veh/h Grp Sat Flow(s),veh/h/ln Q Serve(g_s), s Cycle Q Clear(g_c), s Prop In Lane Lane Grp Cap(c), veh/h V/C Ratio(X) Avail Cap(c_a), veh/h HCM Platoon Ratio Upstream Filter(I) Uniform Delay (d), s/veh Incr Delay (d2), s/veh Initial Q Delay(d3),s/veh %ile BackOfQ(5%),veh/ln LnGrp Delay(d),s/veh LnGrp LOS D D E D C C C C C Approach Vol, veh/h Approach Delay, s/veh Approach LOS D D C C Timer Assigned Phs Phs Duration (G+Y+Rc), s Change Period (Y+Rc), s Max Green Setting (Gmax), s Max Q Clear Time (g_c+i), s Green Ext Time (p_c), s Intersection Summary HCM 2 Ctrl Delay 3.7 HCM 2 LOS C RH Synchro Report 7/26/27 Page 53
172 HCM 2 Signalized Intersection Summary MD 8 Erickson 2: MD 8 & Hardware Store/Great Star Drive Total PM w/improvement Movement EBL EBT EBR WBL WBT WBR NBL NBT NBR SBL SBT SBR Lane Configurations Traffic Volume (veh/h) Future Volume (veh/h) Number Initial Q (Qb), veh Ped-Bike Adj(A_pbT) Parking Bus, Adj Adj Sat Flow, veh/h/ln Adj Flow Rate, veh/h Adj No. of Lanes Peak Hour Factor Percent Heavy Veh, % Cap, veh/h Arrive On Green Sat Flow, veh/h Grp Volume(v), veh/h Grp Sat Flow(s),veh/h/ln Q Serve(g_s), s Cycle Q Clear(g_c), s Prop In Lane Lane Grp Cap(c), veh/h V/C Ratio(X) Avail Cap(c_a), veh/h HCM Platoon Ratio Upstream Filter(I) Uniform Delay (d), s/veh Incr Delay (d2), s/veh Initial Q Delay(d3),s/veh %ile BackOfQ(5%),veh/ln LnGrp Delay(d),s/veh LnGrp LOS E D F C D E E C C Approach Vol, veh/h Approach Delay, s/veh Approach LOS E E D C Timer Assigned Phs Phs Duration (G+Y+Rc), s Change Period (Y+Rc), s Max Green Setting (Gmax), s Max Q Clear Time (g_c+i), s Green Ext Time (p_c), s Intersection Summary HCM 2 Ctrl Delay 5.7 HCM 2 LOS D Notes User approved volume balancing among the lanes for turning movement. RH Synchro Report 7/4/27 Page 2 54
173 HCM 2 Signalized Intersection Summary MD 8 Erickson 3: MD 8 & Auto Dr./Signal Bell Ln Total PM w/improvement Movement EBL EBT EBR WBL WBT WBR NBL NBT NBR SBL SBT SBR Lane Configurations Traffic Volume (veh/h) Future Volume (veh/h) Number Initial Q (Qb), veh Ped-Bike Adj(A_pbT) Parking Bus, Adj Adj Sat Flow, veh/h/ln Adj Flow Rate, veh/h Adj No. of Lanes 2 2 Peak Hour Factor Percent Heavy Veh, % Cap, veh/h Arrive On Green Sat Flow, veh/h Grp Volume(v), veh/h Grp Sat Flow(s),veh/h/ln Q Serve(g_s), s Cycle Q Clear(g_c), s Prop In Lane Lane Grp Cap(c), veh/h V/C Ratio(X) Avail Cap(c_a), veh/h HCM Platoon Ratio Upstream Filter(I) Uniform Delay (d), s/veh Incr Delay (d2), s/veh Initial Q Delay(d3),s/veh %ile BackOfQ(5%),veh/ln LnGrp Delay(d),s/veh LnGrp LOS D D D A B B A B B Approach Vol, veh/h Approach Delay, s/veh Approach LOS D D B B Timer Assigned Phs Phs Duration (G+Y+Rc), s Change Period (Y+Rc), s Max Green Setting (Gmax), s Max Q Clear Time (g_c+i), s Green Ext Time (p_c), s Intersection Summary HCM 2 Ctrl Delay 5.2 HCM 2 LOS B RH Synchro Report 7/4/27 Page 3 55
174 HCM 2 Signalized Intersection Summary MD 8 Erickson 4: MD 8 & MD 32 WB Ramps Total PM w/improvement Movement EBL EBT EBR WBL WBT WBR NBL NBT NBR SBL SBT SBR Lane Configurations Traffic Volume (veh/h) Future Volume (veh/h) Number Initial Q (Qb), veh Ped-Bike Adj(A_pbT) Parking Bus, Adj Adj Sat Flow, veh/h/ln Adj Flow Rate, veh/h Adj No. of Lanes Peak Hour Factor Percent Heavy Veh, % Cap, veh/h Arrive On Green Sat Flow, veh/h Grp Volume(v), veh/h Grp Sat Flow(s),veh/h/ln Q Serve(g_s), s Cycle Q Clear(g_c), s Prop In Lane Lane Grp Cap(c), veh/h V/C Ratio(X) Avail Cap(c_a), veh/h HCM Platoon Ratio Upstream Filter(I) Uniform Delay (d), s/veh Incr Delay (d2), s/veh Initial Q Delay(d3),s/veh %ile BackOfQ(5%),veh/ln LnGrp Delay(d),s/veh LnGrp LOS D D C B C C Approach Vol, veh/h Approach Delay, s/veh Approach LOS D B C Timer Assigned Phs Phs Duration (G+Y+Rc), s Change Period (Y+Rc), s Max Green Setting (Gmax), s Max Q Clear Time (g_c+i), s Green Ext Time (p_c), s Intersection Summary HCM 2 Ctrl Delay 32.7 HCM 2 LOS C Notes User approved volume balancing among the lanes for turning movement. RH Synchro Report 7/4/27 Page 56
175 HCM 2 Signalized Intersection Summary MD 8 Erickson 6: MD 8 & New Road/Linden Linthicum Lane Total PM w/improvement Movement EBL EBT EBR WBL WBT WBR NBL NBT NBR SBL SBT SBR Lane Configurations Traffic Volume (veh/h) Future Volume (veh/h) Number Initial Q (Qb), veh Ped-Bike Adj(A_pbT) Parking Bus, Adj Adj Sat Flow, veh/h/ln Adj Flow Rate, veh/h Adj No. of Lanes 2 2 Peak Hour Factor Percent Heavy Veh, % Cap, veh/h Arrive On Green Sat Flow, veh/h Grp Volume(v), veh/h Grp Sat Flow(s),veh/h/ln Q Serve(g_s), s Cycle Q Clear(g_c), s Prop In Lane Lane Grp Cap(c), veh/h V/C Ratio(X) Avail Cap(c_a), veh/h HCM Platoon Ratio Upstream Filter(I) Uniform Delay (d), s/veh Incr Delay (d2), s/veh Initial Q Delay(d3),s/veh %ile BackOfQ(5%),veh/ln LnGrp Delay(d),s/veh LnGrp LOS D C C C A B B B B B Approach Vol, veh/h Approach Delay, s/veh Approach LOS C C B B Timer Assigned Phs Phs Duration (G+Y+Rc), s Change Period (Y+Rc), s Max Green Setting (Gmax), s Max Q Clear Time (g_c+i), s Green Ext Time (p_c), s Intersection Summary HCM 2 Ctrl Delay 8.2 HCM 2 LOS B RH Synchro Report 7/27/27 Page 57
176 HCM 2 TWSC MD 8 Erickson 7: MD 8 & Garden Center Total PM w/improvement Intersection Int Delay, s/veh. Movement EBL EBT EBR WBL WBT WBR NBL NBT NBR SBL SBT SBR Lane Configurations Traffic Vol, veh/h Future Vol, veh/h Conflicting Peds, #/hr Sign Control Stop Stop Stop Stop Stop Stop Free Free Free Free Free Free RT Channelized - - Free - - Free - - Free - - None Storage Length Veh in Median Storage, # Grade, % Peak Hour Factor Heavy Vehicles, % Mvmt Flow Major/Minor Minor2 Minor Major Major2 Conflicting Flow All Stage Stage Critical Hdwy Critical Hdwy Stg Critical Hdwy Stg Follow-up Hdwy Pot Cap- Maneuver Stage Stage Platoon blocked, % Mov Cap- Maneuver Mov Cap-2 Maneuver Stage Stage Approach EB WB NB SB HCM Control Delay, s. HCM LOS A A Minor Lane/Major Mvmt NBL NBT EBLnWBLn SBT SBR Capacity (veh/h) HCM Lane V/C Ratio HCM Control Delay (s) HCM Lane LOS B - A A - - HCM 95th %tile Q(veh) RH Synchro Report 7/26/27 Page 58

177 APPENDIX F Crash Data MD SHA
178 MARYLAND STATE HIGHWAY ADMINISTRATION => 3246 Office of Traffic and Safety -- Traffic Development & Support Division SHA (Rev. 6/26/6) Date : 6/29/27 To : Department : Mr. Buck Bohmer Howard County Dept of Public Works Subject : Accident Data / Analysis Location ( s ) : County : Howard Town / Place : Clarksville Route : MD 8 Log Mile (s) : Various X at Multiple Locations from to Attached is the accident data/analysis you requested in your of: 6/27/27. Specifically, we are providing the following data for the subject location: X Accident Summary X Accident History Accident Rates X Study Worksheet X Collision/Line Diagram Other One Year Two Years Three Years No reported Accidents X //23 to 2/3/26 X Combined Comments: Should you have any questions, please contact me at (4) Sincerely, Robert L. Booker, Jr. For Crash Analysis Safety Team Traffic Development & Support Division cc's: Mr. George Miller

179 2

180 feet meters 5 3
181 Maryland State Highway Administration Office of Traffic and Safety - Traffic Development and Support Division SHA 52. ADC Study Worksheet Output rev. 4/26- Name: Robert Booker Date: 6/28/27 Location: MD SHEPPARD LN Logmiles: 4.49 At 2.73 Radius: 5 ft. County: Howard, D7 Period: January, 23 To December 3, 26 Note: Year 26 data may be incomplete and unedited YEAR >> Total Fatal No. Killed Injury 2 2 No. Injured 2 2 Prop. Damage 2 Total Crashes 2 4 Severity Index 8 Avg 3 Opposite Dir. Rear End Sideswipe Left Turn Angle Pedestrian Parked Veh. Fixed Object Other 2 U-Turn Backing Animal Railroad Fire / Expl. Overturn 2 Truck Related Night Time Wet Surface Alcohol Intersection 2 4 Total Vehicles Total Trucks Truck %..... Comments: 4
182 Maryland State Highway Administration Office of Traffic and Safety - Traffic Development and Support Division SHA 52. ADC Summary Output rev. 4/26- Name: Robert Booker Date: 6/28/27 Location: MD SHEPPARD LN Logmiles: 4.49 At 2.73 Radius: 5 ft. County: Howard, D7 Period: January, 23 To December 3, 26 Note: Year 26 data may be incomplete and unedited SEVERITY FATAL INJURY P-DAMAGE TOTAL DAY OF THE WEEK Accidents Veh Occ Pedestrian AVG Severity Index: 3 4 SUN MON TUE WED THU 2 FRI SAT UNK MONTH OF THE YEAR JAN FEB MAR APR MAY JUN JUL AUG SEP OCT NOV DEC UNK CONDITION Normal: Alcohol: Other: DRIVER 7 PED TIME AM: PM: UNK VEHICLES INVOLVED PER ACCIDENT UNK TOTAL 4 8 VEHICLE TYPE SURFACE MOVEMENTS Motorcycle/Moped Tractor Trailer Wet NORTH SOUTH EAST WEST 5 Passenger Vehicle Sport Utility Veh Passenger Bus School Bus 4 Dry Sno/Ice LF ST RT LF ST RT LF ST 2 RT LF ST RT Pick-Up Truck Emergency Veh Mud Trucks (2+3 axles) Other Types Other OTHER MOVEMENTS 2 PROBABLE CAUSES COLLISION TYPES FATAL INJURY PROP TOTAL Influence of Drugs Improper Lane Change Opposite Dir Related: Influence of Alcohol Improper Backing UnRelated: Influence of Medication Influence of Combined Subst. Improper Passing Improper Signal Rear End Related: UnRelated: Physical/Mental Difficulty Fell Asleep/Fainted, etc. Improper Parking Passenger Interfere/Obstruct. Sideswipe Related: UnRelated: Fail to give full Attention Illegally in Roadway Left Turn Related: UnRelated: Lic. Restr. Non-compliance Bicycle Violation Angle Related: Fail to Drive in Single Lane Clothing Not Visible UnRelated: Improper Right Turn on Red Sleet, Hail, Freezing Rain Pedestrian Related: Fail to Yield Right-of-way Severe Crosswinds UnRelated: Fail to Obey Stop Sign Fail to Obey Traffic Signal Rain, Snow Animal Parked Vehicle Related: UnRelated: Fail to Obey Other Control Fail to Keep Right of Center Vision Obstruction Vehicle Defect Other Collision Related: UnRelated: 2 2 Fail to Stop for School Bus Wrong Way on One Way Exceeded Speed Limit Operator Using Cell Phone Stopping in Lane Roadway Too Fast for Conditions Followed too Closely Improper Turn Wet Icy or Snow Covered Debris or Obstruction Ruts, Holes or Bumps Road Under Construction Traffic Control Device Inop. Shoulders Low, Soft or High Other or Unknown F I X E D O B J Bridge Building Culvert/Ditch Curb Guardrail/Barrier Embankment Fence Light Pole Sign Pole WEATHER ILLUMINATION TOTALS E Other Pole 4 Clear / Cloudy 3 Day Foggy Dawn/Dusk C Tree/Shrubbery Raining Snow / Sleet Dark - Lights On Dark - No Lights T S Contr. Barrier Crash Attenuator 2 3 Other Other Other Fixed Object 5
183 Maryland State Highway Administration Name: Robert Booker Office of Traffic and Safety - Traffic Development and Support Division Date: 6/28/27 SHA 52. ADC History Output rev. 5/26- - Combined Year Listing Location: MD SHEPPARD LN Logmiles: 4.49 At 2.73 Radius: 5 ft. County: Howard, D7 Period: January, 23 To December 3, 26 Note: Year 26 data may be incomplete and unedited Movement MilePt Int Rel Date Severity Time Light Surface Alc Rel FixObj Collision V V2 Probable Cause MD Property P Day Dry OTHER Eu ES Improper backing Injured 4P Day Dry ANGLE SR ES Fail to drive in single lane Injured 9P Night Dry LFTRN EL WS Fail to yield right-of-way CO Property 2P Day Dry OTHER SS Su Other or Unknown Fixed Object: = Bridge 2 = Building 3 = Culvert/Ditch 4 = Curb 5 = Guardrail/Barrier 6 = Embankment 7 = Fence 8 = Light Pole 9 = Sign Post = Other Pole = Tree/Shrubbery 2 = Construction Barrier 3 = Crash Attenuator 6 Page of
184 Location: MD Sheppard Lane County: HOWARD Study Period: //23 to Approx. 2/3/26 Analyst: Robert L. Booker, Jr. Date: 6/28/27 SHEPPARD LA 6/2/6-P-2P-D N MARYLAND 8 7/3/4-I-9P-D 3/4/4-I-4P-D /7/3-P-P-D MARYLAND 8 CEMETERY DATE-SEVERITY-TIME-SURFCE NIGHT ALCOHOL DRUGS X X SEVERITY F - Fatalities I - Injured P - Property Damage Only SURFACE D - Dry Surface W - Wet Surface I - Icy Surface S - Snowy Surface - Not Applicable - Bridge or Overpass 2 - Building 3 - Culvert or Ditch 4 - Curb 5 - Guardrail or Barrier 6 - Embankment 7 Fence 8 - Light Support Pole 9 - Sign Support Pole - Other Pole - Tree Shrubbery 2 - Construction Barrier 3 - Crash Attenuator 88 - Other 99 - Unknown B - Bicycle P - Other Pedalcycle C - Other Conveyance T - Railway Train A - Animal O - Other Object S - Spilled Cargo J - Jackknife U - Units Separated N - Other Non collision D - Off Road R - Downhill Runaway F - Explosion or Fire? - Unknown template U - TURN BACKING OVERTURN Parked Vehicle P Pedestrian 7


185 8

186 feet meters 4 9
187 Maryland State Highway Administration Office of Traffic and Safety - Traffic Development and Support Division SHA 52. ADC Study Worksheet Output rev. 4/26- Name: Robert Booker Date: 6/28/27 Location: MD LINDEN LINTHICUM LN Logmiles: 4.22 At Radius: 5 ft. County: Howard, D7 Period: January, 23 To December 3, 26 Note: Year 26 data may be incomplete and unedited YEAR >> Total Fatal No. Killed Injury 2 2 No. Injured 2 2 Prop. Damage 2 2 Total Crashes Severity Index 6 2 Avg 2 Opposite Dir. Rear End Sideswipe Left Turn Angle Pedestrian Parked Veh. Fixed Object Other U-Turn Backing Animal Railroad Fire / Expl. Overturn Truck Related Night Time Wet Surface Alcohol Intersection Total Vehicles Total Trucks Truck %..... Comments:
188 Maryland State Highway Administration Office of Traffic and Safety - Traffic Development and Support Division SHA 52. ADC Summary Output rev. 4/26- Name: Robert Booker Date: 6/28/27 Location: MD LINDEN LINTHICUM LN Logmiles: 4.22 At Radius: 5 ft. County: Howard, D7 Period: January, 23 To December 3, 26 Note: Year 26 data may be incomplete and unedited SEVERITY FATAL INJURY P-DAMAGE TOTAL DAY OF THE WEEK Accidents Veh Occ Pedestrian AVG Severity Index: 2 4 SUN 2 MON TUE WED THU FRI SAT UNK MONTH OF THE YEAR JAN FEB MAR APR MAY JUN JUL AUG SEP OCT NOV DEC UNK 2 CONDITION Normal: Alcohol: Other: DRIVER 7 PED TIME AM: PM: UNK VEHICLES INVOLVED PER ACCIDENT UNK TOTAL 2 8 VEHICLE TYPE Motorcycle/Moped Tractor Trailer 5 Passenger Vehicle Passenger Bus Sport Utility Veh Pick-Up Truck Trucks (2+3 axles) PROBABLE CAUSES Influence of Drugs Influence of Alcohol Influence of Medication School Bus Emergency Veh Other Types SURFACE MOVEMENTS Wet 3 Dry Sno/Ice Mud Other Improper Lane Change Improper Backing Improper Passing Influence of Combined Subst. Improper Signal Physical/Mental Difficulty Improper Parking Sideswipe Fell Asleep/Fainted, etc. Fail to give full Attention Lic. Restr. Non-compliance Fail to Drive in Single Lane Passenger Interfere/Obstruct. Illegally in Roadway Bicycle Violation Clothing Not Visible Improper Right Turn on Red Sleet, Hail, Freezing Rain Fail to Yield Right-of-way Fail to Obey Stop Sign Fail to Obey Traffic Signal Fail to Obey Other Control Fail to Keep Right of Center Fail to Stop for School Bus Wrong Way on One Way Exceeded Speed Limit Operator Using Cell Phone Severe Crosswinds Rain, Snow Animal Vision Obstruction Vehicle Defect Wet Icy or Snow Covered Debris or Obstruction Ruts, Holes or Bumps Stopping in Lane Roadway Road Under Construction Too Fast for Conditions Followed too Closely Traffic Control Device Inop. Shoulders Low, Soft or High Improper Turn Other or Unknown WEATHER ILLUMINATION TOTALS 3 Clear / Cloudy 4 Day Foggy Dawn/Dusk Raining Dark - Lights On Snow / Sleet Dark - No Lights Other Other NORTH SOUTH EAST WEST LF ST RT LF ST RT LF ST RT LF ST RT 2 2 OTHER MOVEMENTS COLLISION TYPES FATAL INJURY PROP TOTAL Opposite Dir Related: UnRelated: Rear End Related: Left Turn Angle Pedestrian Parked Vehicle Other Collision F Bridge I Building X Culvert/Ditch E Curb UnRelated: Related: UnRelated: Related: UnRelated: Related: UnRelated: Related: UnRelated: Related: UnRelated: Related: UnRelated: D O B J E C T S Guardrail/Barrier Embankment Fence Light Pole Sign Pole Other Pole Tree/Shrubbery Contr. Barrier Crash Attenuator Other Fixed Object
189 Maryland State Highway Administration Name: Robert Booker Office of Traffic and Safety - Traffic Development and Support Division Date: 6/28/27 SHA 52. ADC History Output rev. 5/26- - Combined Year Listing Location: MD LINDEN LINTHICUM LN Logmiles: 4.22 At Radius: 5 ft. County: Howard, D7 Period: January, 23 To December 3, 26 Note: Year 26 data may be incomplete and unedited Movement MilePt Int Rel Date Severity Time Light Surface Alc Rel FixObj Collision V V2 Probable Cause MD Injured 3P Day Dry LFTRN EL WS Fail to yield right-of-way MD Property 8A Day Dry RREND ES EL Followed too closely Property 9A Day Wet ANGLE NS WS Other or Unknown CO Injured 5P Day Dry 4 FXOBJ ER -- Fail to give full attention Fixed Object: = Bridge 2 = Building 3 = Culvert/Ditch 4 = Curb 5 = Guardrail/Barrier 6 = Embankment 7 = Fence 8 = Light Pole 9 = Sign Post = Other Pole = Tree/Shrubbery 2 = Construction Barrier 3 = Crash Attenuator 2 Page of
190 Location: MD Linden Linthicum Ln County: HOWARD Study Period: //23 to Approx. 2/3/26 Analyst: Robert L. Booker, Jr. Date: 6/28/27 Freestate Gas Station Entrance N MARYLAND 8 6/23/3-I-3P-D 2/2/6-P-9A-W 2/23/6-P-8A-D 8/9/3-I-5P-D 4 LINDEN LINTHICUM LN MARYLAND 8 DATE-SEVERITY-TIME-SURFCE NIGHT ALCOHOL DRUGS X X SEVERITY F - Fatalities I - Injured P - Property Damage Only SURFAC E D - Dry Surface W - W et Su rfa ce I - Icy Surface S - Snowy Surface - Not Applicable - Brid ge or Overpa ss 2 - Bui ldi ng 3 - Cu lvert or Ditch 4 - Cu rb 5 - Guard rail o r Ba rrier 6 - Emba nkmen t 7 Fence 8 - Light Support Pole 9 - Sign Support Pole - Other Pole - Tree Shrubbery 2 - Construction Barrier 3 - Crash Attenuator 88 - Other 99 - Unknown B - Bicycle P - Other Pedalcycle C - Other Conveyance T - Railway Train A - Animal O - Other Object S - Spilled Cargo J - Jackknife U - Units Separated N - Other Non collision D - Off Road R - Downhill Runaway F - Explosion or Fire? - Unknown template U - TURN BACKING OVERTURN Parked Vehicle P Pedestrian 3

191 4

192 feet meters 2 7 5
193 Maryland State Highway Administration Office of Traffic and Safety - Traffic Development and Support Division SHA 52. ADC Study Worksheet Output rev. 4/26- Name: Robert Booker Date: 6/28/27 Location: MD GREAT STAR DR Logmiles: 3.98 At Radius: 5 ft. County: Howard, D7 Period: January, 23 To December 3, 26 Note: Year 26 data may be incomplete and unedited YEAR >> Total Fatal No. Killed Injury 3 3 No. Injured 6 6 Prop. Damage Total Crashes Severity Index Avg 5 Opposite Dir. Rear End 2 4 Sideswipe Left Turn Angle Pedestrian Parked Veh. Fixed Object Other U-Turn Backing Animal Railroad Fire / Expl. Overturn Truck Related Night Time 2 4 Wet Surface 2 4 Alcohol Intersection Total Vehicles Total Trucks Truck % Comments: 6
194 Maryland State Highway Administration Office of Traffic and Safety - Traffic Development and Support Division SHA 52. ADC Summary Output rev. 4/26- Name: Robert Booker Date: 6/28/27 Location: MD GREAT STAR DR Logmiles: 3.98 At Radius: 5 ft. County: Howard, D7 Period: January, 23 To December 3, 26 Note: Year 26 data may be incomplete and unedited SEVERITY FATAL INJURY P-DAMAGE TOTAL DAY OF THE WEEK Accidents Veh Occ SUN MON TUE 2 WED 6 THU 2 FRI SAT 3 UNK Pedestrian AVG Severity Index: 5 MONTH OF THE YEAR JAN FEB MAR APR MAY JUN JUL AUG SEP OCT NOV DEC UNK CONDITION Normal: Alcohol: Other: DRIVER 26 5 PED TIME AM: PM: UNK VEHICLES INVOLVED PER ACCIDENT UNK TOTAL VEHICLE TYPE SURFACE MOVEMENTS Motorcycle/Moped Tractor Trailer 4 Wet NORTH SOUTH EAST WEST 8 Passenger Vehicle Passenger Bus Dry LF ST RT LF ST RT LF ST RT LF ST RT 5 Sport Utility Veh School Bus Sno/Ice 2 Pick-Up Truck Trucks (2+3 axles) 6 Emergency Veh Other Types Mud Other PROBABLE CAUSES Influence of Drugs Improper Lane Change Influence of Alcohol Improper Backing Influence of Medication Improper Passing Influence of Combined Subst. Improper Signal Physical/Mental Difficulty Improper Parking Fell Asleep/Fainted, etc. Passenger Interfere/Obstruct. 2 Fail to give full Attention Illegally in Roadway Lic. Restr. Non-compliance Bicycle Violation Fail to Drive in Single Lane Clothing Not Visible Improper Right Turn on Red Sleet, Hail, Freezing Rain 3 Fail to Yield Right-of-way Severe Crosswinds Fail to Obey Stop Sign Rain, Snow Fail to Obey Traffic Signal Animal Fail to Obey Other Control Vision Obstruction Fail to Keep Right of Center Vehicle Defect Fail to Stop for School Bus Wet Wrong Way on One Way Icy or Snow Covered Exceeded Speed Limit Debris or Obstruction Operator Using Cell Phone Ruts, Holes or Bumps Stopping in Lane Roadway Road Under Construction Too Fast for Conditions Traffic Control Device Inop. Followed too Closely Shoulders Low, Soft or High Improper Turn 6 Other or Unknown WEATHER ILLUMINATION TOTALS 2 Clear / Cloudy Foggy Raining Snow / Sleet Other 4 Day Dawn/Dusk Dark - Lights On Dark - No Lights Other OTHER MOVEMENTS 4 COLLISION TYPES FATAL INJURY PROP TOTAL Opposite Dir Related: UnRelated: Rear End Related: UnRelated: Sideswipe Related: UnRelated: Left Turn Related: 8 9 UnRelated: Angle Related: UnRelated: Pedestrian Related: UnRelated: Parked Vehicle Related: UnRelated: Other Collision Related: UnRelated: F I X E D O B J E C T S Bridge Building Culvert/Ditch Curb Guardrail/Barrier Embankment Fence Light Pole Sign Pole Other Pole Tree/Shrubbery Contr. Barrier Crash Attenuator Other Fixed Object 7
195 Maryland State Highway Administration Name: Robert Booker Office of Traffic and Safety - Traffic Development and Support Division Date: 6/28/27 SHA 52. ADC History Output rev. 5/26- - Combined Year Listing Location: MD GREAT STAR DR Logmiles: 3.98 At Radius: 5 ft. County: Howard, D7 Period: January, 23 To December 3, 26 Note: Year 26 data may be incomplete and unedited Movement MilePt Int Rel Date Severity Time Light Surface Alc Rel FixObj Collision V V2 Probable Cause MD Property 7P Night Wet LFTRN ES WL Other or Unknown Property 8P Night Dry LFTRN WL ES Improper turn Property 7A Day Dry LFTRN WL ES Fail to yield right-of-way Injured 2P Day Dry LFTRN WL ES Fail to yield right-of-way Property P Night Wet LFTRN ES WL Other or Unknown Injured 2P Day Dry RREND WS WS Other or Unknown Injured 6P Day Dry RREND ES ES Followed too closely Property 7A Day Dry LFTRN WL ES Other or Unknown Property P Night Wet LFTRN WL ES Other or Unknown Property 5P Day Dry LFTRN WL ES Fail to give full attention Property 9A Day Dry LFTRN WL ES Fail to yield right-of-way CO Property 3P Day Dry RREND NS NS Other or Unknown Property 2P Day Wet 88 FXOBJ ER -- Too fast for conditions Property 4P Day Dry RREND NS NR Fail to give full attention Fixed Object: = Bridge 2 = Building 3 = Culvert/Ditch 4 = Curb 5 = Guardrail/Barrier 6 = Embankment 7 = Fence 8 = Light Pole 9 = Sign Post = Other Pole = Tree/Shrubbery 2 = Construction Barrier 3 = Crash Attenuator 8 Page of
196 Location: MD Great Star Dr County: HOWARD Study Period: //23 to Approx. 2/3/26 Analyst: Robert L. Booker, Jr. Date: 6/28/27 N MARYLAND 8 5/22/4-I-2P-D 8/28/3-P-8P-D 7/3/3-P-7P-W /8/4-P-7A-D 5//4-4I-2P-D 5/4/4-P-P-W 4/29/5-P-7A-D //4-I-6P-D 3/9/6-P-P-W 9/7/6-P-5P-D 2/22/6-P-9A-D 3/3/6-P-2P-W 88 9/5/5-P-3P-D 8/9/6-P-4P-D GREAT STAR DR MARYLAND 8 DATE-SEVERITY-TIME-SURFCE NIGHT ALCOHOL DRUGS X X SEVERITY F - Fatalities I - Injured P - Property Damage Only SURFACE D - Dry Surface W - Wet Surface I - Icy Surface S - Snowy Surface - Not Applicable - Bridge or Overpass 2 - Building 3 - Culvert or Ditch 4 - Curb 5 - Guardrail or Barrier 6 - Embankment 7 Fence 8 - Light Support Pole 9 - Sign Support Pole - Other Pole - Tree Shrubbery 2 - Construction Barrier 3 - Crash Attenuator 88 - Other 99 - Unknown B - Bicycle P - Other Pedalcycle C - Other Conveyance T - Railway Train A - Animal O - Other Object S - Spilled Cargo J - Jackknife U - Units Separated N - Other Non collision D - Off Road R - Downhill Runaway F - Explosion or Fire? - Unknown template U - TURN BACKING OVERTURN Parked Vehicle P Pedestrian 9

197 2

198 feet meters 4 2
199 Maryland State Highway Administration Office of Traffic and Safety - Traffic Development and Support Division SHA 52. ADC Study Worksheet Output rev. 4/26- Name: Robert Booker Date: 6/28/27 Location: MD AUTO DR & SIGNAL BELL LN Logmiles: 3.85 At Radius: 5 ft. County: Howard, D7 Period: January, 23 To December 3, 26 Note: Year 26 data may be incomplete and unedited YEAR >> Total Fatal No. Killed Injury No. Injured Prop. Damage Total Crashes Severity Index 9 6 Avg 4 Opposite Dir. Rear End 2 Sideswipe Left Turn 2 Angle Pedestrian Parked Veh. Fixed Object Other U-Turn Backing Animal Railroad Fire / Expl. Overturn Truck Related Night Time Wet Surface Alcohol Intersection Total Vehicles Total Trucks Truck %..... Comments: 22
200 Maryland State Highway Administration Office of Traffic and Safety - Traffic Development and Support Division SHA 52. ADC Summary Output rev. 4/26- Name: Robert Booker Date: 6/28/27 Location: MD AUTO DR & SIGNAL BELL LN Logmiles: 3.85 At Radius: 5 ft. County: Howard, D7 Period: January, 23 To December 3, 26 Note: Year 26 data may be incomplete and unedited SEVERITY FATAL INJURY P-DAMAGE TOTAL DAY OF THE WEEK Accidents Veh Occ Pedestrian 4 6 AVG Severity Index: 4 5 SUN MON TUE 2 WED THU 2 FRI SAT UNK MONTH OF THE YEAR JAN FEB MAR APR MAY JUN JUL AUG SEP OCT NOV DEC UNK 3 CONDITION Normal: Alcohol: Other: DRIVER 9 PED TIME AM: PM: UNK VEHICLES INVOLVED PER ACCIDENT UNK TOTAL 4 VEHICLE TYPE 7 Motorcycle/Moped Passenger Vehicle Tractor Trailer Passenger Bus Sport Utility Veh Pick-Up Truck Trucks (2+3 axles) PROBABLE CAUSES Influence of Drugs Influence of Alcohol Influence of Medication School Bus Emergency Veh 3 Other Types SURFACE MOVEMENTS Wet 4 Dry Sno/Ice Mud Other Improper Lane Change Improper Backing Improper Passing Influence of Combined Subst. Improper Signal Physical/Mental Difficulty Improper Parking Sideswipe Fell Asleep/Fainted, etc. Fail to give full Attention Lic. Restr. Non-compliance Fail to Drive in Single Lane Passenger Interfere/Obstruct. Illegally in Roadway Bicycle Violation Clothing Not Visible Improper Right Turn on Red Sleet, Hail, Freezing Rain Fail to Yield Right-of-way Fail to Obey Stop Sign Fail to Obey Traffic Signal Fail to Obey Other Control Fail to Keep Right of Center Fail to Stop for School Bus Wrong Way on One Way Exceeded Speed Limit Operator Using Cell Phone Severe Crosswinds Rain, Snow Animal Vision Obstruction Vehicle Defect Wet Icy or Snow Covered Debris or Obstruction Ruts, Holes or Bumps Stopping in Lane Roadway Road Under Construction Too Fast for Conditions Followed too Closely Traffic Control Device Inop. Shoulders Low, Soft or High Improper Turn Other or Unknown WEATHER ILLUMINATION TOTALS 4 Clear / Cloudy 5 Day Foggy Dawn/Dusk Raining Dark - Lights On Snow / Sleet Dark - No Lights Other Other NORTH SOUTH EAST WEST LF ST RT LF ST RT LF ST RT LF ST RT OTHER MOVEMENTS COLLISION TYPES FATAL INJURY PROP TOTAL Opposite Dir Related: UnRelated: Rear End Related: 2 2 Left Turn Angle Pedestrian Parked Vehicle Other Collision F Bridge I Building X Culvert/Ditch E Curb UnRelated: Related: UnRelated: Related: 2 2 UnRelated: Related: UnRelated: Related: UnRelated: Related: UnRelated: Related: UnRelated: D O B J E C T S Guardrail/Barrier Embankment Fence Light Pole Sign Pole Other Pole Tree/Shrubbery Contr. Barrier Crash Attenuator Other Fixed Object 23
201 Maryland State Highway Administration Name: Robert Booker Office of Traffic and Safety - Traffic Development and Support Division Date: 6/28/27 SHA 52. ADC History Output rev. 5/26- - Combined Year Listing Location: MD AUTO DR & SIGNAL BELL LN Logmiles: 3.85 At Radius: 5 ft. County: Howard, D7 Period: January, 23 To December 3, 26 Note: Year 26 data may be incomplete and unedited Movement MilePt Int Rel Date Severity Time Light Surface Alc Rel FixObj Collision V V2 Probable Cause MD Injured 6P Day Dry LFTRN WL ES Fail to yield right-of-way Injured A Day Dry LFTRN EL WS Fail to give full attention Property 7P Day Dry ANGLE ES NL Other or Unknown Injured A Day Wet RREND WS WS Too fast for conditions CO Injured 4P Day Dry RREND NS NS Followed too closely Fixed Object: = Bridge 2 = Building 3 = Culvert/Ditch 4 = Curb 5 = Guardrail/Barrier 6 = Embankment 7 = Fence 8 = Light Pole 9 = Sign Post = Other Pole = Tree/Shrubbery 2 = Construction Barrier 3 = Crash Attenuator 24 Page of
202 Location: MD 8 ~ Auto Dr & Signal Bell Ln County: HOWARD Study Period: //23 to Approx. 2/3/26 Analyst: Robert L. Booker, Jr. Date: 6/28/27 AUTO DR N MARYLAND 8 /4/4-I-A-D /3/3-I-A-W 8/2/6-P-7P-D /3/3-3I-6P-D /6/4-I-4P-D SIGNAL BELL LN MARYLAND 8 DATE-SEVERITY-TIME-SURFCE NIGHT ALCOHOL DRUGS X X SEVERITY F - Fatalities I - Injured P - Property Damage Only SURFACE D - Dry Surface W - Wet Surface I - Icy Surface S - Snowy Surface - Not Applicable - Bridge or Overpass 2 - Building 3 - Culvert or Ditch 4 - Curb 5 - Guardrail or Barrier 6 - Embankment 7 Fence 8 - Light Support Pole 9 - Sign Support Pole - Other Pole - Tree Shrubbery 2 - Construction Barrier 3 - Crash Attenuator 88 - Other 99 - Unknown B - Bicycle P - Other Pedalcycle C - Other Conveyance T - Railway Train A - Animal O - Other Object S - Spilled Cargo J - Jackknife U - Units Separated N - Other Non collision D - Off Road R - Downhill Runaway F - Explosion or Fire? - Unknown template U - TURN BACKING OVERTURN Parked Vehicle P Pedestrian 25

203 26
204 27

205 feet meters
206 Maryland State Highway Administration Office of Traffic and Safety - Traffic Development and Support Division SHA 52. ADC Study Worksheet Output rev. 4/26- Name: Robert Booker Date: 6/29/27 Location: IC #39; MD MD 8, Rps 4 & 6 Logmiles: 3.69 At - Radius: 5 ft. County: Howard, D7 Period: January, 23 To December 3, 26 Note: Year 26 data may be incomplete and unedited YEAR >> Total Fatal No. Killed Injury 2 No. Injured 3 4 Prop. Damage 2 3 Total Crashes 3 5 Severity Index 4 4 Avg 2 Opposite Dir. Rear End Sideswipe Left Turn 2 4 Angle Pedestrian Parked Veh. Fixed Object Other U-Turn Backing Animal Railroad Fire / Expl. Overturn Truck Related Night Time Wet Surface 2 2 Alcohol Intersection 3 5 Total Vehicles Total Trucks Truck %..... Comments: 29
207 Maryland State Highway Administration Office of Traffic and Safety - Traffic Development and Support Division SHA 52. ADC Summary Output rev. 4/26- Name: Robert Booker Date: 6/29/27 Location: IC #39; MD MD 8, Rps 4 & 6 Logmiles: 3.69 At - Radius: 5 ft. County: Howard, D7 Period: January, 23 To December 3, 26 Note: Year 26 data may be incomplete and unedited SEVERITY FATAL INJURY P-DAMAGE TOTAL DAY OF THE WEEK Accidents Veh Occ Pedestrian AVG Severity Index: 2 5 SUN MON TUE WED 3 THU FRI SAT UNK MONTH OF THE YEAR JAN FEB MAR APR MAY JUN JUL AUG SEP OCT NOV DEC UNK CONDITION Normal: Alcohol: Other: DRIVER PED TIME AM: PM: UNK VEHICLES INVOLVED PER ACCIDENT UNK TOTAL 5 VEHICLE TYPE 8 Motorcycle/Moped Passenger Vehicle Sport Utility Veh Pick-Up Truck Trucks (2+3 axles) Tractor Trailer Passenger Bus School Bus Emergency Veh Other Types PROBABLE CAUSES Influence of Drugs Improper Lane Change Influence of Alcohol Influence of Medication Influence of Combined Subst. Physical/Mental Difficulty Fell Asleep/Fainted, etc. Fail to give full Attention Lic. Restr. Non-compliance Fail to Drive in Single Lane Improper Backing Improper Passing Improper Signal Improper Parking Passenger Interfere/Obstruct. Illegally in Roadway Bicycle Violation Clothing Not Visible Improper Right Turn on Red Sleet, Hail, Freezing Rain 2 Fail to Yield Right-of-way Fail to Obey Stop Sign Fail to Obey Traffic Signal Fail to Obey Other Control Fail to Keep Right of Center Fail to Stop for School Bus Wrong Way on One Way Exceeded Speed Limit Operator Using Cell Phone Stopping in Lane Roadway Too Fast for Conditions Followed too Closely Improper Turn Severe Crosswinds Rain, Snow Animal Vision Obstruction Vehicle Defect Wet Icy or Snow Covered Debris or Obstruction Ruts, Holes or Bumps Road Under Construction Traffic Control Device Inop. Shoulders Low, Soft or High Other or Unknown WEATHER ILLUMINATION TOTALS 3 Clear / Cloudy Foggy Raining Snow / Sleet Other 4 Day Dawn/Dusk Dark - Lights On Dark - No Lights Other SURFACE MOVEMENTS 2 Wet NORTH SOUTH EAST WEST 3 Dry Sno/Ice LF ST 5 RT LF 4 ST RT LF ST RT LF ST RT Mud Other OTHER MOVEMENTS COLLISION TYPES FATAL INJURY PROP TOTAL Opposite Dir Related: UnRelated: Rear End Related: UnRelated: Sideswipe Related: UnRelated: Left Turn Related: UnRelated: Angle Related: UnRelated: Pedestrian Related: UnRelated: Parked Vehicle Related: UnRelated: Other Collision Related: UnRelated: F I X E D O B J E C T S Bridge Building Culvert/Ditch Curb Guardrail/Barrier Embankment Fence Light Pole Sign Pole Other Pole Tree/Shrubbery Contr. Barrier Crash Attenuator Other Fixed Object 3
208 Maryland State Highway Administration Name: Robert Booker Office of Traffic and Safety - Traffic Development and Support Division Date: 6/29/27 SHA 52. ADC History Output rev. 5/26- - Combined Year Listing Location: IC #39; MD MD 8, Rps 4 & 6 Logmiles: 3.69 At - Radius: 5 ft. County: Howard, D7 Period: January, 23 To December 3, 26 Note: Year 26 data may be incomplete and unedited Movement MilePt Int Rel Date Severity Time Light Surface Alc Rel FixObj Collision V V2 Probable Cause MD Injured 8P Night Wet LFTRN SL NS Improper turn Property 7A Day Wet LFTRN SL NS Fail to obey other control Injured 7P Day Dry LFTRN SL NS Fail to yield right-of-way Property 8A Day Dry SDSWP NR NS Fail to drive in single lane Property A Day Dry LFTRN SL NS Fail to yield right-of-way Fixed Object: = Bridge 2 = Building 3 = Culvert/Ditch 4 = Curb 5 = Guardrail/Barrier 6 = Embankment 7 = Fence 8 = Light Pole 9 = Sign Post = Other Pole = Tree/Shrubbery 2 = Construction Barrier 3 = Crash Attenuator 3 Page of
209 Location: IC #39; MD MD 8, Rps 4 & 6 County: HOWARD Study Period: //23 to Approx. 2/3/26 Analyst: Robert L. Booker, Jr. Date: 6/29/27 MARYLAND 8 N RAMP 6 4/7/3-P-8A-D 2/6/3-P-7A-W 3/2/3-I-8P-W 5/3/5-3I-7P-D /23/6-P-A-D RAMP 4 MARYLAND 8 DATE-SEVERITY-TIME-SURFCE NIGHT ALCOHOL DRUGS X X SEVERITY F - Fatalities I - Injured P - Property Damage Only SURFACE D - Dry Surface W - Wet Surface I - Icy Surface S - Snowy Surface - Not Applicable - Bridge or Overpass 2 - Building 3 - Culvert or Ditch 4 - Curb 5 - Guardrail or Barrier 6 - Embankment 7 Fence 8 - Light Support Pole 9 - Sign Support Pole - Other Pole - Tree Shrubbery 2 - Construction Barrier 3 - Crash Attenuator 88 - Other 99 - Unknown B - Bicycle P - Other Pedalcycle C - Other Conveyance T - Railway Train A - Animal O - Other Object S - Spilled Cargo J - Jackknife U - Units Separated N - Other Non collision D - Off Road R - Downhill Runaway F - Explosion or Fire? - Unknown template U - TURN BACKING OVERTURN Parked Vehicle P Pedestrian 32

210 33

211 34

212 feet meters
213 Maryland State Highway Administration Office of Traffic and Safety - Traffic Development and Support Division SHA 52. ADC Study Worksheet Output rev. 4/26- Name: Robert Booker Date: 6/29/27 Location: IC #39; MD MD 8; Rps 2 & 8 Logmiles: 3.78 At - Radius: 5 ft. County: Howard, D7 Period: January, 23 To December 3, 26 Note: Year 26 data may be incomplete and unedited YEAR >> Total Fatal No. Killed Injury 2 3 No. Injured 3 4 Prop. Damage 4 Total Crashes Severity Index 7 3 Avg 3 Opposite Dir. Rear End Sideswipe Left Turn 3 Angle 2 4 Pedestrian Parked Veh. Fixed Object Other U-Turn Backing Animal Railroad Fire / Expl. Overturn Truck Related Night Time 3 4 Wet Surface 3 Alcohol Intersection Total Vehicles Total Trucks Truck %..... Comments: 36
214 Maryland State Highway Administration Office of Traffic and Safety - Traffic Development and Support Division SHA 52. ADC Summary Output rev. 4/26- Name: Robert Booker Date: 6/29/27 Location: IC #39; MD MD 8; Rps 2 & 8 Logmiles: 3.78 At - Radius: 5 ft. County: Howard, D7 Period: January, 23 To December 3, 26 Note: Year 26 data may be incomplete and unedited SEVERITY FATAL INJURY P-DAMAGE TOTAL DAY OF THE WEEK Accidents Veh Occ Pedestrian AVG Severity Index: 3 7 SUN 2 MON TUE WED THU FRI SAT UNK MONTH OF THE YEAR JAN FEB MAR APR MAY JUN JUL AUG SEP OCT NOV DEC UNK 2 CONDITION Normal: Alcohol: Other: DRIVER 3 PED TIME AM: PM: UNK VEHICLES INVOLVED PER ACCIDENT UNK TOTAL 7 4 VEHICLE TYPE SURFACE MOVEMENTS Motorcycle/Moped Tractor Trailer 3 Wet NORTH SOUTH EAST WEST 3 Passenger Vehicle Passenger Bus 4 Dry LF ST RT LF ST RT LF ST RT LF ST RT Sport Utility Veh School Bus Sno/Ice Pick-Up Truck Trucks (2+3 axles) Emergency Veh Other Types Mud Other PROBABLE CAUSES Influence of Drugs Improper Lane Change Influence of Alcohol Improper Backing Influence of Medication Improper Passing Influence of Combined Subst. Improper Signal Physical/Mental Difficulty Improper Parking Fell Asleep/Fainted, etc. Fail to give full Attention Lic. Restr. Non-compliance Fail to Drive in Single Lane Passenger Interfere/Obstruct. Illegally in Roadway Bicycle Violation Clothing Not Visible Improper Right Turn on Red Sleet, Hail, Freezing Rain 2 2 Fail to Yield Right-of-way Fail to Obey Stop Sign Fail to Obey Traffic Signal Fail to Obey Other Control Fail to Keep Right of Center Fail to Stop for School Bus Wrong Way on One Way Exceeded Speed Limit Operator Using Cell Phone Severe Crosswinds Rain, Snow Animal Vision Obstruction Vehicle Defect Wet Icy or Snow Covered Debris or Obstruction Ruts, Holes or Bumps Stopping in Lane Roadway Road Under Construction Too Fast for Conditions Followed too Closely Improper Turn Traffic Control Device Inop. Shoulders Low, Soft or High Other or Unknown WEATHER ILLUMINATION TOTALS 3 2 Clear / Cloudy Foggy Raining Snow / Sleet Other 2 4 Day Dawn/Dusk Dark - Lights On Dark - No Lights Other OTHER MOVEMENTS COLLISION TYPES FATAL INJURY PROP TOTAL Opposite Dir Related: UnRelated: Rear End Related: UnRelated: Sideswipe Related: UnRelated: Left Turn Related: UnRelated: 2 3 Angle Related: UnRelated: Pedestrian Related: UnRelated: Parked Vehicle Related: UnRelated: Other Collision Related: UnRelated: F I X E D O B J E C T S Bridge Building Culvert/Ditch Curb Guardrail/Barrier Embankment Fence Light Pole Sign Pole Other Pole Tree/Shrubbery Contr. Barrier Crash Attenuator Other Fixed Object 37
215 Maryland State Highway Administration Name: Robert Booker Office of Traffic and Safety - Traffic Development and Support Division Date: 6/29/27 SHA 52. ADC History Output rev. 5/26- - Combined Year Listing Location: IC #39; MD MD 8; Rps 2 & 8 Logmiles: 3.78 At - Radius: 5 ft. County: Howard, D7 Period: January, 23 To December 3, 26 Note: Year 26 data may be incomplete and unedited Movement MilePt Int Rel Date Severity Time Light Surface Alc Rel FixObj Collision V V2 Probable Cause MD Injured 8P Night Wet LFTRN NL SS Improper turn Property A Night Dry ANGLE NS WL Fail to obey other control Injured 9P Night Dry ANGLE NS WL Fail to obey other control Property 3P Day Dry LFTRN NL SS Fail to obey traffic signal Injured 7A Day Wet ANGLE SS WS Fail to yield right-of-way Property P Night Dry LFTRN NL SS Fail to yield right-of-way Property 7P Day Wet ANGLE NS WL Other or Unknown Fixed Object: = Bridge 2 = Building 3 = Culvert/Ditch 4 = Curb 5 = Guardrail/Barrier 6 = Embankment 7 = Fence 8 = Light Pole 9 = Sign Post = Other Pole = Tree/Shrubbery 2 = Construction Barrier 3 = Crash Attenuator 38 Page of

216 Location: IC #39; MD MD 8, Rps 2 & 8 County: HOWARD Study Period: //23 to Approx. 2/3/26 Analyst: Robert L. Booker, Jr. Date: 6/29/27 MARYLAND 8 N RAMP 8 3/2/3-I-8P-W 2/7/4-P-3P-D 3/3/5-P-P-D 2/2/5-I-7A-W 6/3/3-P-A-D /2/3-2I-9P-D 5/29/6-P-7P-W RAMP 2 MARYLAND 8 DATE-SEVERITY-TIME-SURFCE NIGHT ALCOHOL DRUGS X X SEVERITY F - Fatalities I - Injured P - Property Damage Only SURFACE D - Dry Surface W - Wet Surface I - Icy Surface S - Snowy Surface - Not Applicable - Bridge or Overpass 2 - Building 3 - Culvert or Ditch 4 - Curb 5 - Guardrail or Barrier 6 - Embankment 7 Fence 8 - Light Support Pole 9 - Sign Support Pole - Other Pole - Tree Shrubbery 2 - Construction Barrier 3 - Crash Attenuator 88 - Other 99 - Unknown B - Bicycle P - Other Pedalcycle C - Other Conveyance T - Railway Train A - Animal O - Other Object S - Spilled Cargo J - Jackknife U - Units Separated N - Other Non collision D - Off Road R - Downhill Runaway F - Explosion or Fire? - Unknown template U - TURN BACKING OVERTURN Parked Vehicle P Pedestrian 39
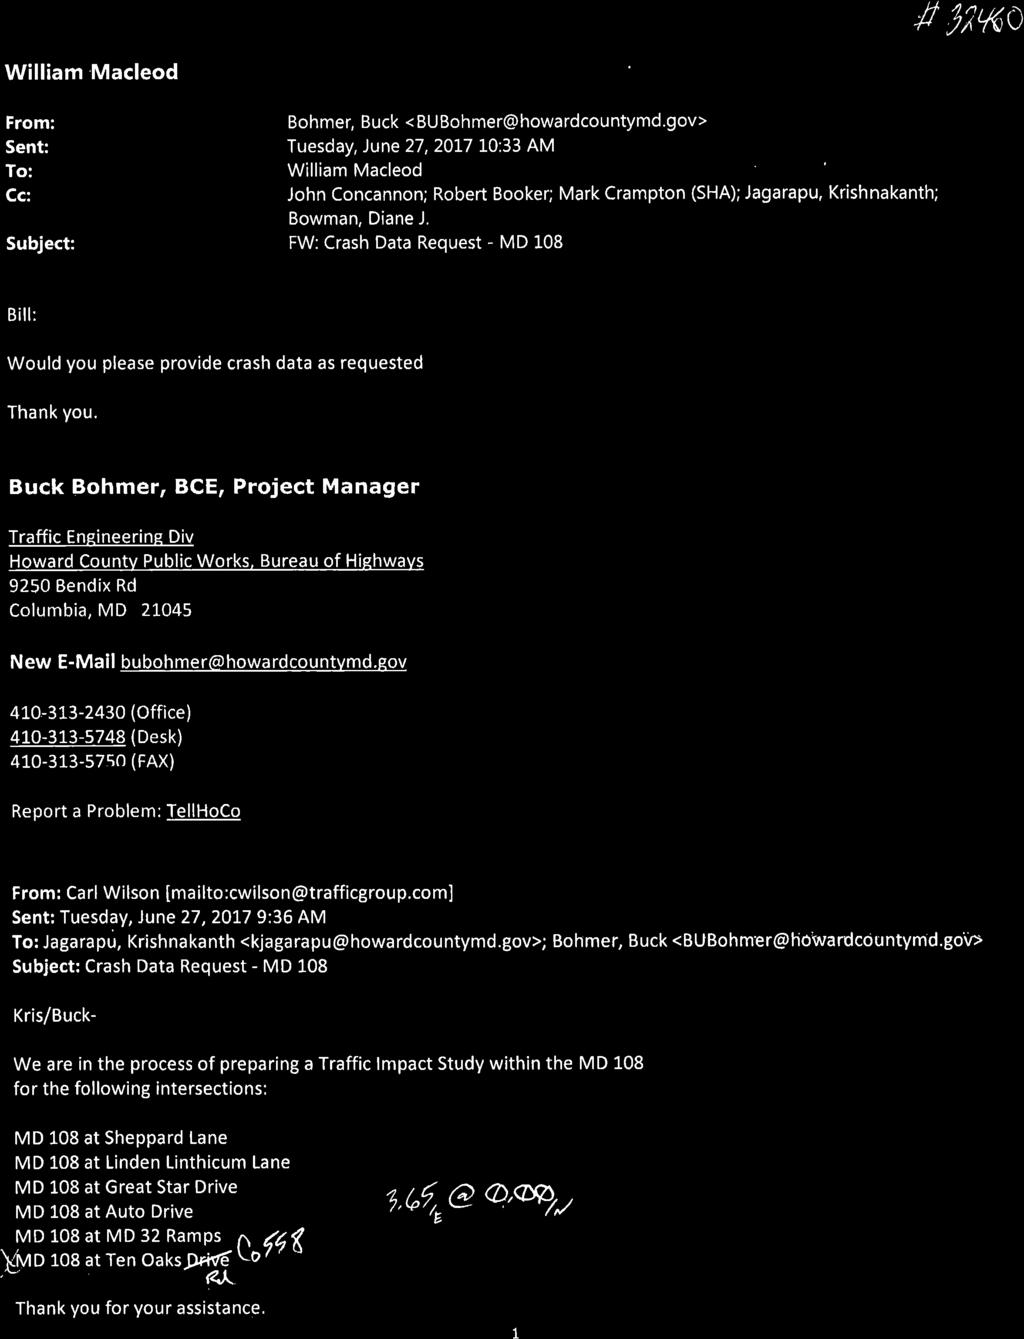
217 4

218 feet meters 4 4
Walmart (Store # ) 60 th Street North and Marion Road Sioux Falls, South Dakota
 60 th Street North and Marion Road Sioux Falls, South Dakota") Walmart (Store #4865-00) 60 th Street North and Marion Road Sioux Falls, South Dakota Prepared for: Wal-Mart Stores, Inc. Bentonville, Arkansas Prepared by: Kimley-Horn and Associates, Inc. ã2013 Kimley-Horn
Walmart (Store #4865-00) 60 th Street North and Marion Road Sioux Falls, South Dakota Prepared for: Wal-Mart Stores, Inc. Bentonville, Arkansas Prepared by: Kimley-Horn and Associates, Inc. ã2013 Kimley-Horn
Patuxent Green Golf Course
 Patuxent Green Golf Course Laurel, Maryland February 23, 2018 Traffic Impact Analysis Prepared for: ADC Builders Alan Cohen 2701 Tower Oaks Boulevard, Suite 200 Rockville, Maryland 20852 TABLE OF CONTENTS
9 Leeming Drive Redevelopment Ottawa, ON Transportation Brief. Prepared By: Stantec Consulting Ltd.
 9 Leeming Drive Redevelopment Ottawa, ON Transportation Brief Prepared By: Stantec Consulting Ltd. TIA GUIDELINES CHECKLIST Report Context Municipal Address Comment: Section 1.1 Location relative to major
FAIRFIELD - RYAN S CORNER TRAFFIC IMPACT ANALYSIS LOUDOUN COUNTY, VIRGINIA
 FAIRFIELD - RYAN S CORNER TRAFFIC IMPACT ANALYSIS LOUDOUN COUNTY, VIRGINIA Submitted on behalf of: Fairfield Residential Prepared by: Wells + Associates, Inc. 1420 Spring Hill Road, Suite 00 McLean, Virginia
Appendix G: Future Conditions Traffic Analysis Memorandum
 ppendix G: Future Conditions Traffic nalysis Memorandum Prepared by: Bolton & Menk, Inc. Riverfront Drive Corridor Study ǀ T42.867 ppendix MEMORNDUM Date: pril, 27 To: Paul Vogel From: Ross B. Tillman,
EXECUTIVE SUMMARY. Page 1 of 6
 EXECUTIVE SUMMARY The purpose of this report is to identify conformance with the original traffic impact study for the proposed retail development on Lot 5 of Riverdale Retail Filing No. 1 located on the
Transportation Impact Study for Abington Terrace
 Transportation Impact Study for Abington Terrace Abington Township, Montgomery County, PA Sandy A. Koza, P.E., PTOE PA PE License Number PE059911 Prepared by McMahon Associates, Inc. 425 Commerce Drive,
REDEVELOPMENT TRAFFIC IMPACT STUDY
 REDEVELOPMENT TRAFFIC IMPACT STUDY For Wendy s Parker, Colorado January 215 Prepared for: Sterling Design Associates, LLC 29 W. Littleton Boulevard #3 Littleton, Colorado 812 Prepared by: 1233 Airport
5858 N COLLEGE, LLC N College Avenue Traffic Impact Study
 5858 N COLLEGE, LLC nue Traffic Impact Study August 22, 2016 Contents Traffic Impact Study Page Preparer Qualifications... 1 Introduction... 2 Existing Roadway Conditions... 5 Existing Traffic Conditions...
MEMORANDUM. Matt Folden, AICP, MNCPPC Rebecca Torma, MCDOT. Nancy Randall, AICP, PTP Barbara Mosier, P.E., PTOE Kevin Berger
 To: From: Matt Folden, AICP, MNCPPC Rebecca Torma, MCDOT Nancy Randall, AICP, PTP Barbara Mosier, P.E., PTOE Kevin Berger 1110 Bonifant Street Suite 210, Silver Spring, MD 20910 301-448-1333 WellsandAssociates.com
Troutbeck Farm Development
 Troutbeck Farm Development Willistown Township, Chester County PA For Submission To: Willistown Township Last Revised: October, 4 TPD# INLM.A. 5 E. High Street Suite 65 Pottstown, PA 9464 6.36.3 TPD@TrafficPD.com
Glenn Avenue Corridor Traffic Operational Evaluation
 Glenn Avenue Corridor Traffic Operational Evaluation PREPARED FOR: THE CITY OF AUBURN PREPARED BY: DECEMBER 2007 Glenn Avenue Corridor Study--Auburn, Alabama TABLE OF CONTENTS Introduction... 1 Background
TRAFFIC IMPACT STUDY And A TRAFFIC SIGNAL WARRANT ANALYSIS FOR A SENIOR LIVING AND APARTMENT DEVELOPMENT
 TRAFFIC IMPACT STUDY And A TRAFFIC SIGNAL WARRANT ANALYSIS FOR A SENIOR LIVING AND APARTMENT DEVELOPMENT DEERFIELD TOWNSHIP, WARREN COUNTY, OHIO Nantucket Circle and Montgomery Road () Prepared for: ODLE
Traffic Impact Analysis Walton Acres at Riverwood Athletic Club Clayton, NC
 Traffic Impact Analysis Walton Acres at Riverwood Athletic Club Clayton, NC 1. TABLE OF CONTENTS INTRODUCTION...1 1.1. Site Location and Study Area...1 1.2. Proposed Land Use and Site Access...2 1.3.
Traffic Impact Study WestBranch Residential Development Davidson, NC March 2016
 Traffic Impact Study WestBranch Residential Development Davidson, NC March 216 TRAFFIC IMPACT STUDY FOR THE WestBranch Residential Development LOCATED IN DAVIDSON, NC Prepared For: Lennar Carolinas, LLC
Shockoe Bottom Preliminary Traffic and Parking Analysis
 Shockoe Bottom Preliminary Traffic and Parking Analysis Richmond, Virginia August 14, 2013 Prepared For City of Richmond Department of Public Works Prepared By 1001 Boulders Pkwy Suite 300, Richmond, VA
Bistro 6. City of Barrie. Traffic Impact Study for Pratt Hansen Group Inc. Type of Document: Final Report. Project Number: JDE 1748
 City of Barrie Traffic Impact Study for Pratt Hansen Group Inc. Type of Document: Final Report Project Number: JDE 1748 Date Submitted: June 12 th, 2017 06/12/17 John Northcote, P.Eng. Professional License
Traffic Circulation Study for Neighborhood Southwest of Mockingbird Lane and Airline Road, Highland Park, Texas
 ARIZONA TEXAS NEW MEXICO OKLAHOMA February 13, 2015 Mr. Meran Dadgostar P.E., R.S. Town of Highland Park 4700 Drexel Dr. Highland Park, Texas 75205 Re: Traffic Circulation Study for Neighborhood Southwest
6060 North Central Expressway Mixed-Use Site Dallas, Texas
 Volume 1 Traffic Impact Analysis 6060 North Central Expressway Mixed-Use Site Dallas, Texas April 30, 2018 Kimley-Horn and Associates, Inc. Dallas, Texas Project #063238300 Registered Firm F-928 Traffic
Traffic Impact Analysis Chatham County Grocery Chatham County, NC
 Chatham County Grocery Chatham County, NC TABLE OF CONTENTS 1. INTRODUCTION... 1 1.1. Location and Study Area... 1 1.2. Proposed Land Use and Access... 2 1.3. Adjacent Land Uses... 2 1.4. Existing ways...
TRAFFIC IMPACT ANALYSIS
 TRAFFIC IMPACT ANALYSIS FOR THE CHAMPAIGN UNIT#4 SCHOOL DISTRICT PROPOSED HIGH SCHOOL (SPALDING PARK SITE) IN THE CITY OF CHAMPAIGN Final Report Champaign Urbana Urbanized Area Transportation Study 6/24/2014
PRELIMINARY DRAFT WADDLE ROAD / I-99 INTERCHANGE PROJECT ALTERNATIVE ANALYSIS FINAL TRAFFIC SUMMARY REPORT
 PRELIMINARY DRAFT WADDLE ROAD / I-99 INTERCHANGE PROJECT ALTERNATIVE ANALYSIS FINAL TRAFFIC SUMMARY REPORT Prepared by: In Association with: November 2013 EXECUTIVE SUMMARY Patton Township, in partnership
James M. Moore, Director of Planning & Building Services, Town of Fairfax. Victory Village Senior Housing Development Traffic Study
 Traffic Study To: From: James M. Moore, Director of Planning & Building Services, Town of Fairfax David Parisi, PE, TE, Parisi Transportation Consulting Date: October 14, 216 Subject: Victory Village Senior
Technical Memorandum TRAFFIC IMPACT STUDY. RIDLEY ROAD CONVENIENCE STORE Southampton County, VA. Prepared for: Mr. David Williams.
 Technical Memorandum TRFFIC IMPCT STUDY RIDLEY ROD CONVENIENCE STORE Southampton County, V Prepared for: Mr. David Williams By: Charles Smith, P.E., PTOE EPR Charlottesville, V July 2014 1 TBLE OF CONTENTS
TRAFFIC IMPACT STUDY
 TRAFFIC IMPACT STUDY for the GLEN ELLEN COUNTRY CLUB SENIOR RESIDENTIAL REDEVELOPMENT 84 Millis, Massachusetts Prepared by: McMahon Associates, Inc. Prepared for: Toll Brothers, Inc. August 216 DRAFT
TRAFFIC IMPACT STUDY CRITERIA
 Chapter 6 - TRAFFIC IMPACT STUDY CRITERIA 6.1 GENERAL PROVISIONS 6.1.1. Purpose: The purpose of this document is to outline a standard format for preparing a traffic impact study in the City of Steamboat
CRYSTAL HOUSE III TRAFFIC IMPACT ANALYSIS ARLINGTON COUNTY, VA
 CRYSTAL HOUSE III TRAFFIC IMPACT ANALYSIS ARLINGTON COUNTY, VA Prepared for: Roseland, A Mack-Cali Company Prepared by: Wells + Associates, Inc. Michael R. Pinkoske, PTP Henry C. Clarke, EIT 70.97.660
List of Attachments. Location Map... Site Plan... City of Lake Elsinore Circulation Element... City of Lake Elsinore Roadway Cross-Sections...
 List of Attachments Exhibits Location Map... Site Plan... City of Lake Elsinore Circulation Element... City of Lake Elsinore Roadway Cross-Sections... Existing Lane Geometry and Traffic Controls... Existing
#!! "$% ##! &! # '#! % $ #!
 Executive Summary US Highway 16 (US 16) is the primary corridor connecting Rapid City to the Black Hills region. It serves a growing population of commercial and residential traffic, as well as seasonal
TRAFFIC ASSESSMENT River Edge Colorado
 TRAFFIC ASSESSMENT River Edge Colorado Submitted by: Fehr & Peers 621 17th Street, Ste. 231 Denver, CO 8293 (33) 296-43 December, 21 App. M-2 Traffic Assessment River Edge Colorado December 21 TABLE OF
1609 E. FRANKLIN STREET HOTEL TRAFFIC IMPACT STUDY EXECUTIVE SUMMARY
 1609 E. FRANKLIN STREET HOTEL TRAFFIC IMPACT STUDY EXECUTIVE SUMMARY Prepared for: The Town of Chapel Hill Public Works Department Traffic Engineering Division Prepared by: HNTB North Carolina, PC 343
Traffic Impact Study. Crestline Piggly Wiggly Mountain Brook, Alabama. Goodwyn, Mills and Cawood, Inc. Birmingham, Alabama.
 Traffic Impact Study Crestline Piggly Wiggly Mountain Brook, Alabama Prepared for: Goodwyn, Mills and Cawood, Inc. Birmingham, Alabama September 214 Revision 1 October 214 Crestline Piggly Wiggly Mountain
2016 Church Street Access Study. 100 Clinton Square 126 North Salina Street, Suite 100 Syracuse, NY
 2016 Church Street Access Study 100 Clinton Square 126 North Salina Street, Suite 100 Syracuse, NY 13202 www.smtcmpo.org Syracuse Metropolitan Transportation Council Final Report February 23, 2016 This
T$- RIB Endineering, ac
 T$- RIB Endineering, ac..' Transportation Endineerimg Solutions Transportation Impact Study Vineyard-Goldelm Fort Collins, Colorado February 2016 Vineyard-Goldelm Transportation Impact Study Fort Collins,
TRAFFIC IMPACT STUDY COMPREHENSIVE UPDATE TOWN OF THOMPSON S STATION, TENNESSEE PREPARED FOR: THE TOWN OF THOMPSON S STATION
 TRAFFIC IMPACT STUDY COMPREHENSIVE UPDATE TOWN OF THOMPSON S STATION, TENNESSEE PREPARED FOR: THE TOWN OF THOMPSON S STATION Transportation Consultants, LLC 1101 17 TH AVENUE SOUTH NASHVILLE, TN 37212
Chapter 4 Traffic Analysis
 Chapter 4 Traffic Analysis PURPOSE The traffic analysis component of the K-68 Corridor Management Plan incorporates information on the existing transportation network, such as traffic volumes and intersection
BOARD OF SUPERVISORS TRANSPORTATION AND LAND USE COMMITTEE ACTION ITEM
 BOARD OF SUPERVISORS TRANSPORTATION AND LAND USE COMMITTEE ACTION ITEM Date of Meeting: May 12, 2017 # 1 SUBJECT: ELECTION DISTRICT: Response to Board Member Initiative: Safety Concerns for Left Hand Turn
Table of Contents FIGURES TABLES APPENDICES. Traffic Impact Study Hudson Street Parking Garage MC Project No.: A Table of Contents
 Traffic Impact Study Hudson Street Parking Garage MC Project No.: 151714A Table of Contents Table of Contents I. INTRODUCTION... 2 II. EXISTING CONDITIONS... 5 III. 215 EXISTING TRAFFIC CONDITIONS... 6
Highway 111 Corridor Study
 Highway 111 Corridor Study June, 2009 LINCOLN CO. HWY 111 CORRIDOR STUDY Draft Study Tea, South Dakota Prepared for City of Tea Sioux Falls Metropolitan Planning Organization Prepared by HDR Engineering,
TRANSPORTATION IMPACT STUDY
 Dundas MEP Developments Inc. City of Toronto 219 and 231 Dundas Street East, Proposed Mixed-Use Development TRANSPORTATION IMPACT STUDY 9782/2 April 216 LEA Consulting Ltd. Consulting Engineers & Planners
TRAFFIC STUDY GUIDELINES Clarksville Street Department
 TRAFFIC STUDY GUIDELINES Clarksville Street Department 9/1/2009 Introduction Traffic studies are used to help the city determine potential impacts to the operation of the surrounding roadway network. Two
4. ENVIRONMENTAL IMPACT ANALYSIS 9. TRANSPORTATION AND TRAFFIC
 4. ENVIRONMENTAL IMPACT ANALYSIS 9. TRANSPORTATION AND TRAFFIC 4.9.1 INTRODUCTION The following section addresses the Proposed Project s impact on transportation and traffic based on the Traffic Study
Traffic Impact Study Little Egypt Road Development Denver, North Carolina June 2017
 Traffic Impact Study Little Egypt Road Development Denver, North arolina June 2017 N. Little Egypt Road DQ\ QDQFLQJ VDOHV RU RWKHU SHUIRUPDQFH EDVHG FULWHULD Proposed Site Driveways Site Driveway 1 TRAFFI
Brian McHugh, Buckhead Community Improvement District. SUBJECT: Wieuca Road at Phipps Boulevard Intersection Improvements Project
 MEMO TO: FROM: Brian McHugh, Buckhead Community Improvement District Jagan Kaja, AICP, WSP Parsons Brinckerhoff SUBJECT: Wieuca Road at Phipps Boulevard Intersection Improvements Project DATE: October
Student Housing Development
 Traffic Impact Study for the proposed Student Housing Development City of Oneonta Otsego County, New York Project No. 3259 December 212 Revised February 13, 212 Prepared For: Newman Development Group,
THE GEORGE WASHINGTON UNIVERSITY SITE 75A REVISED TRANSPORTATION IMPACT STUDY WASHINGTON, DC
 THE GEORGE WASHINGTON UNIVERSITY SITE 75A REVISED TRANSPORTATION IMPACT STUDY WASHINGTON, DC Submitted on behalf of: The George Washington University Prepared by: Wells + Associates, Inc. September 2012
Traffic Impact Study. Westlake Elementary School Westlake, Ohio. TMS Engineers, Inc. June 5, 2017
 TMS Engineers, Inc. Traffic Impact Study Westlake Elementary School Westlake, Ohio June 5, 2017 Prepared for: Westlake City Schools - Board of Education 27200 Hilliard Boulevard Westlake, OH 44145 TRAFFIC
METHODOLOGY. Signalized Intersection Average Control Delay (sec/veh)
") Chapter 5 Traffic Analysis 5.1 SUMMARY US /West 6 th Street assumes a unique role in the Lawrence Douglas County transportation system. This principal arterial street currently conveys commuter traffic
Chapter 5 Traffic Analysis 5.1 SUMMARY US /West 6 th Street assumes a unique role in the Lawrence Douglas County transportation system. This principal arterial street currently conveys commuter traffic
Multnomah County Courthouse Relocation. Transportation Alternatives Analysis Technical Memorandum: FINAL
 Multnomah County Courthouse Relocation Portland, Oregon Transportation Alternatives Analysis Technical Memorandum: FIL Prepared for Multnomah County Facilities and Property Management Division 41 N Dixon
Place Vanier 250 Montreal Road Transportation Impact Study Addendum. Prepared for Broccolini Construction September 20 th, 2012
 Update for the May 31 st, 2012 Traffic Impact Study Prepared for Broccolini Construction 111-23596-00 September 20 th, 2012 2611 Queensview Drive, Suite 300, Ottawa, Ontario CANADA K2B 8K2 Telephone: 613-829-2800
THE GEORGE WASHINGTON UNIVERSITY SITE 75A TRANSPORTATION IMPACT STUDY WASHINGTON, DC
 THE GEORGE WASHINGTON UNIVERSITY SITE 75A TRANSPORTATION IMPACT STUDY WASHINGTON, DC Submitted on behalf of: The George Washington University Prepared by: Wells + Associates, Inc. February 2012 TABLE OF
Capital Region Council of Governments
 March 23, 2018 Capital Region Council of Governments PROJECT CONCEPT REPORT Realignment of Swamp and Northfield Road s approaches to Route 44 (Boston Turnpike) Town of Coventry SUMMARY: The Town of Coventry
Donahue Drive Corridor Traffic Operational Evaluation
 Donahue Drive Corridor Traffic Operational Evaluation PREPARED FOR: THE CITY OF AUBURN PREPARED BY: JANUARY 2007 Donahue Drive Corridor Study--Auburn, Alabama TABLE OF CONTENTS Introduction... 1 Background
ALLEY 24 TRAFFIC STUDY
 ALLEY 24 TRAFFIC STUDY in City of Frostburg, Maryland January 2013 3566 Teays Valley Road Hurricane, WV Office: (304) 397-5508 www.denniscorporation.com Alley 24 Traffic Study January 2013 Frostburg, Maryland
FUTURE CONDITIONS REPORT TRANSPORTATION FACILITIES PLANNING RIDGE ROAD
 FUTURE CONDITIONS REPORT TRANSPORTATION FACILITIES PLANNING RIDGE ROAD CONTRACT #H54591 January 217 Prepared by: 755 Samuel Morse Dr., Ste. 1 Columbia, MD 2146 443-741-35 sabra-wang.com Ridge Road Future
The proposed development is located within 800m of an existing Transit Station where infill developments and intensification are encouraged.
 Stantec Consulting Ltd. 1331 Clyde Avenue, Suite 4 Ottawa ON K2C 3G4 Tel: (613) 722-442 Fax: (613) 722-2799 May 14, 213 File: 1638823 Robinson Park Development Corp. 5699 Power Road Ottawa, ON, K1G 3N4
City of Homewood Transportation Plan
 City of Homewood Transportation Plan Prepared for: City of Homewood, Alabama Prepared by: Skipper Consulting, Inc. May 2007 TABLE OF CONTENTS INTRODUCTION... 1 BACKGROUND INFORMATION... 1 EXISTING TRANSPORTATION
Appendices. Appendix J: Traffic Study
 Appendices Appendix J: Traffic Study The Platinum Triangle Subsequent EIR The Planning Center Appendices This page intentionally left blank. The Platinum Triangle Subsequent EIR The Planning Center TRAFFIC
TRANSPORTATION ANALYSIS REPORT US Route 6 Huron, Erie County, Ohio
 TRANSPORTATION ANALYSIS REPORT US Route 6 Huron, Erie County, Ohio December 12, 2012 Prepared for: The City of Huron 417 Main Huron, OH 44839 Providing Practical Experience Technical Excellence and Client
Date: September 7, Project #: Re: Spaulding Youth Center Northfield, NH Property. Traffic Impact Study
 To: Ms. Susan C. Ryan Spaulding Youth Center 72 Spaulding Road Northfield, NH 03276 Date: September 7, 2017 Project #: 52455.00 From: Robin Bousa Director of Transportation Systems Re: Spaulding Youth
Henderson Avenue Mixed-Use Development
 Zoning Case: Z145-3 Traffic Impact Analysis Henderson Avenue Mixed-Use Development Dallas, TX October 26 th, 216 Kimley-Horn and Associates, Inc. Dallas, Texas Project #644827 Registered Firm F-928 Traffic
Congestion Mitigation at IH 27 and U.S. Hwy 70 in Plainview, TX
 2010 Congestion Mitigation at IH 27 and U.S. Hwy 70 in Plainview, TX Hongchao Liu, Hao Xu, and Rhett Dollins Multidisciplinary Research in Transportation Texas Tech University Mulidisciplinary Research
Traffic Impact Study, Premier Gold Mines Limited, Hardrock Property
 Traffic Impact Study, Premier Gold Mines Limited, Hardrock Property Prepared for: Premier Gold Mines Limited Prepared by: Stantec Consulting Ltd. November 2014
Harrah s Station Square Casino
 Transportation Analysis Harrah s Station Square Casino Pittsburgh, Pennsylvania Submitted To: City of Pittsburgh and Pennsylvania Gaming Control Board Prepared By: DKS Associates GAI Consultants December
Route 7 Corridor Study
 Route 7 Corridor Study Executive Summary Study Area The following report analyzes a segment of the Virginia State Route 7 corridor. The corridor study area, spanning over 5 miles in length, is a multi
Benga Mining Limited Grassy Mountain Coal Project Appendix 8: Traffic Impact Assessment. Appendix 8 Traffic Impact Assessment
 Benga Mining Limited Grassy Mountain Coal Project Appendix 8: Traffic Impact Assessment Appendix 8 Traffic Impact Assessment August 216 Riverdale Resources Proposed Coal Mine near Blairmore AB Traffic
Appendix B: Forecasting and Traffic Operations Analysis Framework Document
 Existing Conditions Report - Appendix Appendix B: Forecasting and Traffic Operations Analysis Framework Document This document defines the methodology and assumptions that will be used in the traffic forecasting
NO BUILD TRAFFIC OPERATIONS
 3. 23 NO BUILD TRAFFIC OPERATIONS This section addresses the operations of the transportation system and details how it would be expected to function under year 23 No Build conditions with the projected
LIBERTY TREE ACADEMY TRAFFIC IMPACT STUDY
 LIBERTY TREE ACADEMY TRAFFIC IMPACT STUDY Prepared for: Liberty Tree Academy Prepared by: 161 Blake Street, Suite 2 Denver, Colorado 822 Contact: David Kline, PE, PTOE (33)-572-2 On Behalf of: Liberty
Evaluation of M-99 (Broad Street) Road Diet and Intersection Operational Investigation
 Road Diet and Intersection Operational Investigation") Evaluation of M-99 (Broad Street) Road Diet and Intersection Operational Investigation City of Hillsdale, Hillsdale County, Michigan June 16, 2016 Final Report Prepared for City of Hillsdale 97 North Broad
Evaluation of M-99 (Broad Street) Road Diet and Intersection Operational Investigation City of Hillsdale, Hillsdale County, Michigan June 16, 2016 Final Report Prepared for City of Hillsdale 97 North Broad
DUNBOW ROAD FUNCTIONAL PLANNING
 DUNBOW ROAD FUNCTIONAL PLANNING Final Report August 3, 216 #31, 316 5th Avenue NE Calgary, AB T2A 6K4 Phone: 43.273.91 Fax: 43.273.344 wattconsultinggroup.com Dunbow Road Functional Planning Final Report
MoPac South: Impact on Cesar Chavez Street and the Downtown Network
 MoPac South: Impact on Cesar Chavez Street and the Downtown Network Prepared by: The University of Texas at Austin Center for Transportation Research Prepared for: Central Texas Regional Mobility Authority
Gateway Transportation Study
 Gateway Transportation Study Amherst, Massachusetts SUBMITTED TO University of Massachusetts Amherst Town of Amherst SUBMITTED BY Vanasse Hangen Brustlin, Inc. Watertown, Massachusetts March 213 Back of
Queensgate Drive Corridor Traffic Study
 January 2015 Prepared for: City of Richland Prepared by: J-U-B ENGINEERS, Inc. 2810 W. Clearwater Avenue, Suite 201 Kennewick, Washington 99336 Table of Contents Introduction and Background... 1 Existing
Traffic Analysis Report I-5 Interchanges 14 and 19 (Green Springs and North Ashland Interchanges) City of Ashland Jackson County
 City of Ashland Jackson County") Traffic Analysis Report I-5 Interchanges 14 and 19 (Green Springs and North Ashland Interchanges) City of Ashland Jackson County Prepared for Oregon Department of Transportation, Region 3 3500 NW Stewart
Traffic Analysis Report I-5 Interchanges 14 and 19 (Green Springs and North Ashland Interchanges) City of Ashland Jackson County Prepared for Oregon Department of Transportation, Region 3 3500 NW Stewart
February 24, 2017 Project #: 20076
 February 24, 217 Project #: 276 Jinde Zhu Washington County Department of Land Use and Transportation 14 SW Walnut Street MS 17 Hillsboro, Oregon 97213 RE: Sunset Ridge Phase 2 Access Report and Zone Change
ENKA INTERMEDIATE SCHOOL
 TRANSPORTATION IMPACT ANALYSIS Prepared for Buncombe County Schools ENKA INTERMEDIATE SCHOOL Asheville, NC Project Number: 13-71 8/1/13 www.davenportworld.com DAVENlORT Transportation Impact Analysis Enka
DRAFT Davidson Elementary School Expansion Transportation Impact Analysis
 DRAFT Davidson Elementary School Expansion Transportation Impact Analysis Prepared for: Town of Davidson 216 S. Main Street Davidson, NC 28036 Prepared by: Stantec Consulting Services Inc. 2127 Ayrsley
STILLWATER AVENUE CORRIDOR STUDY Old Town, Maine
 Draft Study STILLWATER AVENUE CORRIDOR STUDY Old Town, Maine SUBMITTED TO: BANGOR AREA COMPREHENSIVE TRANSPORTATION SYSTEM SUBMITTED BY: I MAY 23, 2017 DRAFT STILLWATER AVENUE STUDY FINAL REPORT Table
Project Report. South Kirkwood Road Traffic Study. Meadows Place, TX October 9, 2015
 Meadows Place, TX October 9, 2015 Contents 1 Introduction... 1 2 Data Collection... 1 3 Existing Roadway Network... 2 4 Traffic Volume Development... 2 5 Warrant Analysis... 3 6 Traffic Control Alternative
City of Los Banos Traffic Model and Transportation Master Plan
 T A B L E O F C O N T E N T S P a g e 1 City of Los Banos Traffic Model and Transportation Master Plan Prepared for the City of Los Banos by PRISM Engineering Grant P. Johnson, PTOE, PE Professional Traffic
VIVA RETIREMENT COMMUNITIES OAKVILLE TRAFFIC IMPACT STUDY
 VIVA RETIREMENT COMMUNITIES OAKVILLE TRAFFIC IMPACT STUDY VIVA RETIREMENT COMMUNITIES OAKVILLE TRAFFIC IMPACT STUDY DECEMBER 2012 READ, VOORHEES & ASSOCIATES TORONTO, ONTARIO Read, Voorhees & Associates
COMMERCIAL DEVELOPMENT 2015 ROBERTSON ROAD OTTAWA, ONTARIO TRANSPORTATION BRIEF. Prepared for:
 COMMERCIAL DEVELOPMENT 2015 ROBERTSON ROAD OTTAWA, ONTARIO TRANSPORTATION BRIEF Prepared for: First Bay Properties Inc. 311 Richmond Road, Suite 203 Ottawa, ON K1Z 6X3 August 8, 2017 117-663 Brief_1.doc
RCCG Jesus House. Preliminary Plan # TRAFFIC STUDY. Prepared for: RCCG Jesus House Montgomery County, Maryland
 TRAFFIC STUDY Prepared for: Montgomery County, Maryland Prepared by: SSSTS Consulting (410) 718-8660(410) 718-8660 Table of Contents SECTION 1 - INTRODUCTION... 1 SECTION 2 - EXISTING CONDITIONS... 4 Public
Operational Comparison of Transit Signal Priority Strategies
 Operational Comparison of Transit Signal Priority Strategies Revision Submitted on: November, 0 Author: Adriana Rodriguez, E.I Assistant Engineer Parsons Brinckerhoff 0 South Orange Avenue, Suite 00 Orlando,
Meadowlake Ranch Traffic Impact Analysis (LSC #184600) August 27, 2018
 August 27, 2018") LSC TRANSPORTATION CONSULTANTS, INC. 545 East Pikes Peak Avenue, Suite 210 Colorado Springs, CO 80903 (719) 633-2868 FAX (719) 633-5430 E-mail: lsc@lsctrans.com Website: http://www.lsctrans.com Traffic
LSC TRANSPORTATION CONSULTANTS, INC. 545 East Pikes Peak Avenue, Suite 210 Colorado Springs, CO 80903 (719) 633-2868 FAX (719) 633-5430 E-mail: lsc@lsctrans.com Website: http://www.lsctrans.com Traffic
joint access drive. will be
 Date: To: From: Subject: June 22, 2015 Bradley Reiner, PE Bowman Consulting David R. Kline, PE, PTOE, Incline Associates Thornton Self-Storage Traffic Analysis (DRAFT) - Thornton, Colorado INTRODUCTION
THIS PAGE LEFT BLANK INTENTIONALLY
 GA SR 25 Spur at Canal Road Transportation Impact Analysis PREPARED FOR GLYNN COUNTY, GEORGIA 1725 Reynolds Street, Suite 300 Brunswick, Georgia 31520 PREPARED BY 217 Arrowhead Boulevard Suite 26 Jonesboro,
Traffic Impact Study. Roderick Place Columbia Pike Thompson s Station, TN. Transportation Group, LLC Traffic Engineering and Planning
 F i s c h b a c h Transportation Group, LLC Traffic Engineering and Planning Traffic Impact Study Roderick Place Columbia Pike Thompson s Station, TN Prepared March 2016 Ms. Gillian L. Fischbach, P.E.,
MEMORANDUM. Our project study area included the following locations:
 MEMORANDUM Date: To: From: Subject: Najib O. Habesch Nick M. Fomenko, PE, PTOE Bushnell Park North Traffic Assessment BETA Project #: 4461 As part of our contract to undertake the design of the Bushnell
133 rd Street and 132 nd /Hemlock Street 132 nd Street and Foster Street MINI ROUNDABOUTS. Overland Park, Kansas
 133 rd Street and 132 nd /Hemlock Street 132 nd Street and Foster Street MINI ROUNDABOUTS Overland Park, Kansas September 1, 2017 TABLE OF CONTENTS 1. INTRODUCTION... 1 2. LITERATURE REVIEW... 1 3. CONCEPT
ENHANCED PARKWAY STUDY: PHASE 2 CONTINUOUS FLOW INTERSECTIONS. Final Report
 Preparedby: ENHANCED PARKWAY STUDY: PHASE 2 CONTINUOUS FLOW INTERSECTIONS Final Report Prepared for Maricopa County Department of Transportation Prepared by TABLE OF CONTENTS Page EXECUTIVE SUMMARY ES-1
MEMORANDUM. DATE March 1, 2012 TO Town of Milton Mark Abbott, Seth Asante, and Efi Pagitsas Boston Region MPO Staff
 MEMORANDUM DATE March 1, 212 TO Town of Milton FROM RE Mark Abbott, Seth Asante, and Efi Pagitsas Boston Region MPO Staff FFY 211 Safety and Operations Analyses at Selected Boston Region MPO Intersections:
South Street Campus Lands Development. City of London TRANSPORTATION IMPACT ASSESSMENT
 South Street Campus Lands Development City of London TRANSPORTATION IMPACT ASSESSMENT TW1387 South Street Campus Lands Development City of London TRANSPORTATION IMPACT ASSESSMENT May 2013 South Street
March 11, Lynnfield Board of Selectmen Town of Lynnfield 55 Summer Street Lynnfield, MA Walnut Street Traffic Assessment
 March 11, 2015 Lynnfield Board of Selectmen Town of Lynnfield 55 Summer Street Lynnfield, MA 01940 Re: Walnut Street Traffic Assessment Dear Board of Selectmen Members: As requested, BETA Group, Inc. (BETA)
FRONT RANGE CROSSINGS TRAFFIC IMPACT STUDY
 FRONT RANGE CROSSINGS TRAFFIC IMPACT STUDY Prepared for: City of Thornton And Colorado Department of Transportation Prepared by: 11 Blake Street, Suite 2 Denver, Colorado 822 Contact: Brian Bern, PE, PTOE
Preliminary Transportation Analysis
 Preliminary Transportation Analysis Goals of a Robust, Multimodal Transportation Network Safe Accessible/Connected Efficient Comfortable Context-Sensitive Motor Vehicle: Continue to analyze the data to
Marina Loft (DRC 51-R-12)
") Marina Loft (DRC 51-R-12) traffic study prepared for: Cymbal Development OCtober 2012 Traf Tech October 1, 2012 Mr. Asi Cymbal - President Cymbal Development 3470 North Miami Avenue Upper Suite Miami,
Marina Loft (DRC 51-R-12) traffic study prepared for: Cymbal Development OCtober 2012 Traf Tech October 1, 2012 Mr. Asi Cymbal - President Cymbal Development 3470 North Miami Avenue Upper Suite Miami,
Figure 1: East West Connector Alignment Alternatives Concept Drawing
 Page 2 of 9 Figure 1: East West Connector Alignment Alternatives Concept Drawing The Montebello Drive extension will run north south and connect Wilsonville Road to the Boones Ferry Road to Brown Road
Grant Avenue Streetscape
 REPORT TYPE GOES HERE Grant Avenue Streetscape PREPARED FOR City of Manassas 9027 Center Street Manassas, VA 20110 PREPARED BY 8300 Boone Boulevard Suite 700 Vienna, Virginia 22182 571.389.8121 July 31,