Estimating Economic Impacts of Multi-Hazards in USGS HayWired Scenario Using REMI
|
|
|
- Dylan Houston
- 5 years ago
- Views:
Transcription
1 Estimating Economic Impacts of Multi-Hazards in USGS HayWired Scenario Using REMI PRELIMINARY RESULTS Presented by: Cynthia Kroll, Bobby Lu, ABAG and MTC REMI User s Conference, Charleston, South Carolina


2 A SAFRR Project (USGS): HayWired SAFRR Project: Science Application for Risk Reduction
3 The HayWired Scenario Hayward fault rupture, Mag 7, 2018 o o Most urbanized fault in the US Epicenter, Oakland Connectedness theme o Earthquake sequence o Wired & wireless world o Lifelines interdependencies o Fire following earthquake o Communities at risk o Digital economy
4 Economics Portion of HayWired Disaggregation of HAZUS industry impacts (Marin Economics) CGE Model (USC, Adam Rose) Commuter Analysis (Strategic Economics) REMI analysis Anne Wein, USGS, Project Manager

5 HayWired: Estimates of Ground Shaking I Not felt Not felt except by a very few under especially favorable conditions. II Weak Felt only by a few persons at rest,especially on upper floors of buildings. III Weak Felt quite noticeably by persons indoors, especially on upper floors of buildings. Many people do not recognize it as an earthquake. Standing motor cars may rock slightly. Vibrations similar to the passing of a truck. Duration estimated. IV Light Felt indoors by many, outdoors by few during the day. At night, some awakened. Dishes, windows, doors disturbed; walls make cracking sound. Sensation like heavy truck striking building. Standing motor cars rocked noticeably. V Moderate Felt by nearly everyone; many awakened. Some dishes, windows broken. Unstable objects overturned. Pendulum clocks may stop. VI Strong Felt by all, many frightened. Some heavy furniture moved; a few instances of fallen plaster. Damage slight. VII Very strong Damage negligible in buildings of good design and construction; slight to moderate in well-built ordinary structures; considerable damage in poorly built or badly designed structures; some chimneys broken. VIII Severe Damage slight in specially designed structures; considerable damage in ordinary substantial buildings with partial collapse. Damage great in poorly built structures. Fall of chimneys, factory stacks, columns, monuments, walls. Heavy furniture overturned. IX Violent Damage considerable in specially designed structures; well-designed frame structures thrown out of plumb. Damage great in substantial buildings, with partial collapse. Buildings shifted off foundations. X Extreme Some well-built wooden structures destroyed; most masonry and frame structures destroyed with foundations. Rails bent.

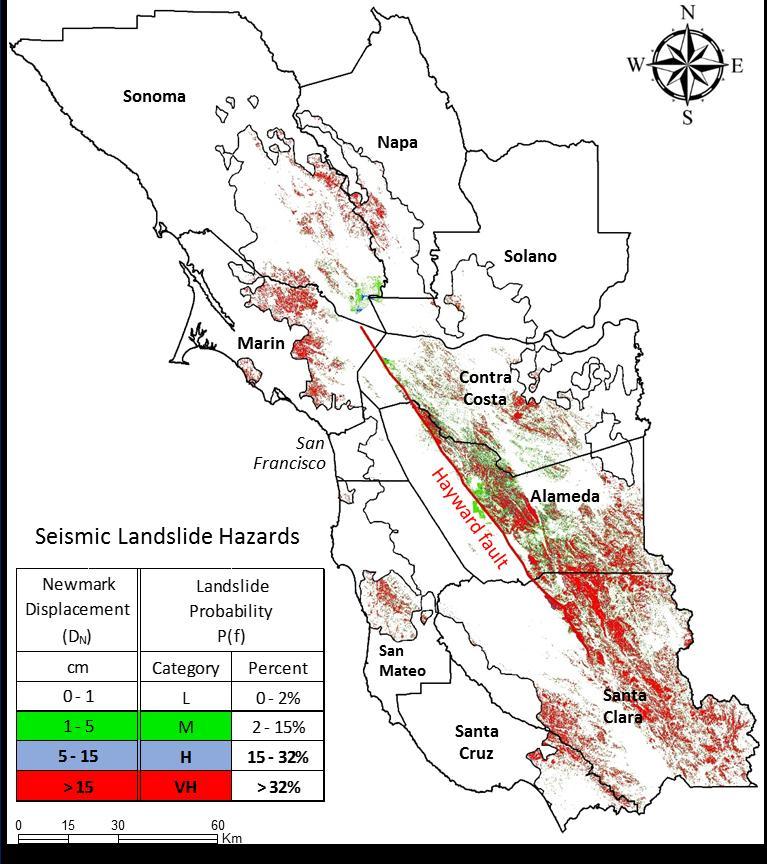
6 HayWired: Liquefaction and Landslides

7 ' ' ' ' ' HayWired: Mainshock Damage Footprint (HAZUS) Percent of buildings extensively or completely damaged by Shaking Liquefaction Landslide Fire 38 20' 38 10' ' 37 40' 37 30' 37 20' PetalumaSONOMA MARIN P a c i f i c O c e a n Novato SanRafael SAN FRANCISCO HayWired Scenario Rupture Highways City Boundary Central Business District Preserved Land Percentageof all occupancy class Daly City Napa NAPA Richmond SAN MATEO Oakland Alameda Vallejo Berkeley South San Francisco SanMateo Fairfield SanLeandro RedwoodCity building squarefoot that is extensively or completely damaged (by shaking, liquefaction, landslides, fire) displayed in developed area of 2010 census tracts. 60% % 20% % 10% % S an P a bl o B a y S an F r a nc is c o B ay Hayward SOLANO Concord ALAMEDA Fremont Pittsburg Milpitas PaloA lmtoountain View Sunnyvale Santa Clara Walnut Creek CONTRA COSTA UnionCity Antioch Livermore Pleasanton Cupertino SANTA CLARA SanJose 37 10' 2% % 0% % km

8 HayWired: Aftershocks 16 M5+ aftershocks in 2 years Contribute 20% of building losses 12% from 3 aftershocks M % from 13 aftershocks M Some areas more damaged by aftershocks than M7 Repeat liquefaction damage is possible
9
10
11 ABAG REMI Model ABAG Regional Control in REMI Model ABAG REMI subregions: o East Bay: Alameda, Contra Costa; each of these two counties is bisected by the Hayward Fault; in the Haywired scenario, the epicenter of the HayWired mainshock earthquake is in the city of Oakland, Alameda county in the East Bay o South Bay: Santa Clara; the Hayward fault rupture extends into the northern part of the county o West Bay: Marin, San Francisco, San Mateo; landslides occur in Marin and Liquefaction occurs in San Mateo and San Francisco o North Bay: Napa, Solano, Sonoma; strong to extreme shaking occurs throughout these counties. o Rest of California: Remaining 49 California counties
12 HayWired Direct Loss from HAZUS* Results Capital stock (building and building contents) loss: $83 Billion (2015$) Sub Regions Residential Non-Residential Share of Residential Stock Share of Non- Residential Stock East Bay % 12.21% North Bay % 2.31% West Bay % 4.07% South Bay % 8.35% Rest of California % 0.06% Source: ABAG from REMI and HAZUS results *HAZUS results were used to calculate the share of loss, which was applied to REMI baseline projections
13 HayWired Direct Loss Results from HAZUS 3-year total direct output loss: $24.55 Billion (2015$) Sub Regions 1 st year 2 nd year 3 rd year East Bay North Bay West Bay South Bay Rest of California Source: ABAG from REMI and HAZUS results *HAZUS results were used to calculate the share of loss, which was applied to REMI baseline projections
14 Economic Analysis Elements for REMI Elements Description Expected Results Building Damage Output Loss Employment Change Population Change Government Spending Government Revenue Sources Business Costs Buildings with extensive or complete damage in HAZUS output Direct output loss resulting from building and contents damage Employment loss due to disruption, gains from recovery efforts Complex mix direct loss from damage, indirect from employment loss, other moves Disaster relief has some boosts to the economy, but may be offset by cuts in other services Simulate a tax increase Production cost is likely to increase for a period of time due to factors such as increase in insurance premiums, and transportation costs New investment, and induced employment growth Employment, GDP, population loss in short term Mixed. Temporary decline in most sectors, increase in construction, some others. Long term uncertain Migration mixed recovery workers in, non-economic outmigration. Negative nonpecuniary effects on population, labor force, jobs Government spending will increase employment, output and income, to the extent that it is exogenous Sales tax may have modest increase on output, employment Decrease in output and employment for some time
15 HayWired Scenario Simulation Impact in REMI Residential and Non-residential Capital Stock Loss in 2018 Direct Output Loss by Industry in 2018, 2019 and 2020 Insurance Cost Increase for Businesses for 20 years Non-Pecuniary (Amenity) Aspects Loss from Casualties in 2018 Local and State Government Spending Decrease + Increase in Intermediate Demand from Disaster Recovery Investment (Local, State and Federal) for 10 years Sales Tax Increase for 10 years
16 1-1. Residential and Non-residential Capital Stock Loss in 2018 Sub Regions Residential Non-Residential East Bay North Bay West Bay South Bay Rest of California
17 1-2. Capital Stock Loss Impacts on Employment by Sector 30 Accommodation and Food Administrative and Waste Management 25 Arts, Entertainment, and Recreation Construction Educational 20 Finance and Insurance Forestry, Fishing, and Related Activities 15 Health Care and Social Assistance Information Management of Companies and Enterprises 10 Manufacturing Mining Other Services, except Public Administration 5 Professional, Scientific, and Technical Real Estate and Rental and Leasing Retail Trade 0-5 Transportation and Warehousing Utilities Wholesale Trade Government Farm
18 Thousands Thousands 1-3. Capital Stock Loss Impacts on Population 8 Net Economic Migrants 35 Total Population East Bay North Bay West Bay South Bay East Bay North Bay West Bay South Bay
19 2-1. Direct Output Loss by Industry in 2018, 2019 and 2020 HAZUS estimated direct output loss for 3 years Taking into account overall repair time and cost, and recaputure factor for buildings in each occupancy class Loss in second and third year concentrates in accommodation sector and nursing homes Bay Area: $25 Billion loss (2016$) 3.2% of Bay Area 2016 GDP
20 Thousands 2-2. Direct Output Loss Impacts on Employment by Sector Forestry, Fishing, and Related Activities Mining Utilities Construction Manufacturing Wholesale Trade Retail Trade Transportation and Warehousing Information Finance and Insurance Real Estate and Rental and Leasing Professional, Scientific, and Technical Services Management of Companies and Enterprises Administrative and Waste Management Services Educational Services Health Care and Social Assistance Arts, Entertainment, and Recreation Accommodation and Food Services Other Services, except Public Administration Government Farm
21 Thousands Thousands 2-3. Direct Output Loss Impacts on Population 20 Net Economic Migrants 10 Total Population East Bay North Bay West Bay South Bay East Bay North Bay West Bay South Bay
22 Thousands 3-1. Insurance Cost Increase Impact on Employment by Sector Forestry, Fishing, and Related Activities Mining Utilities Construction Manufacturing Wholesale Trade Retail Trade Transportation and Warehousing Information Finance and Insurance Real Estate and Rental and Leasing Professional, Scientific, and Technical Services Management of Companies and Enterprises Administrative and Waste Management Services Educational Services Health Care and Social Assistance Arts, Entertainment, and Recreation Accommodation and Food Services Other Services, except Public Administration Government Farm
23 Thousands 3-2. Insurance Cost Increase Impact on Total Population South Bay West Bay North Bay East Bay
24 4-1. Non-Pecuniary (Amenity) Aspects Loss Total Number of Deaths: 2025 Bay Area Air Quality Management District Estimated Value of Health Endpoint for Mortality: $8.8M (2015$) Total Value of Amenity Loss: $17.82B Time of day Day (2 p.m.) Night (2 a.m.) Commute (5 p.m.) Casualties severity level Total Casuality Level 1 (First aid only) Level Level Level 4 (Death) 840 Total Level 1 (First aid only) 8562 Level Level Level 4 (Death) 341 Total Level 1 (First aid only) Level Level Level 4 (Death) 844 Total 16525
25 Thousands Thousands 4-2. Non-Pecuniary (Amenity) Aspects Loss Impacts on Employment and Population Employment Population East Bay North Bay West Bay South Bay East Bay North Bay West Bay South Bay
26 5-1. Disaster Relief Federal post-disaster recovery spending coverage (CNN, 2017): 72% of Hurricane Katrina, $114.5B of $160B estimated loss 80% of Hurricane Sandy, $56B of $70B estimated loss Assumption: Government aids from all levels covers two thirds of estimated loss, $52B Local and State Government is responsible for 1/4 of government aids, the rest is exogenous federal spending into the region REMI Translation: $13B (2015$) decrease in local and state government spending (2015$) in 10 years $52B (2015$) increase in intermediate demand of Construction sector in 10 years
27 Thousands 5-2. Disaster Relief Impacts on Employment by Sector Forestry, Fishing, and Related Activities Mining Utilities Construction Manufacturing Wholesale Trade Retail Trade Transportation and Warehousing Information Finance and Insurance Real Estate and Rental and Leasing Professional, Scientific, and Technical Services Management of Companies and Enterprises Administrative and Waste Management Services Educational Services Health Care and Social Assistance Arts, Entertainment, and Recreation Accommodation and Food Services Other Services, except Public Administration Government Farm
28 Thousands Thousands 5-3. Disaster Relief Impacts on Population Net Economic Migrants Total Population East Bay North Bay West Bay South Bay East Bay North Bay West Bay South Bay
29 6-1. Three Quarters Per Cent Sales Tax Increase Annual Increase in Sales Revenue: East Bay: $25.6M North Bay: $10.9M West Bay:$22.6M South Bay:$22.6M Bay Area Total: $81.7M Source: Calculated Using CA BOE Data
30 Thousands 6-2. Sales Tax Increase Impacts on Employment by Sector Forestry, Fishing, and Related Activities Mining Utilities Construction Manufacturing Wholesale Trade Retail Trade Transportation and Warehousing Information Finance and Insurance Real Estate and Rental and Leasing Professional, Scientific, and Technical Services Management of Companies and Enterprises Administrative and Waste Management Services Educational Services Health Care and Social Assistance Arts, Entertainment, and Recreation Accommodation and Food Services Other Services, except Public Administration Government Farm
31 Thousands 6-3. Sales Tax Increase Impacts on Population 0 Total Population South Bay West Bay North Bay East Bay
32 Thousands 7-1. Combined Impacts on Employment Forestry, Fishing, and Related Activities Mining Utilities Construction Manufacturing Wholesale Trade Retail Trade Transportation and Warehousing Information Finance and Insurance Real Estate and Rental and Leasing Professional, Scientific, and Technical Services Management of Companies and Enterprises Administrative and Waste Management Services Educational Services Health Care and Social Assistance Arts, Entertainment, and Recreation Accommodation and Food Services Other Services, except Public Administration Government Farm
33 Thousands Thousands 7-2. Combined Impacts on Population Net Economic Migrants Total Population East Bay North Bay West Bay South Bay East Bay North Bay West Bay South Bay
34 Remaining Limitations, Questions and Next Steps Limitations and Questions Model assumptions that labor substitutes for capital stock Avoiding double counting of capital stock impacts. Sales tax measure tiny relative to stimulous. What else would be feasible in the model? How do we estimate and factor in productivity loss so that it results in further output decrease? Next Steps HayWired aspects Resilience due to ability to work remotely Relocation due to ability to work remotely Disruption or stimulus due to changes in wireless services? Household, community and transportation disruptions Real estate prices
Nevada County Population Projections 2015 to 2034
 Nevada County Population Projections 2015 to 2034 Prepared By: Jeff Hardcastle, AICP Nevada State Demographer Nevada Department of Taxation Reno Office: 4600 Kietzke Lane, Building L Suite 235 Reno, NV
Fixed Guideway Transit Outcomes on Rents, Jobs, and People and Housing
 Fixed Guideway Transit Outcomes on Rents, Jobs, and People and Housing Arthur C. Nelson, Ph.D., ASCE, FAICP Professor of Planning and Real Estate Development University of Arizona 1 Changing Transportation
Webinar: The Association Between Light Rail Transit, Streetcars and Bus Rapid Transit on Jobs, People and Rents
 Portland State University PDXScholar TREC Webinar Series Transportation Research and Education Center (TREC) 11-15-2016 Webinar: The Association Between Light Rail Transit, Streetcars and Bus Rapid Transit
Nevada County Population Projections 2013 to 2032 Based On The Last Estimate Year of 2012
 Nevada County Population Projections 2013 to 2032 Based On The Last Estimate Year of 2012 Prepared By: The Nevada State Demographer s Office Jeff Hardcastle, AICP NV State Demographer University of NV
THE ECONOMIC, CLIMATE, FISCAL, POWER, AND DEMOGRAPHIC IMPACT OF A NATIONAL FEE-AND- DIVIDEND CARBON TAX
 THE ECONOMIC, CLIMATE, FISCAL, POWER, AND DEMOGRAPHIC IMPACT OF A NATIONAL FEE-AND- DIVIDEND CARBON TAX Regional Economic Models, Inc. Study Authors Scott Nystrom, M.A. Regional Economic Models, Inc. (REMI)
The Wisconsin and Minnesota Economies: What can we learn from each other? Noah Williams
 The Economies: What can we learn from each other? Noah University of Wisconsin - Madison Future Wisconsin Summit 2016 Economies Location, size, demographics, and history make Wisconsin and Minnesota natural
Noah Williams. University of Wisconsin-Madison Center for Research On the Wisconsin Economy (CROWE) Outlook for the Wisconsin Economy
 Outlook for the Wisconsin Economy") An Noah University of Wisconsin-Madison Center for Research On the Wisconsin Economy (CROWE) CROWE: Brief Introduction Center for Research on the Wisconsin Economy (CROWE) recently established in the Department
An Noah University of Wisconsin-Madison Center for Research On the Wisconsin Economy (CROWE) CROWE: Brief Introduction Center for Research on the Wisconsin Economy (CROWE) recently established in the Department
2018 Economic Outlook Forum Daraius Irani, Ph.D. Chief Economist, Regional Economic Studies Institute VP, Division of Strategic Partnerships and
 2018 Economic Outlook Forum Daraius Irani, Ph.D. Chief Economist, Regional Economic Studies Institute VP, Division of Strategic Partnerships and Applied Research Towson University November 29, 2018 $19,000
Texas Housing Markets: Metropolitan vs. Border Communities. September 22, 2014
 Texas Housing Markets: Metropolitan vs. Border Communities Luis Bernardo Torres Ruiz, Ph.D. Research Economist El Paso Branch Dallas Federal Rio Grande Economic Association September 22, 2014 Contents
Big Changes, Unknown Impacts
 Big Changes, Unknown Impacts Boulder Economic Forecast Place cover image here Richard Wobbekind Senior Economist and Associate Dean for Business and Government Relations January 17, 2018 Real GDP Growth
2015 Economic Forecast & Industry Outlook. Robert A. Kleinhenz, Ph.D. Chief Economist, Kyser Center for Economic Research, LAEDC October 8, 2014
 2015 Economic Forecast & Industry Outlook Robert A. Kleinhenz, Ph.D. Chief Economist,, LAEDC October 8, 2014 Outline U.S. Economy California Economy Southern California Economy & Industries Five-Year Outlook
colorado.edu/business/brd
 colorado.edu/business/brd Big Changes, Unknown Impacts Southwest Business Forum Place cover image here Richard Wobbekind Senior Economist and Associate Dean for Business and Government Relations January
Antitrust Reminder. August 25, Solar Energy Industries Association 1
 Antitrust Reminder As a trade association of competitors, SEIA must comply with federal and D.C. antitrust laws. Competitively sensitive matters cannot be discussed on this webinar, including product prices;
The Economic Value of Federal Public Lands
 The Economic Value of Federal Public Lands Ver. 5-15-18 Outline Federal Lands Have Many Values Context: The U.S. Economy Context: The West s Economy A Theory of Rural Development The Role of Federal Lands
Southern California Economic Forecast & Industry Outlook
 2016-17 Southern California Economic Forecast & Industry Outlook Robert A. Kleinhenz, Ph.D. Sr. VP/Chief Economist, LAEDC February 17, 2016 Outline U.S. Economy California Economy Southern California Economy
Louisiana Energy Workforce Outlook. Stephen R. Barnes, PhD
 Louisiana Energy Workforce Outlook Stephen R. Barnes, PhD US Employment by Industry Education & Health Services 14% Professional & Business Services 14% Leisure & Hospitality 10% Manufacturing 7% Government
Wenlin Liu, Senior Economist. Stateof Wyoming. Economic Analysis Division State of Wyoming 1
 WYOMING DEMOGRAPHIC AND ECONOMIC TREND LCCC LIFE Program April 7, 2012 Cheyenne, Wyoming Wenlin Liu, Senior Economist Economic Analysis Division Stateof Wyoming Economic Analysis Division State of Wyoming
State of the City of Carpinteria
 April 21, 2017 Mark Schniepp Director State of the City of Carpinteria jobs 1,000 Employment in Information / Carpinteria Valley 2006 -- 2016 800 600 400 200 0 2006 2008 2010 2012 2014 2016 ConstructiveDIVE.com
The Erie Economy: Performance, Opportunities, and Challenges
 The Erie Economy: Performance, Opportunities, and Challenges Eggs n Issues Manufacturer and Business Association December 2015 Dr. Kenneth Louie The Economic Research Institute of Erie Sam and Irene Black
Congestion Evaluation Best Practices
 Congestion Evaluation Best Practices Todd Litman Victoria Transport Policy Institute Presented International Transportation and Economic Development Conference 10 April 2014 Congestion Indicators Indicator
RESIDENTIAL AND GOLF COURSE MARKET ANALYSIS AND FINANCIAL FEASIBILITY STUDY
 RESIDENTIAL AND GOLF COURSE MARKET ANALYSIS AND FINANCIAL FEASIBILITY STUDY APPLETREE GOLF COURSE FOUNTAIN, COLORADO PREPARED FOR: CITY OF FOUNTAIN Economic & Market Research / Land & Development Planning
Telling Canada s story in numbers Elizabeth Richards Analytical Studies Branch April 20, 2017
 Recent Developments in the Canadian Economy: How have the decline in oil prices and a weaker Canadian dollar affected Canada s economy? www.statcan.gc.ca Telling Canada s story in numbers Elizabeth Richards
ECONOMIC DEVELOPMENT ELEMENT
 ECONOMIC DEVELOPMENT ELEMENT Background The Economic Development Element considers labor force and labor force characteristics, employment by place of work and residence, and analysis of the community
Job Creation Survey, 4 th Quarter 2015 and 1 st Quarter 2016
 Job Creation Survey, 4 th Quarter 2015 and 1 st Quarter 2016 Summary Finding and Selected Tables National Bureau of Statistics June, 2016. Summary Findings and Tables of the Quarterly Job Creation 4 th
Good TOD. July 7, 2016 SPUR
 Good TOD July 7, 2016 SPUR Caltrain TOD Context: Growing Demand For Service Extraordinary Ridership Growth Projected Continued Growth High Speed Rail Service on the Peninsula Increasing Land Use Intensities
The U.S. Economic Outlook
 The U.S. Economic Outlook Presented to: Maquiladora Industry Outlook Conference September 29 2006 Presented by: Patrick Newport Principal, U.S. Macroeconomic Service 781-301-9125 patrick.newport@globalinsight.com
Spring 2011 Community-Based Outreach Results
 Spring 2011 Community-Based Outreach Results In an effort to reach some of the typically underrepresented communities of the Bay Area, the Metropolitan Transportation Commission (MTC) and the Association
The University of Georgia
 The University of Georgia Center for Agribusiness and Economic Development College of Agricultural and Environmental Sciences Economic Impacts of Alabama Quail Hunting Prepared by: Archie Flanders and
PROVINCE OF SASKATCHEWAN INVESTOR PRESENTATION
 PROVINCE OF SASKATCHEWAN INVESTOR PRESENTATION May 2018 THE SASKATCHEWAN DIFFERENCE Economic Stability Diversified economy balances cyclicality of resources Growing population Majority government with
Vision - Britain's Ocean City One of Europe's most vibrant waterfront cities where an outstanding quality of life is enjoyed by everyone
 PLYMOUTH Economy Nina Sarlaka, Enterprise & Inward Investment Manager Vision - Britain's Ocean City One of Europe's most vibrant waterfront cities where an outstanding quality of life is enjoyed by everyone
Custer County Demographic Profile
 Custer County Demographic Profile Prepared by Southern Colorado Economic Development District 1104 North Main Street Pueblo, CO 81003 719-545-8680 Table of Contents Custer County... 3 Transportation...
The Auction Market In 2015 & 2016 Review & Forecast. Dr. Ira Silver NAAA Economist
 The Auction Market In 2015 & 2016 Review & Forecast Dr. Ira Silver NAAA Economist silver@naaa.com Agenda Economic conditions Economic outlook Light vehicle sales Light vehicle sales outlook NAAA 2015 Annual
VALUES ASSOCIATED WITH THE APALACHICOLA BAY MARINE ECONOMY
 PBTC 03-3 VALUES ASSOCIATED WITH THE APALACHICOLA BAY MARINE ECONOMY By Alan W. Hodges and Charles Adams PBTC 03-3 March 2003 POLICY BRIEF SERIES INTERNATIONAL AGRICULTURAL TRADE AND POLICY CENTER MISSION
Bob Costello Chief Economist & Vice President American Trucking Associations. Economic & Motor Carrier Industry Update.
 Bob Costello Chief Economist & Vice President American Trucking Associations Economic & Motor Carrier Industry Update February 26, 2013 The Worst Recession Since the Great Depression 0% Loss from Peak
The US Economic Outlook
 IHS ECONOMICS US Outlook The US Economic Outlook November 2014 ihs.com Rafael Amiel, Director latin America Economics +1 215 789 7405, rafael.amiel.ihs.com 2014 IHS The US economy is gaining momentum Growth
Wildlife Watching in the U.S.: The Economic Impacts on National and State Economies in 2011
 U.S. Fish & Wildlife Service Wildlife Watching in the U.S.: The Economic Impacts on National and State Economies in 2011 Addendum to the 2011 National Survey of Fishing, Hunting, and Wildlife-Associated
By making use of SAFRIM (South African Inter-Industry Macro-Economic Model) By Jeaunes Viljoen, Conningarth Economists, 1
 By Jeaunes Viljoen, Conningarth Economists, 1") By making use of SAFRIM (South African Inter-Industry Macro-Economic Model) By Jeaunes Viljoen, Conningarth Economists, South Africa 10/13/2011 1 1960: The economy experienced high growth rates mining
By making use of SAFRIM (South African Inter-Industry Macro-Economic Model) By Jeaunes Viljoen, Conningarth Economists, South Africa 10/13/2011 1 1960: The economy experienced high growth rates mining
The U.S. Economy How Serious A Downturn? Nigel Gault Group Managing Director North American Macroeconomic Services
 The U.S. Economy How Serious A Downturn? Nigel Gault Group Managing Director North American Macroeconomic Services Growth Is Cooling; But a Soft Landing Is Likely (Real GDP, annualized rate of growth)
FEASIBILITY ASSESSMENT OF TOURISM SUBPROJECTS
 FEASIBILITY ASSESSMENT OF TOURISM SUBPROJECTS A. Overview 1. The proposed investment support for community based tourism was reviewed during an ADB mission from 17 th to 23 rd September 2016. The selected
WHERE ARE ARIZONA DEMOGRAPHICS TAKING US? HOW GROWING SLOWER, OLDER AND MORE DIVERSE AFFECTS REAL ESTATE
 WHERE ARE ARIZONA DEMOGRAPHICS TAKING US? HOW GROWING SLOWER, OLDER AND MORE DIVERSE AFFECTS REAL ESTATE March 2017 Tom Rex Office of the University Economist and Center for Competitiveness and Prosperity
Briefing on the State of the State. presented to the. SCAA Schuyler Center for Analysis and Advocacy
 Briefing on the State of the State presented to the SCAA Schuyler Center for Analysis and Advocacy Rae D. Rosen Assistant Vice President Federal Reserve Bank of New York November 16, 2006 Key Points: Economic
The 2010 Economic Contribution of Tourism to the Meadowlands Liberty Region
 The 2010 Economic Contribution of Tourism to the Meadowlands Liberty Region Key Metrics & Evaluation 93 MAIN STREET :: ANNAPOLIS, MD 21401 WWW.VANTAGESTRATEGY.COM :: 202-449- 9708 1 Vantage Strategy ::.
USTA Northern California Red Ball JTT Foundation Grant Request
 USTA Northern California Red Ball JTT Foundation Grant Request 1. Name of organization applying for Red Ball Junior Team Tennis Grant: 2. Full legal name and title of person applying for the grant: Full
Characteristics of the Labor Force - Poteau Area
 Not Not Number of respondents 275 42 614 71 543 391 55 Estimated Adults 21,257 2,956 47,302 5,554 41,747 29,188 3,881 Males 54.5 30.2 54.1 51.6 54.4 38.8 29.4 Females 45.5 69.8 45.9 48.4 45.6 61.2 70.6
The Nevada 1st Congressional District
 The Nevada st Area (square miles) Navigable Waterbody (square miles) Population (007) Population Density (per square mile) (007) Persons 8+ (007) Households (007) Table. Owned by Residents Residing in
Building Materials Forecasting Service. Executive Summary: Q2 2010
 Building Materials Forecasting Service Executive Summary: Q2 2010 Building Materials Overview Building materials have been hard hit by the recession in the U.S. housing market and the deep downturn in
The Australia US FTA: implications for international education
 The Australia US FTA: implications for international education Prepared for The Path to Cultural Understanding and Development 18th IDP Australian International Education Conference, Sydney 5-8 October
Economic Update and Outlook
 Economic Update and Outlook NAIOP Vancouver Chapter November 15, 2012 Helmut Pastrick Chief Economist Central 1 Credit Union Outline: Global, U.S., and Canadian economic conditions Canada economic and
Bob Costello Chief Economist & Vice President American Trucking Associations. Economic & Motor Carrier Industry Trends. September 10, 2013
 Bob Costello Chief Economist & Vice President American Trucking Associations Economic & Motor Carrier Industry Trends September 10, 2013 The Freight Economy Washington continues to be a headwind on economic
Canadian Teleconference: Can the Canadian Economy Survive the Turmoil in the United States?
 Canadian Teleconference: Can the Canadian Economy Survive the Turmoil in the United States? Nigel Gault Chief U.S. Economist Dale Orr Canadian Macroeconomic Services Copyright 2008 Global Insight, Inc.
2017 Nebraska Profile
 2017 Nebraska Profile State, 9 NEW Regions, 93 Counties, plus 31 Cities Three Volumes Demographic Change in the State Economic Influences at Work Housing Statistics and Trends Summary of Findings Discuss
Appendix B: Benefit-Cost Analysis
 Appendix B: Benefit-Cost Analysis RE-CONNECTING CLEVELAND: PATHWAYS TO OPPORTUNITY RE-CONNECTING CLEVELAND: PATHWAYS TO OPPORTUNITY [this page intentionally blank] RE-CONNECTING CLEVELAND: PATHWAYS TO
Purpose and Need. Chapter Introduction. 2.2 Project Purpose and Need Project Purpose Project Need
 Chapter 2 Purpose and Need 2.1 Introduction The El Camino Real Bus Rapid Transit (BRT) Project (Project) would make transit and other transportation improvements along a 17.6-mile segment of the El Camino
Independent Economic Analysis Board. Review of the Estimated Economic Impacts of Salmon Fishing in Idaho. Task Number 99
 IEAB Independent Economic Analysis Board Roger Mann, Chair Noelwah R. Netusil, Vice-Chair Kenneth L. Casavant Daniel D. Huppert Joel R. Hamilton Lon L. Peters Susan S. Hanna Hans Radtke Review of the Estimated
Economic Analysis What s happening with U.S. potential GDP growth?
 Economic Analysis What s happening with U.S. potential GDP growth? Kan Chen Capital stock, labor, and productivity do not show a significant increase following the recent fiscal stimulus According to our
Government finances A long term assessment. Presented by Edwina Matos Pereira
 Government finances A long term assessment Presented by Edwina Matos Pereira Walter Mosher June 22, 2010 Structure 1. Aruba s current fiscal landscape 2. Long term outlook & scenarios 3. Aruba s GDP volatility
Economy-wide (general equilibrium) analysis of Philippines mitigation potential
 analysis of Philippines mitigation potential") Global Trade Analysis Project Economy-wide (general equilibrium) analysis of Philippines mitigation potential Erwin Corong Center for Global Trade Analysis, Purdue University Crowne Plaza Hotel, Manila
Global Trade Analysis Project Economy-wide (general equilibrium) analysis of Philippines mitigation potential Erwin Corong Center for Global Trade Analysis, Purdue University Crowne Plaza Hotel, Manila
APPENDIX B: FUNDING MATRIX
 APPENDIX B: FUNDING MATRIX 101752 B - 1 FEDERAL SAFETEA-LU -- Congestion Mitigation and Air Quality Improvement Program (CMAQ) SAFETEA-LU -- Surface Transportation Program (STP)/Congestion Mitigation and
Studies in non-standard employment in Canada
 Studies in non-standard employment in Canada Geoff Bowlby, Director, Labour Statistics Division November 1, 2008 Defining non-standard employment According to Krahn s broad definition of non-standard employment
The U.S. Economic Outlook
 The U.S. Economic Outlook Nigel Gault Chief U.S. Economist, IHS Global Insight FTA Revenue Estimation & Tax Research Conference Charleston, West Virginia October 17, 2011 What Has Happened to the Recovery?
The World and U.S. Economy and San Pedro Bay Container Trade Outlook Forecast Review
 The World and U.S. Economy and San Pedro Bay Container Trade Outlook Forecast Review Michael Keenan Harbor Planning and Economic Analyst Port of Los Angeles October 5, 2009 Review of 2007 Container Trade
Growth, Innovation, and the Future of the Arizona Economy. Michael Crow Arizona State University December 21, 2016
 Growth, Innovation, and the Future of the Arizona Economy Michael Crow Arizona State University December 21, 2016 Billions Arizona Gross Domestic Product, 2005-2016 $280 $275 $270 $265 $260 $255 $250 $245
Inland Empire International Trade Economic Forecast
 Inland Empire International Trade Economic Forecast Mira Farka Adrian Fleissig Institute for Economic and Environmental Studies Orange County / Inland Empire Regional SBDC Network California State University,
Situational Analysis (Final)
") Situational Analysis (Final) City of Kawartha Lakes Office of Economic Development April-17 Table of Contents Kawartha Lakes at a Glance... - 1 - Statistical Highlights... - 3 - Demographics Analysis...
Situational Analysis (Final) City of Kawartha Lakes Office of Economic Development April-17 Table of Contents Kawartha Lakes at a Glance... - 1 - Statistical Highlights... - 3 - Demographics Analysis...
Guidelines for Providing Access to Public Transportation Stations APPENDIX C TRANSIT STATION ACCESS PLANNING TOOL INSTRUCTIONS
 APPENDIX C TRANSIT STATION ACCESS PLANNING TOOL INSTRUCTIONS Transit Station Access Planning Tool Instructions Page C-1 Revised Final Report September 2011 TRANSIT STATION ACCESS PLANNING TOOL INSTRUCTIONS
Labour Market Segmentation in Poland. Artur Gajdos Department of Spatial Econometrics University of Lodz
 Labour Market Segmentation in Poland Artur Gajdos Department of Spatial Econometrics University of Lodz gajdos@uni.lodz.pl Lisbon, 24 November 2016 Agenda Introduction Labour market facts Policy reforms
USTA NORTHERN CALIFORNIA FOUNDATION GRANT REQUEST
 USTA NORTHERN CALIFORNIA FOUNDATION GRANT REQUEST 1. Name of organization applying for Red Ball Junior Team Tennis Grant: 2. Name of contact and title of person applying for the Grant from the above organization
Dr. James P. Gaines Research Economist recenter.tamu.edu
 Texas Uncertain Economy in a World of Uncertain Oil Prices Dr. James P. Gaines Research Economist recenter.tamu.edu National Economic Recovery still Going 2 U.S. Outlook Expected GDP growth still modest:
NC s Shifting Population: Growth, Decline, and Rebound
 NC s Shifting Population: Growth, Decline, and Rebound House Select Committee on Strategic Transportation Planning and Long-Term Funding Solutions April 30, 2018 Rebecca Tippett, PhD Director, Carolina
Paul Bingham Managing Director, Global Trade and Transportation February 18, 2009
 Economic Outlook and Ports Paul Bingham Managing Director, Global Trade and Transportation February 18, 2009 The Outlook for Trade Depends on Goods Demand Integrated international supply-chains offer efficiencies
The Economic Impact of Golf In South Carolina
 The Economic Impact of Golf In South Carolina By Dudley Jackson Research Director South Carolina Department of Parks, Recreation and Tourism For South Carolina Golf Course Owners Association April 2016
What did the World Student Games do for Sheffield? The 1991 Games as the catalyst for the regeneration of Sheffield
 What did the World Student Games do for Sheffield? The 1991 Games as the catalyst for the regeneration of Sheffield Peter Taylor Emeritus Professor Sheffield Hallam University England Why host a major
Wildlife Watching in the U.S.: The Economic Impacts on National and State Economies in 2006
 U.S. Fish & Wildlife Service Wildlife Watching in the U.S.: The Economic Impacts on National and State Economies in 2006 Addendum to the 2006 National Survey of Fishing, Hunting, and Wildlife-Associated
North American Forging Shipment Forecast (Using FIA bookings information through December 2013)
") North American Forging Shipment Forecast 2014-2018 (Using FIA bookings information through December 2013) Percent Change Year Ago Best leading indicator combination for impression die bookings used to
North American Forging Shipment Forecast 2014-2018 (Using FIA bookings information through December 2013) Percent Change Year Ago Best leading indicator combination for impression die bookings used to
Fiscal Impact of SunTrust Park and The Battery Atlanta on Cobb County Executive Summary Sept. 18, 2018
 Fiscal Impact of SunTrust Park and The Battery Atlanta on Cobb County Executive Summary Sept. 18, 2018 Overview Historically, professional sports stadiums were privately owned by the sports teams that
University Of Maryland
 2000 Census Census Data 200 Census Change 2000 to 200 SUBJECT Number Percent SUBJECT Number Percent Number Percent TOTAL POPULATION 437 TOTAL POPULATION 246-9 -43.7 White 283 64.8 White 65 67. -8-4.7 Black
OBJECTIVES OUTLINE SOURCE OF DATA INITIAL RESULTS IN THE ATTEMPT
 OBJECTIVES INITIAL RESULTS IN THE ATTEMPT TO ASSESS THE LOCAL ECONOMY AND THE PHYSICAL ENVIRONMENT OF THE MANILA DISTRICTS OF MALATE AND DILAO, -1893 Lagman, Marco Stefan Martinez, Ma. Simeona Villasper,
U.S. and Colorado Economic Outlook National Association of Industrial and Office Parks. Business Research Division Leeds School of Business
 U.S. and Colorado Economic Outlook National Association of Industrial and Office Parks Presented by the Business Research Division Leeds School of Business University of Colorado at Boulder U.S. Economic
2018 Annual Economic Forecast Dragas Center for Economic Analysis and Policy
 2018 Annual Economic Forecast Dragas Center for Economic Analysis and Policy PRESENTING SPONSOR EVENT PARTNERS 2 The forecasts and commentary do not constitute an official viewpoint of Old Dominion University,
Crowley County Demographic Profile
 Crowley County Demographic Profile Prepared by Southern Colorado Economic Development District 1104 North Main Street Pueblo, CO 81003 719-545-8680 Table of Contents Crowley County... 3 Transportation...
International Trade Economic Forecasts An Overview of Orange County and Southern California Exports
 International Trade Economic Forecasts An Overview of Orange County and Southern California Exports Mira Farka Adrian R. Fleissig Institute for Economic and Environmental Studies Orange County / Inland
Economic Outlook. Peter Rupert Professor and Chair Department of Economics, UCSB Director, UCSB Economic Forecast Project
 Economic Outlook Peter Rupert Professor and Chair Department of Economics, UCSB Director, UCSB Economic Forecast Project League of California Cities Monterey, CA December 3, 2014 Economic Update economic
2009 California & Bay Area Real Estate Market Outlook
 2009 California & Bay Area Real Estate Market Outlook November 24, 2008 Fairmont Hotel Leslie Appleton-Young C.A.R. Vice President and Chief Economist California Real Estate Market: 2008 California s Housing
2009 Master Plan & Reexamination Report Verona, New Jersey
 2009 Master Plan & Reexamination Report Verona, New Jersey MASTER PLAN TOWNSHIP OF VERONA, NEW JERSEY PREPARED FOR THE PLANNING BOARD OF THE TOWNSHIP OF VERONA, NJ PREPARED BY KASLER ASSOCIATES, PA 34
2018 Annual Economic Forecast Dragas Center for Economic Analysis and Policy
 2018 Annual Economic Forecast Dragas Center for Economic Analysis and Policy PRESENTING SPONSOR EVENT PARTNERS 2 The forecasts and commentary do not constitute an official viewpoint of Old Dominion University,
North Carolina Competitiveness
 ted@econleadership.com North Carolina Competitiveness NC 200,000 180,000 160,000 140,000 120,000 100,000 80,000 60,000 40,000 20,000 0 The Punch Job Change 1990 to 2012 182,905 The loss of about 8 of our
Babson Capital/UNC Charlotte Economic Forecast. May 13, 2014
 Babson Capital/UNC Charlotte Economic Forecast May 13, 2014 Outline for Today Myths and Realities of this Recovery Positive Economic Signs Negative Economic Signs Outlook for 2014 The Employment Picture
GRE PROJECTS $78 MILLION IMPACT FROM 2013 PGA CHAMPIONSHIP TOURNAMENT TO BE HELD AT ROCHESTER S OAK HILL COUNTRY CLUB AUG. 5-11, 2013 Overview
 GRE PROJECTS $78 MILLION IMPACT FROM 2013 PGA CHAMPIONSHIP TOURNAMENT TO BE HELD AT ROCHESTER S OAK HILL COUNTRY CLUB AUG. 5-11, 2013 Overview In a recent report measuring golf s total economic impact
Economics of Highway Spending and Traffic Congestion. Todd Litman Victoria Transport Policy Institute Presented Strong Towns Webinar 3 February 2016
 Economics of Highway Spending and Traffic Congestion Todd Litman Victoria Transport Policy Institute Presented Strong Towns Webinar 3 February 2016 Motor Vehicle Travel is Peaking Annual Vehicle Mileage
Current Hawaii Economic Conditions. Eugene Tian
 Current Hawaii Economic Conditions Eugene Tian Department of Business, Economic Development & Tourism At the PATA/TTRA 2016 Annual Outlook & Economic Forecast Forum February 3, 2016 Positive Signs in the
Understanding the. Dr. Christopher Waller. Federal Reserve Bank of St. Louis
 Understanding the Unemployment Picture Dr. Christopher Waller Senior Vice President and Director of fresearch Federal Reserve Bank of St. Louis By David Andolfatto and Marcela Williams A Look at Unemployment
Economic Update and Outlook
 The Building Industry Association Of Okaloosa-Walton Counties Economic Update and Outlook Rick Harper, PhD February 1, 2018 The Economic Outlook 3rd longest postwar expansion for U.S., marked 103 months
Will 2016 Be the Last Hurrah for Commercial Real Estate? Presented By: John Chang First Vice-President Marcus & Millichap Research Services
 Will 2016 Be the Last Hurrah for Commercial Real Estate? Presented By: John Chang First Vice-President Marcus & Millichap Research Services Rising Uncertainty Creating Headwinds for Commercial Real Estate
GRE ESTIMATES $102.1 MILLION IMPACT FROM 2013 PGA CHAMPIONSHIP
 GRE ESTIMATES $102.1 MILLION IMPACT FROM 2013 PGA CHAMPIONSHIP TOURNAMENT HELD AT ROCHESTER S OAK HILL COUNTRY CLUB AUG. 5-11, 2013 Overview New York is the birthplace of The PGA of America and has a rich
COOPERATIVE EXTENSION Bringing the University to You
 COOPERATIVE EXTENSION Bringing the University to You Special Publication - 06-16 ECONOMIC IMPACT OF TOURISM ON COLORADO RIVER COMMUNITIES INCLUDING: LAUGHLIN BULLHEAD CITY FORT MOHAVE MOHAVE VALLEY GOLDEN
U.S. Property Market Outlook, 2013Q1. Jim Costello, Managing Director CBRE Americas Research Investment Research
 U.S. Property Market Outlook, 2013Q1 Jim Costello, Managing Director CBRE Americas Research Investment Research CBRE Page 2 Outlook for the Real Side of the Economy Operationally, what do Research Teams
The Economic Outlook. Economic Policy Division
 The Economic Outlook Economic Policy Division Glass Half Full Six years of steady growth Real GDP Outlook Percent Change, Annual Rate 10 5 0-5 -10 1980 1985 1990 1995 2000 2005 2010 2015 Glass Half Full
Oil Crises and Climate Challenges 30 Years of Energy Use in IEA Countries
 Crises and 30 Years of Energy Use in IEA Countries Fridtjof Unander, International Energy Agency ISED Meeting, UN, 13 September 2004 Aim of the Study Review of trends in energy use and CO 2 emissions since
From Recession to Recovery
 From Recession to Recovery Monday, April 26, 2010 8:00 AM - 9:15 AM Moderator Michael Klowden, President and CEO, Milken Institute Speakers Mohamed El-Erian, CEO and Co-Chief Investment Officer, Pacific
Economic Contribution of Off-Highway Vehicle Recreation in Colorado. Executive Summary Season. A joint cooperation report
 Economic Contribution of Off-Highway Vehicle Recreation in Colorado Executive Summary 2014-2015 Season A joint cooperation report Page intentionally left blank to accommodate double-sided printing December