UKRAINIAN GRAIN. President Nikolay Gorbachov
|
|
|
- Jane Chandler
- 5 years ago
- Views:
Transcription

1 UKRAINIAN GRAIN President Nikolay Gorbachov 1

2 Population 42,5 mln The area is km² The largest area in the country is from those whose territory is completely lying in Europe Ukraine borders with seven countries: on Belarus in the north, Poland, Slovakia and Hungary - in the west, Romania and Moldova - in the southwest, Russia in the east and north-east. In the south and south-east it is washed by the Black and Azov seas. 2

3 Map of Worldwide Croplands As we can see, Ukraine is situated at the most valuable geographical location as for the productive lands and best yields
 (water) 9 351 sq miles (24 220 sq km) (TOTAL) 233 031 sq miles (603 550 sq")
4 Distance between extreme points Coastline: miles (2 782 km) Land Area: (land) sq miles ( sq km) (water) sq miles ( sq km) (TOTAL) sq miles ( sq km) 4


5 Distribution of agricultural land in Ukraine Area thd ha Total 42,7 mln ha Land shares, 28 million hectares Agricultural land in state and communal ownership, 11 million hectares Not agricultural land in state and communal ownership 1,5 million hectares Agricultural land Forests and other forest areas Other SHARE OF TOTAL COUNTRY LAND % Agricultural land Forests and other forest areas Other 11.6% 17.6% For conducting of commodity of agri production (except for shares), 1,5 million hectares 70.8% 5
6 WHEAT Yield

7 WHEAT Yield changes vs , in % season climate tendency 7
8 GRAIN PRODUCTION AND EXPORT ,000 90,000 85,168 82,303 82,535 80,000 74,489 49,108 50,000 71,333 47,727 69,387 46,068 70,000 42,880 63,591 61,401 40,000 38,703 60,000 35,244 51,630 51,984 50,000 47,325 30,000 28,376 41,930 40,964 41,652 25,522 39,591 39,094 40,000 23,103 23,456 export production Linear (export) 20,000 34,237 30,000 10,000 9,521 11,235 24,863 11,640 13,976 11,096 14,936 20,000 3,654 5,404 10, /08/2018 CONFIDENTIEL
9 PRODUCTION AND EXPORT EVOLUTION 120, , , ,000 77,179 69, ,011 60, ,777 43,844 40,000 36,128 31,592 28,411 29,116 23,910 23,628 25,248 22,925 24,080 24,790 21,268 19,455 20,000 16,995 10, seeded thd.ha Crop Domestic consumption Export yield Linear (Export) Marketing year Yield, t/h Changers, in % , , , , ,99 19 Sown aria, M hec , , , , ,248 7 Domestic consumption , , , , ,193 8
10 GRAIN PRODUCTION AND EXPORT thd. mt 17/18 vs 18/19 90,000 80,000 84,313 +4% 80,046 +5% 70,000 60,000 60,599 58,061 +2,5% +2,2% 50,000 40,000 41,250 40,250 46,920 45,920 30,000 20,000 10, Crop (without oilseeds) Export (without oilseeds) Crop ALL GRAINS Export ALL GRAINS / / /2019
11 WHEAT thd. mt 17/18 vs 18/19 30,000 25,000 24,472 26,459 20,000 15,000 16,500 17,000 10,000 5,000 0 Export 2018/ /2018 Crop 11
12 BARLEY thd. mt 17/18 vs 18/19 10,000 9,000 8,602 8,000 7,000 7,161 6,000 5,000 4,000 3,900 4,600 3,000 2,000 1,000 0 Export 2018/ /2018 Crop 12
13 CORN thd. mt 17/18 vs 18/19 35,000 30,000 28,966 25,000 23,000 20,000 19,000 18,500 15,000 10,000 5,000 0 Export 2018/ /2018 Crop 13


14 GRAIN TRANSPORTATION TO THE PORTS - 67% wagons - 5% barges - 28% trucks 14 02/08/2018 CONFIDENTIEL


15 GRAIN SUPPLY CHAIN CAPACITY * prior to limitations Production ~ 85 mmt Transport ~ 45 mmt Export ~ 45 mmt 12,6 mmt ~28%* Inland storage capacity ~800 silos = 40 mmt 5,5 USD per t/100 km Port storage capacity ~ 3,5 mmt Transshipment capacity ~ 60 mmt 30 mmt ~ 67% rw cars 3,3 USD per t/100 km 2,2mmt ~ 5% USD per t 15 1,8 USD per t/100 km

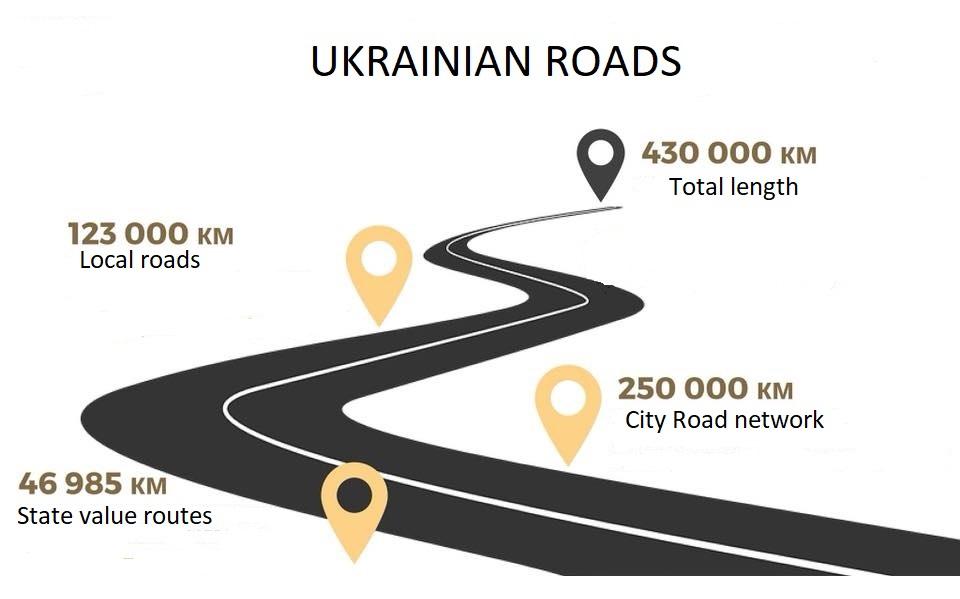
16 50 thd km
17

18 Waterways The total length of the navigable rivers of Ukraine, used as waterways, is km 18

19 TOP PORTS FOR GRAIN EXPORT in 2017/18 NAME OF THE PORT VOLUME, TONS FROM TOTAL, % Nikolaev ,9 Yuzhniy ,1 Chornomorsk ,4 Odessa ,3 Ochakov ,5 Kherson ,9 Berdyansk ,1 Mariupol ,5 Reni ,990 Izmail ,3 Kiliya ,02 Dnipro ,05 Bilhorod ,005 TOTAL
20 EXPORT INFRASTRUCTURE BY PORTS 2017/18 Port Terminal Storage capacity Storage capacity Export 2017/2018 NIKOLAEV ODESSA YUZHNY Nibulon State Food Bunge Nika Tera COFCO Bangladesh Olvia MTP Other ADM Bruklin Kiev CHS/Olympex State Food Novotech - Porto-san Others TIS Borivazh MV Cargo Glencore/IZT Turnover, times per season , , ,1* MTP CHERNOMORSK CHERNOMORSK Risoil ,6 Trans-Service TBT/ Kernel sea trade port KHERSON port-elevator Dnipro Cargo ltd ,3 Other other BERDYANSK New Khortysya ,4 sea trade port OCHAKOV U-port ,2 MARIUPOL Ukrtransagro ,7 OTHER Other TOTAL
21 TOP EXPORTERS 21 COMPAY EXPORT VOLUME, tons MARKET SHARE, % Louis Dreyfus ,6 Nibulon ,4 Kernel Trade ,8 COFCO ,0 Bunge ,6 ADM ,5 Cargill ,7 Glencore ,0 Black Sea Commodities ,5 DPZKU ,3 Total COMPAY EXPORT VOLUME, tons MARKET SHARE, % LDC NIBULON INERCO ADM ,3 BUNGE ,9 CARGILL ,5 COFCO STATE (SFGCU) ,9 GLENCORE ,8 ENGELHART ,4 OTHERS ,9 TOTAL COMPAY EXPORT VOLUME, tons MARKET SHARE, % NIBULON ,5 LDC ,3 INERCO ,6 BUNGE ,3 ADM ,2 GLENCORE ,6 STATE ,1 (SFGCU) CARGILL ,3 NOBLE ,8 CHS ,8 OTHERS ,8 TOTAL

22 TOP WORLD EXPORTERS 2017/18 22
23 FORECAST EXPORT PER MONTH, m. tons 6,000 5,000 4,000 4,388 4,177 4,085 4,855 4,785 3,940 5,189 5,522 4,310 4,261 4, ,262 4, ,012 3, ,000 2,000 1,949 1,786 2,550 2,000 1,000 0 july august september october november december january february march april may june

24 Top destinations 2017/18 Destinations Total Market share, % Egypt ,0 China ,7 Spain ,3 Netherlands ,6 Italy ,0 Turkey ,9 Indonesia ,6 Saudi Arabia ,8 Israel ,4 Bangladesh ,2 Tunisia ,9 Philippines ,7 India ,6 Total
25 TOP Destinations, Wheat, 2017/ Wheat, mln t Wheat, mln t 25 total 16,2 mln t
26 TOP Destinations, Barley, 2017/ Saudi Arabia (SA) China (CN) Libya (LY) Turkey (TR) Barley, mln t Spain (ES) Israel (IL) Barley, mln t Iran (IR) Tunisia Algeria Jordan (TN) (DZ) (JO) 26 Total 4,2 mln t
27 TOP Destinations, Corn, 2017/18 3 Corn, mln t Corn, mln t 27 Total 15,1 mln t
28 TOP Destinations, Rapeseed 2017/ Rapeseed, mln t Rapeseed, mln t 28 Total 2,1 mln t


29 BOTTLENECKS WAGONS, DIS.CAPACITY, STATIONS Loading capacity mt/day Rw capacity mt/day Port stations capacity ~ mt/day* Transshipment capacity mt/day Discharge capacity ~ mt/day** *All types of cargo **Grain wagons 29 02/08/2018 CONFIDENTIEL
30 Number of wagons (incl. State and private) Січень Лютий Березень Квітень Травень Червень Липень Серпень Вересень Жовтень Листопад Грудень /08/2018 CONFIDENTIEL
31 Marketing year Average loaded number of wagons per month Average transported by RW per month, ml tons Average export per month, ml tons * * ,000,000 76,923 6,000,000 5,000,000 51,925 49,814 5,000,000 4,000,000 39,089 41,819 3,237,921 3,000,000 3,375,103 2,540,769 2,718,262 2,000,000 1,000, средний перевезенный тоннаж в месяц, тонн средний експорт в месяц, млн тонн среднее кол-во вагонов в месяц погружено, шт 90,000 80,000 70,000 60,000 50,000 40,000 30,000 20,000 10,000 0 TRANSPORTATION AND EXPORT GRAIN EVOLUTION 31 02/08/2018 CONFIDENTIEL

32 WORLD IMPORT DYNAMICS FORECAST, thd tons OECD-FAO Agricultural Outlook, PRODUCT IMPORT DYNAMICS, 2016 / Wheat % thd tons Corn % Others % Rice % Year Wheat Corn Others Rice 32
33 Thanks for your attention UKRAINIAN GRAIN ASSOCIATION
GIAV & SFMCA VIC MEETING BLACK SEA PRESENTATION BY ADM
 1 GIAV & SFMCA VIC MEETING BLACK SEA PRESENTATION BY ADM Black Sea Ports 2 Black Sea vs Australia Snapshot 3 Population (million people) Total Land mil HA Arable Land mil HA Arable Land used for Cropping
BUYERS VS SUPPLIERS: CHANGING PREFERENCES OF ONE OF THE MAIN GRAIN IMPORTERS
 BUYERS VS SUPPLIERS: CHANGING PREFERENCES OF ONE OF THE MAIN GRAIN IMPORTERS MACROECONOMICS GLOBAL GROWTH: DEVELOPED AND EMERGING MARKETS MARCH 2008 MARCH 2017 5,5 % 2 % Emerging Markets Real GDP YoY %
I. World trade in Overview
 I. Table I.1 Growth in the volume of world merchandise exports and production by major product group, 1995-3 ( change) 1995-21 22 23 World merchandise exports 7. -.5 3. 4.5 Agricultural products 3.5 2.5
World Vegetable Oil Themes in 2018/19
 World Vegetable Oil Themes in 2018/19 Ben Buckner AgResource Company World Veg Oil Themes in 2018 POLITICS Disorder, Trade Barriers (India More than China?) HUGE difference between world soybean supply
Weather, Supply and the Turkish Flour Miller - The Outlook for World Wheat Prices 2018/19
 Weather, Supply and the Turkish Flour Miller - The Outlook for World Wheat Prices 2018/19 v Daniel W Basse President AgResource Chicago, IL January 2016 Daniel W Basse Daniel Basse Daniel President W Basse
Potash Outlook. Kevin Stone Natural Resources Canada. TFI Fertilizer Outlook and Technology Conference Fort Lauderdale, Florida November 16, 2016
 1 Potash Outlook Kevin Stone Natural Resources Canada TFI Fertilizer Outlook and Technology Conference Fort Lauderdale, Florida November 16, 2016 2 Outline Historical Consumption and Supply Outlook for
Introductions, Middle East, Israel, Jordan, Yemen, Oman Week 1: Aug Sept. 1
 Introductions, Middle East, Israel, Jordan, Yemen, Oman Week 1: Aug. 28 - Sept. 1 ASSIGNMENT Monday Tuesday Wednesday Thursday Friday Due Wednesday pgs. 6-11 Do not start the workbook or study sheet assignments
Corn Outlook. December, 2017
 Corn Outlook December, 2017 Corn Outlook December, 2017 Historical Price Reference Fundamental Backdrop Seasonal Tendency Summary Commodity & Ingredient Hedging 2 Historical Price Reference Where are Corn
European Values Study & World Values Study - Participating Countries ( )
") GESIS Data Archive for the Social Sciences http://www.gesis.org/en/home/ ASEP/JD Data Archive http://www.jdsurvey.net/jds/jdsurvey.jsp European Values Study & World Values Study - Participating Countries
GESIS Data Archive for the Social Sciences http://www.gesis.org/en/home/ ASEP/JD Data Archive http://www.jdsurvey.net/jds/jdsurvey.jsp European Values Study & World Values Study - Participating Countries
Corn Outlook. February, 2018
 Corn Outlook February, 2018 Corn Outlook February 2018 Historical Price Reference Fundamental Backdrop Seasonal Tendency Summary 2 Historical Price Reference Where are Corn Prices Currently, And Where
Production, trade and supply of natural gas Terajoules
 Terajoules Table Notes Production includes quantities from other sources, which would include any quantities of biogas, LPG or manufactured gas blended with natural gas. Please refer to the Definitions
Export market challenges and opportunities for southern grain producers. Ross Kingwell
 Export market challenges and opportunities for southern grain producers Ross Kingwell Take Home Messages In wheat, face up to even more export competition. Find sources of additional value within or outside
Freshwater fish. Carp, Perch, Pike, Burbot, Barb, Milkfish. Extract from GLOBEFISH Databank Prices - Exports - Imports - Production
 Commodity Update Freshwater fish Carp, Perch, Pike, Burbot, Barb, Milkfish Extract from GLOBEFISH Databank Prices - Exports - Imports - Production November 2012 Freshwater fish - Carp, Perch, Pike, Burbot,
INTERNATIONAL STUDENT STATISTICAL SUMMARY Spring 2017 (Final)
") INTERNATIONAL STUDENT STATISTICAL SUMMARY Spring 2017 (Final) Prepared By: Mr. Jay Ward, Associate Director Office of International Programs San Francisco State University Non-Matriculated SP 17 SP 16
INTERNATIONAL STUDENT STATISTICAL SUMMARY Spring 2017 (Final) Prepared By: Mr. Jay Ward, Associate Director Office of International Programs San Francisco State University Non-Matriculated SP 17 SP 16
Ministry of Economy and Sustainable Development of Georgia
 Ministry of Economy and Sustainable Development of Georgia Economic Growth 42,000.0 36,000.0 30,000.0 24,000.0 18,000.0 12,000.0 6,000.0 0.0 GDP AND ECONOMIC GROWTH 7.2% 6.2% 6.4% 4.6% 4.8% 3.4% 2.9% 2.8%
2017/18 Soybean Outlook
 217/18 Soybean Outlook 217 Ag Econ In service Training Dr. S. Aaron Smith, Assistant Professor, Department of Agricultural and Resource Economics, University of Tennessee https://ag.tennessee.edu/arec/pages/cropeconomics.aspx
STORM FORECASTS: The only independent source of animal health and animal agriculture historical market data and forecasts
 The only independent source of animal health and animal agriculture historical market data and forecasts June 2016 1 What is STORM FORECASTS? STORM FORECASTS is the only independent source of animal health
DG AGRI DASHBOARD: CITRUS FRUIT Last update:
 8.000 7.000 6.000 5.000 4.000 3.000 2.000 1.000 0 1996 1997 1998 1999 2000 2001 2002 2003 2004 2005 2006 2007 2008 2009 2010 2011 2012 2013 2014 2015 2016 2017 Small citrus (group mandarines): clementines,
Global Construction Outlook: Laura Hanlon Product Manager, Global Construction Outlook May 21, 2009
 Global Construction Outlook: Short-term term Pain, Long-term Gain Laura Hanlon Product Manager, Global Construction Outlook May 21, 2009 What This Means for You The world is set to be hit this year with
USDA Grains & Oilseeds Outlook
 USDA Grains & Oilseeds Outlook 3 rd Ukrainian Grain Congress 2012 Edward W. Allen U.S. Department of Agriculture Economic Research Service 202-694-5288 ewallen@ers.usda.gov U.S. Producer Prices Are High
IBSA Goalball World Rankings 31 December 2017 Men's Division
 IBSA Goalball World Rankings 31 December 2017 Men's Division Rank No v Oc t Se p Au g Ju l Team Region Score Goal Diff Results Gol p Gme Last Plyd Weight 1st 5 6 6 1 2 Brazil Americas 661.802 4.564 0.872
Student Nationality Mix for BAT Bath
 Student Nationality Mix for BAT Bath Country Total Saudi Arabia 16. Oman 11.8% Spain 10. China 10. Libya 7. Thailand 6. Korea (South) 6. France 3.9% Venezuela 3. Italy 2.9% Brazil 2. Turkey 2. Switzerland
Market Opportunities for Irish Dairy 2025
 Market Opportunities for Irish Dairy 2025 National Dairy Conference 2014 Red Cow Moran Hotel, Dublin Aidan Cotter Chief Executive Wednesday, 19 th November, 2014 AIDAN COTTER BORD BIA CHIEF EXECUTIVE 28
Big data analytics for enrichment of rural area content tourism in Okhotsk sub-prefecture of Japan
 Big data analytics for enrichment of rural area content tourism in Okhotsk sub-prefecture of Japan Ali Bakdur, Fumito Masui, Michal Ptaszynski Kitami Institute of Technology, Dept. of Computer Science,
Key Figures and Trends for the Agricultural Machinery Industry
 Key Figures and Trends for the Agricultural Machinery Industry Update: November 2015 (monthly) Contact: Philip Nonnenmacher VDMA Agricultural Machinery Association philip.nonnenmacher@vdma.org Subject
Desalination From theory to practice People, Papers, Publications. Miriam Balaban EDS Secretary General
 Desalination From theory to practice People, Papers, Publications Gulf WSTA Europe EDS Miriam Balaban EDS Secretary General Europe and the Gulf Region The collaboration between our regions has had significant
1.2. Barite Market Overview
 1.2. Barite Market Overview In 2010 primary barite production estimated 000 thousand metric tons, a 12,5% increase from that of. Table 1. World mine production of barite, 2004-2010 (thousand metric tons)
Turkish Grain Update 2017/18
 Turkish Grain Update 2017/18 19 April 2018 Faik Genç AgriPro Limited Main Topics 1. Turkey 2. Grains Supply & Demand 3. Turkish Wheat Product Exports 4. Russia-Turkey Trade War 5. Conclusions Turkey Turkey
Agriculture Outlook. Rich Pottorff Doane Advisory Services
 Agriculture Outlook Rich Pottorff Doane Advisory Services General Outline An overview of U.S. crop markets Corn, soybeans, wheat & cotton Some factors shaping the outlook World Ag Situation Conclusions
Climate Change & India
 Climate Change & India New Delhi How has India warmed over the past 117 years? How the temperatures have increased seasonally? How far away we are from 1.5 degree C target? Methodology 117 years (1901-1916)
Three-speed economic recovery
 Three-speed economic recovery Projection after 2012 GDP growth, percent 10 8 6 4 2 0-2 Euro area -4-6 1992 1996 2000 2004 2008 2012 2016 Source: IMF WEO, April 2013. Emerging market and developing economies
GRUPO CORTEFIEL is one of Europe s top fashion
 GRUPO CORTEFIEL is one of Europe s top fashion names operating in the specialised chain sector. Founded in Madrid in 1880, today it is present in 89* countries and has 1,982* points of sale. Cortefiel,
Small Arms Survey 2015 Annexe 4.4 Authorized transfers of small arms and light weapons to Egypt, Libya, and Syria,
 Small Arms Survey 2015 Annexe 4.4 Authorized transfers of small arms and light weapons to Egypt, Libya, and Syria, 2001 13 Contents 2 Table 4.6a Reported deliveries of small arms to Egypt, 2001 13 6 Table
Update of trade weights data underlying the EERs and HCIs
 August 2017 Update of trade weights data underlying the EERs and HCIs The trade weights underlying the calculation of the effective exchange rates (EERs) of the euro and the harmonised competitiveness
1. HighQuest Partners + Soyatech
 Key Fundamentals Driving Investor Interest in Global Agriculture Philippe de Lapérouse Managing Director HighQuest Partners LLC Les Perspectives 2014 Le 8 avril 2014 Boucherville, Québec 1. HighQuest Partners
Trade Growth - Fundamental Driver of Port Operations and Development Strategies
 Trade Growth - Fundamental Driver of Port Operations and Development Strategies Marine Terminal Management Training Program October 15, 2007 Long Beach, CA Paul Bingham Global Insight, Inc. 1 Agenda Economic
Mobarakeh Steel Company (MSC) Can Iranian slabs & HRC support SE Asian steel industries?
 Can Iranian slabs & HRC support SE Asian steel industries?") (MSC) Can Iranian slabs & HRC support SE Asian steel industries? JAKARTA June 2018 Iranian slab, an opportunity for SE Asia flat producers Overview of global slab trade Slab trade in SE Asia (MSC) An overview
(MSC) Can Iranian slabs & HRC support SE Asian steel industries? JAKARTA June 2018 Iranian slab, an opportunity for SE Asia flat producers Overview of global slab trade Slab trade in SE Asia (MSC) An overview
Agricultural Outlook: Rebalancing U.S. Agriculture
 Agricultural Outlook: Rebalancing U.S. Agriculture Michael J. Swanson Ph.D. Agricultural Economist January 2018 2018 Wells Fargo Bank, N.A. All rights reserved. For public use. The U.S. Ag Sector renormalizes!
Portuguese, English, and. Bulgarian, English, French, or
 Country Language Fiber Content Algeria Arabic Angola Portuguese, English, and French (optional) Optional Argentina Spanish Armenia Armenian Optional Australia English Austria German Bahrain Arabic or English
Soybean, Corn, & Wheat Outlook Middle Tennessee Grain Conference
 Soybean, Corn, & Wheat Outlook Middle Tennessee Grain Conference S. Aaron Smith, Crop Marketing Specialist, Assistant Professor, Department of Agricultural and Resource Economics, University of Tennessee
Soybean, Corn, & Wheat Outlook Middle Tennessee Grain Conference
 Soybean, Corn, & Wheat Outlook Middle Tennessee Grain Conference S. Aaron Smith, Crop Marketing Specialist, Assistant Professor, Department of Agricultural and Resource Economics, University of Tennessee
Summary Charts Scenario 3 - Low Change Scenario
 7/26/2016 U:\POUPU000.2015g_TD model 9\20160723TDM9\TDM_9p_Model_3_Sum_.Scen03_E70_20160726.xlsx Page 1 Summary Charts Scenario 3 - Low Change Scenario Equivalent domestic postage 70% priority domestic
Debriefing from Stone Fruit GREX (6/06/2012)
") Debriefing from Stone Fruit GREX (6/06/2012) Catalina STANCU European Commission DG Agriculture and Rural Development (DG AGRI) Unit C.2. Olive oil, horticultural products Management Committee Brussels,
Debriefing from Stone Fruit GREX (6/06/2012) Catalina STANCU European Commission DG Agriculture and Rural Development (DG AGRI) Unit C.2. Olive oil, horticultural products Management Committee Brussels,
BLUE GROWTH AQUACULTURE IN TURKEY: THE BEST MODEL FOR THE BLACKSEA REGION
 BLUE GROWTH AQUACULTURE IN TURKEY: THE BEST MODEL FOR THE BLACKSEA REGION Hayri DENİZ (Ph.D.) hayrideniz@hotmail.com Muğla Fish Farmers Association & KILIÇ Seafood Company International Conference on Fisheries
2017/18 Corn Outlook
 217/18 Corn Outlook 217 Ag Econ In service Training Dr. S. Aaron Smith, Assistant Professor, Department of Agricultural and Resource Economics, University of Tennessee https://ag.tennessee.edu/arec/pages/cropeconomics.aspx
USTA Player Development 2017 Excellence Grant Criteria Jr Girls, Collegiate & Professional Players
 USTA Player Development 2017 Excellence Grant Criteria Jr Girls, Collegiate & Professional Players In order to encourage the development of U.S. players we have designed USTA Player Development Excellence
AREA TOTALS OECD Composite Leading Indicators. OECD Total. OECD + Major 6 Non Member Countries. Major Five Asia. Major Seven.
 Reference series Composite leading indicators OECD Composite Leading Indicators AREA TOTALS 7-03- 19 OECD Total 19 OECD + Major 6 Non Member Countries 19 Major Seven 19 Major Five Asia 19 Euro area 19
Agricultural Trade Office The U.S. Embassy, Seoul
 Agricultural Trade Office The U.S. Embassy, Seoul www.atoseoul.com Data Source: Global Trade Atlas (www.gtis.com), CIF Value Basis, This presentation tracks Korea s imports of agricultural products on
2016 Grains & Oilseeds Outlook. The global outlook remains positive. 12/7/2015. Matthew C. Roberts
 12/7/215 216 Grains & Oilseeds Outlook Matthew C. Roberts Roberts.628@osu.edu The global outlook remains positive. www.matthewcroberts.com 2 www.matthewcroberts.com 3 www.matthewcroberts.com 4 www.matthewcroberts.com
UKRMETALURGPROM CHALLENGES & OPPORTUNITIES
 CHALLENGES & OPPORTUNITIES Association Chronology The Ukrainian Association of Ferrous Metallurgy Enterprises was founded by decision of 28 National Metallurgical entities The Association of Enterprises
KINGDOM OF CAMBODIA NATION RELIGION KING 3
 KINGDOM OF CAMBODIA NATION RELIGION KING 3 TOURISM STATISTICS REPORT February 2018 MINISTRY OF TOURISM Statistics and Tourism Information Department No. A3, Street 169, Sangkat Veal Vong, Khan 7 Makara,
Presentation from the USDA Agricultural Outlook Forum 2017
 Presentation from the USDA Agricultural Outlook Forum 2017 United States Department of Agriculture 93 rd Annual Agricultural Outlook Forum A New Horizon: The Future of Agriculture February 23-24, 2017
FAPRI 2006 Preliminary Baseline December 15-16, 2005
 FAPRI 26 Preliminary Baseline December 15-16, 25 INTERNATIONAL SUGAR Amani Elobeid (515)-294-6175 amani@iastate.edu FAPRI Food and Agricultural Policy Research Institute Center for Agricultural and Rural
Trade Winds in Agriculture
 Trade Winds in Agriculture November 2, 2018 Dr. Scott Brown MU-CAFNR: Director of Strategic Partnerships brownsc@missouri.edu http://amap.missouri.edu Overview Trade uncertainty has increased as past trade
THE WORLD COMPETITIVENESS SCOREBOARD 2011
 THE WORLD COMPETITIVENESS SCOREBOARD 2011 98.557 94.063 92.588 92.011 90.782 90.219 89.259 87.824 86.475 86.418 86.313 85.707 84.380 84.120 81.629 81.619 81.100 80.278 79.799 78.499 77.599 77.101 76.827
STATISTICS
 DGAGRI-G2 23 Novembre 2017 W O R K I N G D O C U M E N T Horticultural Products FLOWERS AND ORNAMENTAL PLANTS STATISTICS 2006-2016 This statistical document has been prepared by Unit G.2 of DG AGRI, in
Stockholm s tourism industry. November 2016
 Stockholm s tourism dustry. November 2016 Durg the month of November ca 1.1 million guest were recorded at commercial accommodations the county of Stockholm. This was an crease of 5 compared to November
CBH AUSTRALIAN CROP UPDATE
 CBH AUSTRALIAN CROP UPDATE MARCH 2017 Wallace Chang Regional Manager North Asia CBH Group - Vertically Integrated Supply Chain Our Customers Flour millers, maltsters, feed manufacturers, food processors
IR-Pay Go Rates. There are three pricing groups for Pay Go rates for International Roaming as follows:
 IR-Pay Go Rates A. IR Pay Go Rate Summary There are three pricing groups for Pay Go rates for International Roaming as follows: Sr IR Pay Go Rate Group 1 Rs 2 2 2 2 Rs 10 10 10 3 Rs 50 600 25 Applicable
Stockholm s tourism industry. December 2016
 Stockholm s tourism dustry. December 2016 Durg the month of December ca 0.9 million guest were recorded at commercial accommodations the county of Stockholm. This was an crease of 12 compared to December
COMCEC TRANSPORT OUTLOOK 2014
 COMCEC TRANSPORT OUTLOOK 2014 Dr. İsmail Çağrı Özcan COMCEC Coordination Office Transport Working Group Meeting March 13th, 2014 Ankara, Turkey OUTLINE 1. IMPORTANCE OF TRANSPORT INDUSTRY WITHIN COMCEC
The New Drivers for Black Sea and World Grain Copyright AgResource Company. All Rights Reserved.
 The New Driers for Black Sea and World Grain - 2014 Copyright 2014 2013 AgResource Company. All Rights Resered. Ag Market Driers for 2014? World Food inflation to rise 3.2% in 2013 (s 2.7% in 2012) drien
41th meeting of the Advisory Committee
 41th meeting of the Advisory Committee Marseille, France 8 July 213 OLIVE OIL BALANCES 211/12-212/13 OLIVE OIL 211/12 (final) (thousand tonnes) 212/13 (prov.) Starting stocks 773. 1.5 Production 3377.5
Full-Time Visa Enrolment by Countries
 Page 1 of 32 All Students Afghanistan Albania Algeria Andorra Antigua Argentina Armenia Australia Austria Azerbaidjan Bahamas Bahrain Bangladesh Barbados Belarus Belgium Belize Benin (Dahomey) Bermuda
Global Outlook for Agriculture Trend versus Cycle
 Global Outlook for Agriculture Trend versus Cycle Michael Swanson Ph.D. Wells Fargo October 2017 Everything is connected we just don t see how. Connection corollary: Nothing natural moves in a straight
Developments in air cargo: some data on the transport of pharmaceuticals
 Developments in air cargo: some data on the transport of pharmaceuticals CCA Pharmaceuticals in the Cool Chain Milan September 17th, 2014 Gerard de Wit Managing Director WorldACD Market Data The Netherlands
International Economic Outlook: Shifting International Trade Routes
 International Economic Outlook: Shifting International Trade Routes Larry Boorstein, Project Manager, AECOM Prepared for Shifting International Trade Routes, January 29-30, 2015, Tampa, presented by AAPA
Firearms & parts firearms & parts firearms & parts rocket launcher components
 Table 3 Exports of Military Goods by Component Categories Export Period 01 January to 31 December 1997 Destination ECL Andorra 2001 5 434 2 058 Firearms & parts Argentina 2001 54 498 468 firearms & parts
DG AGRI DASHBOARD: CITRUS FRUIT Last update:
 14 000 12 000 10 000 8 000 6 000 4 000 2 000 0 1996 1997 1998 1999 2000 2001 2002 2003 2004 2005 2006 2007 2008 2009 2010 2011 2012 2013 2014 2015 2016 Small citrus (group mandarines): clementines, satsumas
CMMI Maturity Profile Report. 30 June 2017
 CMMI Maturity Profile Report 30 June 2017 Executive Summary Appraisals increased 14% 1 Jan 30 Jun 17 Companies who reappraise continue to increase, currently at 74% 10% of reported appraisals are high
New rules, new opportunities: a potential for growth
 #TV year New rules, new opportunities: a potential for growth June 19th, 2015 Jacques Balducci Eurodata TV Worldwide Deputy Sales Director Worldwide TV viewing remains strong World daily viewing time Average
FAPRI agricultural commodity outlook
 FAPRI agricultural commodity outlook By William H. Meyers Howard Cowden Professor of Agricultural and Applied Economics FAPRI at MU UN DESA Expert Group Meeting on the World Economy 21 October 2013 New
Economic potential of Agriculture and Pig production in Baltic region. Mindaugas Jurgelis, analyst 30 May, 2012
 Economic potential of Agriculture and Pig production in Baltic region Mindaugas Jurgelis, analyst 30 May, 2012 1 Global tendencies of food production 2 Food prices near historical peak level FAO food price
Agricultural Trade Office The U.S. Embassy, Seoul
 Agricultural Trade Office The U.S. Embassy, Seoul www.atoseoul.com Data Source: Global Trade Atlas (www.gtis.com), CIF Value Basis, This presentation tracks Korea s imports of agricultural products on
Fact sheet on elections and membership
 Commission on Narcotic Drugs Commission on Crime Prevention and Criminal Justice Fact sheet on elections and membership States members of the CCPCJ and CND (and other functional commissions of the Economic
2018 Soybean, Corn, & Wheat Outlook KY and TN Grain Conference
 2018 Soybean, Corn, & Wheat Outlook KY and TN Grain Conference S. Aaron Smith, Crop Marketing Specialist, Assistant Professor, Department of Agricultural and Resource Economics, University of Tennessee
October 23, 2015 FINAL STATISTICAL REPORT 2014/15
 C A L I F O R N I A D R I E D P L U M B O A R D 3840 Rosin Court Phone (916) 565-6232 Suite 170 Fax (916) 565-6237 Sacramento, CA 95834 www.californiadriedplums.org October 23, 2015 FINAL STATISTICAL REPORT
Introduction CLINICAL RESEARCH. M.J. Pekka Raatikainen 1 *, David O. Arnar 2, Bela Merkely 3, A. John Camm 4,5, and Gerhard Hindricks 6.
 Europace (216) 18, iii1 iii79 doi:1.193/europace/euw244 CLINICAL RESEARCH Access to and clinical use of cardiac implantable electronic devices and interventional electrophysiological procedures in the
Office of Institutional Research
 ri a l C ty Consistency Sim p li c it y Office of Institutional Research Place of Residence for International Students by Gender: Published October 2012 OIR Staff: Peggy Johnson - Associate Director Miriam
2018 Cotton Market Outlook: At What Price Should I Get Back Into Cotton?
 2018 Cotton Market Outlook: At What Price Should I Get Back Into Cotton? S. Aaron Smith, Crop Marketing Specialist, Assistant Professor, Department of Agricultural and Resource Economics, University of
The Future of World Car Fleet: The Road Ahead
 The Future of World Car Fleet: The Road Ahead (A BBVA Research model for long-term automobile projections) November, 212 Cross-Country Emerging Markets Unit Key Messages Motivation: Analysis of long run
Cotton Market Outlook. Anthony Tancredi CEO Allenberg Cotton Co. / Senior Global Platform Head Louis Dreyfus Commodities
 Cotton Market Outlook Anthony Tancredi CEO Allenberg Cotton Co. / Senior Global Platform Head Louis Dreyfus Commodities ONE THING IS CERTAIN: There is too much cotton! NEARBY ICE FUTURES 100 95 90 85 80
Business opportunities in Turkish Maritime Industry Marco Rensma Director MEYS Emerging Markets Research Istanbul, 24 May 2012
 Business opportunities in Turkish Maritime Industry Marco Rensma Director MEYS Emerging Markets Research Istanbul, 24 May 2012 Content presentation 1. Introduction MEYS Emerging Markets Research 2. Global
WHO WON THE SYDNEY 2000 OLYMPIC GAMES?
 Parabola Volume 36, Issue 3 (2000) WHO WON THE SYDNEY 2000 OLYMPIC GAMES? Jaclyn Brown and Bruce Henry 1 One of the focal points of the recent Sydney 2000 Olympic Games was the medal tally. We all want
IBAN Mandatory Countries for International Payments
 IBAN Mandatory Countries for International Payments SWIFT Standards (IBAN Mandatory) ISO CTRY CODE SEPA Format of Receiver Bank Account Number Albania AL No IBAN-28 Andorra AD No IBAN-24 Austria AT Yes
Total points. Nation Men kayak Women kayak Men canoe Women canoe Total 600 BELARUS KAZAKHSTAN 54. Page 1 of 4. powered by memórias
 Total points Nation Men kayak Women kayak Men canoe Women canoe Total HUN HUNGARY 80 4 37 6 803 RUS RUSSIA 5 7 03 8 77 3 GER GERMANY 5 9 8 09 644 4 ESP SPAIN 06 76 0 98 600 5 BLR BELARUS 5 30 6 70 587
Table I. NET CALORIFIC VALUES OF ENERGY PRODUCTS GJ/ton
 Table I PRODUCTION, EXPORTS AND CHANGES IN STOCKS HARD COAL 2011 2012 2013 2014 Standard factor 25.8 25.8 25.8 25.8 Argentina 24.7 24.7 24.7 24.7 Australia 27.1 27.0 26.9 26.9 Bangladesh 20.9 20.9 20.9
Composition of the UNICEF Executive Board
 The dates reflect years of membership in the Executive Board and not necessarily terms of office. 1 Afghanistan 1960 1963; 1965 1967; 1977 1980 Albania 2012 2014 Algeria 1971 1974; 1982 1985; 2004 2006
España, Portugal + Important roads of Europe 2012 FX
 1 Road coverage CD-ROM 1 CD-ROM 2 ~100 % detailed street Important road of Europe 2 Sales arguments CD-ROM 1 provides updated navigation data with a superior coverage of ~100 % of all roads in Spain incl.
Summary Charts Scenario 1 - Base Scenario
 7/26/2016 U:\POUPU000.2015g_TD model 9\20160723TDM9\TDM_9p_Model_3_Sum_.Scen01_E70_20160726.xlsx Page 1 Summary Charts Scenario 1 - Base Scenario Equivalent domestic postage 70% priority domestic postage
January Deadline Analysis: Domicile
 January Deadline Analysis: Domicile Applicants by domicile at the 15 January deadline D.1.1 Applicants by domicile group UK EU (excluding UK) Not EU All domiciles 20% 10% -0% -10% -20% -30% -40% -50% 2009
What s the Opportunity in Russia and Eastern Europe for Chile? 25 th October 2011
 What s the Opportunity in Russia and Eastern Europe for Chile? 25 th October 2011 1 Contents Who Is Talking Global Grape Imports Russian and East European Imports The Top 3 Markets Some Conclusions 2 Who
Iran and the future of European Gas Supply the European Perspective
 PD Dr. Lutz Mez Berlin Centre for Caspian Region Studies Freie Universität Berlin lmez@zedat.fu-berlin.de www.fu-berlin.de/bccare Iran and the future of European Gas Supply the European Perspective BC
Arms industry statistics
 BRIEFING PAPER Number CBP 7842, 21 December 2016 Arms industry statistics By Rachel Kift and Rob Page Contents: 1. Global defence export market 2. UK defence export market www.parliament.uk/commons-library
The globalisation of sporting events: Myth or reality?
 Khalifa Stadium, Qatar. Photo: Igor Magic The globalisation of sporting events: Myth or reality? Søren Bang, Play the Game 203, 30 October 203 The globalisation of sporting events: Myth or reality? Photo:
US TRADE POLICY Retrenchment or Resurgence?
 US TRADE POLICY Retrenchment or Resurgence? Joe Glauber International Food Policy Research Institute Farmers Cooperative Conference Minneapolis, MN 3 November 2016 Support for trade liberalization falters
Whither Multilateralism? Joseph W. Glauber International Food Policy Research Institute Kraft Lecture University of Manitoba 21 October 2016
 Whither Multilateralism? Joseph W. Glauber International Food Policy Research Institute Kraft Lecture University of Manitoba 21 October 2016 Or wither multilateralism Making America Great Again? 1850
Opening address for dinner-debate
 Opening address for dinner-debate Mohammed Barkindo Acting for the OPEC Secretary General European Parliament Strasbourg, France 4 July 2006 1 Outline Importance of EU-OPEC Energy Dialogue Current oil
PRESENTED BY HOP GROWERS OF AMERICA
 2007 STATISTICAL REPORT FINAL REPORT RELEASED JUNE 2008 PRESENTED BY HOP GROWERS OF AMERICA TABLE OF CONTENTS Page U.S. HOP ACREAGE BY STATE AND VARIETY 2003-2007 4 U.S. HOP YIELDS BY STATE AND VARIETY
Table 34 Production of heat by type Terajoules
 Table 34 Production of heat by type Table Notes geo represents heat used directly for district heating, agriculture etc. without a commercial transaction taking place. represents heat used for the production