OPTIMA PLAZA NORTH HALLANDALE BEACH, FL
|
|
|
- Joel Mills
- 5 years ago
- Views:
Transcription
1 TRAFFIC IMPACT ANALYSIS OPTIMA PLAZA NORTH HALLANDALE BEACH, FL PREPARED FOR: CONSTRUCTIVA ENTERPRISES, LLC Project #14193 November 215 Revised January 6, 216 CA 696 Kimley-Horn and Associates, Inc. 192 Wekiva Way West Palm Beach, Florida / TEL
2 TRAFFIC IMPACT ANALYSIS OPTIMA PLAZA NORTH HALLANDALE BEACH, FL Prepared by: Kimley-Horn and Associates, Inc. West Palm Beach, Florida Project #14193 November 215 Revised January 6, 216 CA 696 Kimley-Horn and Associates, Inc. 192 Wekiva Way West Palm Beach, Florida / TEL Christopher W. Heggen, P.E. Florida Registration Number 58636
3 Traffic Impact Analysis TABLE OF CONTENTS INTRODUCTION...1 DATA COLLECTION...3 Intersection Volume Data...3 PROJECT TRAFFIC...4 Existing and Proposed Land Uses...4 Trip Generation...4 Trip Distribution...6 Traffic Assignment...6 EXISTING TRAFFIC...8 FUTURE TRAFFIC...8 LINK ANALYSIS...8 INTERSECTION ANALYSIS...1 Intersection Level of Service and Delay...1 Intersection Queuing...14 PROJECT DRIVEWAY ACCESS...16 CONCLUSION...17 k:\wpb_tpto\141\14193 optima plaza north\tia\ tia resubmittal\ optima plaza north tia.doc Page i
4 Traffic Impact Analysis APPENDICES APPENDIX A: SITE PLAN APPENDIX B: STUDY METHODOLOGY APPENDIX C: LINK DATA (BROWARD COUNTY MPO) APPENDIX D: SERPM MODEL OUTPUT APPENDIX E: TURNING MOVEMENT COUNTS AND FDOT PEAK SEASON FACTORS APPENDIX F: GROWTH RATE CALCULATIONS WORKSHEETS AND VOLUME DEVELOPMENT APPENDIX G: SIGNAL TIMING WORKSHEETS APPENDIX H: INTERSECTION ANALYSIS APPENDIX I: COMMITTED DEVELOPMENT DATA APPENDIX J: FDOT PRE-APPLICATION LETTER LIST OF TABLES Table 1 Trip Generation...5 Table 2 Link Analysis...9 Table 3 Intersection Analysis (Existing Conditions)...11 Table 4 Intersection Analysis (Future Background)...12 Table 5 Intersection Analysis (Future Total)...13 Table 6 Intersection Queuing (Existing Conditions)...14 Table 7 Intersection Queuing (Future Background)...15 Table 8 Intersection Queuing (Future Total)...15 LIST OF FIGURES Figure 1 Project Location Map...2 Figure 2 Site Traffic Assignment...7 k:\wpb_tpto\141\14193 optima plaza north\tia\ tia resubmittal\ optima plaza north tia.doc Page ii
5 Traffic Impact Analysis INTRODUCTION Optima Plaza North is a proposed office and bank site located on the west side of Federal Highway (US 1) just north of the Broward County/Miami-Dade County line in Hallandale Beach, Florida. Figure 1 illustrates the location of the proposed development. The proposed groundlevel site plan is included in Appendix A. Kimley-Horn and Associates, Inc. has prepared this traffic impact analysis for submittal to the City of Hallandale Beach. The purpose of the study is to assess the project s impact on the surrounding roadway network and to evaluate the capacity available to support future traffic volumes. This report summarizes the data collection, project trip generation, distribution and link analysis. The methodology for the study was based upon the City of Hallandale Beach s Development Review Procedures Impact Evaluation submission requirements (City Code Section (g)) and a methodology meeting held on September 29, 215 with the City s consultant. A copy of the methodology determined in that meeting is included in Appendix B. k:\wpb_tpto\141\14193 optima plaza north\tia\ tia resubmittal\ optima plaza north tia.doc Page 1

6 LEGEND SITE FIGURE 1 SITE LOCATION OPTIMA PLAZA
7 Traffic Impact Analysis DATA COLLECTION To determine traffic conditions on the surrounding network, intersection turning movement counts were performed at the major intersections within 1, foot radius of the site plus additional intersections as agreed upon in the methodology determined with the City s consultant. Below is a summary of the intersections included in this analysis. Intersection Volume Data Turning movement counts were collected for the a.m. (7: a.m. to 9: a.m.) and p.m. peak period (4: p.m. to 6: p.m.) at the following intersections: Major Hallandale Beach intersections within 1, feet of the site plus adjacent intersections: Additional intersections: NE 213 th Street & Biscayne Boulevard SE 9 th Street & Federal Highway County Line Road & Dixie Highway County Line Road & SE 1 st Avenue SE 1 th Street & SE 3 rd Avenue SE 3 rd Street & Federal Highway* SE 3 rd Street & Dixie Highway SE 3 rd Street & SE 1 st Avenue Hallandale Beach Boulevard & Federal Highway* Hallandale Beach Boulevard & Dixie Highway Hallandale Beach Boulevard & SE/NE 1 st Avenue Hallandale Beach Boulevard & SE/NE 8 th Avenue* Hallandale Beach Boulevard & SE/NE 1 th Avenue* * Baseline turning movement count data was used from data reported in the Chateau Square Study conducted by Traf Tech, Inc (August 215) The above turning movement counts were conducted during typical weekday conditions on October 28 th, 215. The volumes were collected in 15-minute intervals and the peak hour was determined for each intersection. The FDOT peak season conversion factor was applied to the traffic counts to adjust the traffic to peak season volumes. The turning movement counts and FDOT peak season factor category report are included in Appendix E. k:\wpb_tpto\141\14193 optima plaza north\tia\ tia resubmittal\ optima plaza north tia.doc Page 3
8 Traffic Impact Analysis PROJECT TRAFFIC Project traffic used in this analysis is defined as the vehicle trips expected to be generated by the project, and the distribution and assignment of that traffic over the study roadway network. Existing and Proposed Land Uses The project site currently contains a pre-school learning center. No credit was applied for the existing use, which provided for a more conservative analysis of overall impacts. The proposed use is a 277,299 square foot office building with 6,218 square feet of drive-in bank use. For analysis purposes, the office square footage identified above includes the second story of bank use. Trip Generation The trip generation potential of this facility has been calculated using rates and equations published for Land Use 71 (General Office) and Land Use 912 (Drive-in Bank) by the Institute of Transportation Engineers (ITE) in the Trip Generation Handbook, Ninth Edition. Pass-by capture credits for the bank use were calculated based upon percentages published in the Trip Generation Handbook. As noted, the second story of the bank use identified on the site plan has been evaluated as office use because it is anticipated to function more like an office use than the customer-based first floor area of the bank. Table 1 summarizes the trip generation potential in the weekday a.m. and p.m. peak hours. k:\wpb_tpto\141\14193 optima plaza north\tia\ tia resubmittal\ optima plaza north tia.doc Page 4
9 Traffic Impact Analysis Table 1 Optima Plaza North Trip Generation Determination AM Peak Hour Trips PM Peak Hour Trips Land Use Intensity Daily Trips Total Inbound Outbound Total Inbound Outbound GROSS TRIPS Office 277,299 square ft Drive-In Bank 6,218 square ft SUBTOTAL (DRIVEWAY VOLUMES) PASS-BY TRIPS Drive-In Bank 47% TOTAL (NET NEW TRAFFIC) Trip generation rates used are published by the Institute of Transportation Engineers (ITE) in Trip Generation, 9th Edition Office Daily: AM Peak Hour: PM Peak Hour: Drive-In Bank Daily: AM Peak Hour: PM Peak Hour: Ln(T) =.76 * Ln(ksf) Ln(T) =.8 * Ln(ksf) (88% inbound, 12% outbound) T =1.12 * (ksf) (17% inbound, 83% outbound) T = * ksf T = 12.8 trips per ksf (57% inbound, 43% outbound) T = 24.3 trips per ksf (5% inbound, 5% outbound) Note: Ground floor of bank use used to determine square footage for drive-in bank use; second floor was assumed as office use k:\wpb_tpto\141\14193 optima plaza north\tia\ tia resubmittal\ optima plaza north tia.doc Page 5
10 Traffic Impact Analysis Trip Distribution The Year 235 Southeast Florida Regional Planning Model (SERPM 6.5.4) was used to determine project traffic distribution at project buildout. The project Select Zone created in SERPM was calibrated to generate a daily trip volume within five percent of the ITE-calculated daily trip generation. Also, the Select Zone run was performed without compressing the model analysis for any counties. The SERPM projections are included in this report in Appendix D. Traffic Assignment The site traffic was assigned to the surrounding roadway network using the 235 SERPM model distribution described above. Figure 2 illustrates the project traffic assignment percentages to the surrounding roadway network. k:\wpb_tpto\141\14193 optima plaza north\tia\ tia resubmittal\ optima plaza north tia.doc Page 6


11 XX% LEGEND TRIP ASSIGNMENT FIGURE TRIP DISTRIBUTION OPTIMA PLAZA
12 Traffic Impact Analysis EXISTING TRAFFIC Existing traffic conditions were determined based upon actual traffic volumes counted at the study intersections with an adjustment to peak season conditions based upon peak season conversion factors published by FDOT. FUTURE TRAFFIC Future background traffic volumes were calculated as the sum of the existing peak-season adjusted traffic volumes plus an additional amount of traffic to account for future growth in the study area. Future growth was calculated as the sum of a nominal background growth rate (.5%) compounded annually plus traffic generated by approved projects in the vicinity of this site. An historical growth rate was calculated based on counts provided by FDOT for comparison purposes; this growth rate was calculated to be 1.53%. Growth rate calculations are included in Appendix F. Total future traffic volumes considered in the analysis for this project are the sum of the 22 background traffic volumes plus future project traffic volumes at site buildout. LINK ANALYSIS A roadway link analysis has been conducted for year 22 traffic conditions on major roadway links in the City of Hallandale Beach within one mile of the site. The roadway link analysis indicates that the segments of Federal Highway and Hallandale Beach Boulevard within the one-mile radius currently operate at Level of Service (LOS) F. The project is only projected to have greater than a 3% impact on Dixie Highway west of the project site. The only roadway links on which level of service will change due to project traffic are Hallandale Beach Boulevard and Dixie Highway. k:\wpb_tpto\141\14193 optima plaza north\tia\ tia resubmittal\ optima plaza north tia.doc Page 8
13 Traffic Impact Analysis TABLE 2 OPTIMA PLAZA NORTH PM TWO-WAY PEAK HOUR SIGNIFICANCE CALCULATIONS (22) Roadway From To Roadway Lanes Existing Committed LOS D* LOS D* Lanes Existing Base Peak Hour Volume/LOS 22 Growth Background Committed 22 Class Service Service Rate Growth Traffic Background Assignment Volume Volume (growth rate) Traffic PM TWO-WAY PEAK HOUR PM Peak Hour Project Traffic South Federal Highway (US 1) Miami-Dade County line Hallandale Beach Blvd Class II 6LD 4,5 6LD 4,5 4,845 F.5% ,537 19% % 5,626 F Dixie Highway Miami-Dade County line Hallandale Beach Boulevard Class II 2LU 3,154 2LU 3, C.5% % % 967 C Hallandale Beach Boulevard East of I-95 US 1 Class II 6LD 5,39 6LD 5, C.5% ,812 2% 21.39% 6,833 C US 1 East of US 1 Class II 6LD 5,39 6LD 5, C.5% ,77 5% 5.9% 4,82 C % Project Trips % Impact 22 Peak Hour Volume with Project Traffic * Roadway capacity and 213 volumes provided by Broward County MPO k:\wpb_tpto\141\14193 optima plaza north\tia\ tia resubmittal\ optima plaza north tia.doc Page 9
14 Traffic Impact Analysis INTERSECTION ANALYSIS The operating conditions for three conditions (existing, background and future total) were analyzed at the signalized and unsignalized study intersections during the AM peak hour and PM peak hour using Trafficware s Synchro 9. Software. These analyses use the methodologies outlined in the Highway Capacity Manual, 2 Edition in order to determine overall intersection level of service and delay, and queuing. Output from the HCM 2 edition was provided instead of the more recent 21 version because some discrepancies in the calculations of queuing, level of service and delay have been reported for output in the 21 version, particularly in the analysis of shared lanes. Therefore, to maintain a consistent analysis, the HCM 2 output has been utilized in this analysis, even for intersections not involving shared lanes. Intersection Level of Service and Delay Tables 3, 4 and 5 summarize the existing, future background, and future total level of service (LOS) at the study intersections. As shown in these tables, the intersections of Hallandale Beach Boulevard & Federal Highway, SE 3 rd Street & Federal Highway, SE 9 th Street & Federal Highway and SE 3 rd Street & Dixie Highway are projected to operate at LOS E or F during future background conditions without the project. The overall LOS at the intersection of Hallandale Beach Boulevard & Federal Highway (US-1) was determined to change from LOS E to F at future buildout conditions. Otherwise, no change in LOS is anticipated at any of these intersections with the inclusion of project traffic, and all other intersections are projected to operate at LOS D or better. It is also noted that the project will be required to contribute to a transportation mitigation payment to the City per the City s transportation mitigation payment schedule. The turning movement count data is included in Appendix E. Existing signal timing worksheets are included in Appendix G. HCS and Synchro output worksheets are included in Appendix H. k:\wpb_tpto\141\14193 optima plaza north\tia\ tia resubmittal\ optima plaza north tia.doc Page 1
15 Traffic Impact Analysis NE 213th Street & Biscayne Boulevard SE 9th Street & Federal Highway SE 3rd Street & Federal Highway SE 3rd Street & Dixie Highway SE 3rd Street & SE 1st Avenue Table Existing Conditions Intersection Traffic Control Overall Delay / LOS Signalized Signalized Signalized Signalized Signalized AM Peak Hour Approach LOS NB SB EB WB 24.7 C C B - E 16.7 B B B E E 58.1 E C D F E 59.3 E - E D D F D - F C Hallandale Beach Boulevard & Federal Highway Signalized 7.5 E D E E F Hallandale Beach Boulevard & Dixie Highway Hallandale Beach Boulevard & SE/NE 1st Avenue Hallandale Beach Boulevard & SE/NE 8th Avenue Hallandale Beach Boulevard & SE/NE 1th Avenue County Line Road & Dixie highway County Line Road & SE 1st Avenue 214th Terrace & 3rd Avenue SE 3rd Avenue & SE 1th Court Optima DW & Federal Highway NE 213th Street & Biscayne Boulevard SE 9th Street & Federal Highway SE 3rd Street & Federal Highway SE 3rd Street & Dixie Highway SE 3rd Street & SE 1st Avenue Signalized 27.6 C - E C B Signalized 23.2 C F - A C Signalized 28.8 C E C D B Signalized 23.1 C C - B C Signalized 27.3 C C C D B Signalized 25.3 C C C C - Unsignalized A A - Unsignalized - - A A A - Unsignalized B - PM Peak Hour Signalized 27.8 C C B - E Signalized 19.1 B B B E E Signalized 48.2 D C D E E Signalized 96.1 F - D D F Signalized 6.4 E D - F D Hallandale Beach Boulevard & Federal Highway Hallandale Beach Boulevard & Dixie Highway Hallandale Beach Boulevard & SE/NE 1st Avenue Hallandale Beach Boulevard & SE/NE 8th Avenue Hallandale Beach Boulevard & SE/NE 1th Avenue County Line Road & Dixie highway County Line Road & SE 1st Avenue 214th Terrace & 3rd Avenue SE 3rd Avenue & SE 1th Court Optima DW & Federal Highway Signalized Signalized Signalized Signalized Signalized Signalized Signalized Unsignalized Unsignalized Unsignalized 78.5 E E E E F 28.7 C - E D B 22.2 C E - A B 26. C E D C C 31.8 C D - B D 25.6 C C B D C 2.1 C D C A A A A A A - k:\wpb_tpto\141\14193 optima plaza north\tia\ tia resubmittal\ optima plaza north tia.doc Page 11
16 Traffic Impact Analysis Intersection NE 213th Street & Biscayne Boulevard SE 9th Street & Federal Highway SE 3rd Street & Federal Highway SE 3rd Street & Dixie Highway SE 3rd Street & SE 1st Avenue Table 4 22 Future Background Conditions Traffic Control Signalized Signalized Signalized Signalized Signalized AM Peak Hour Overall Delay / LOS Approach LOS NB SB EB WB 25.1 C C B - E 22.7 C B C E E 62.5 E D E F F 59.9 E - E D D F D - F C Hallandale Beach Boulevard & Federal Highway Signalized 74.5 E D E E F Hallandale Beach Boulevard & Dixie Highway Hallandale Beach Boulevard & SE/NE 1st Avenue Hallandale Beach Boulevard & SE/NE 8th Avenue Hallandale Beach Boulevard & SE/NE 1th Avenue County Line Road & Dixie highway County Line Road & SE 1st Avenue 214th Terrace & 3rd Avenue SE 3rd Avenue & SE 1th Court Optima DW & Federal Highway NE 213th Street & Biscayne Boulevard SE 9th Street & Federal Highway SE 3rd Street & Federal Highway SE 3rd Street & Dixie Highway SE 3rd Street & SE 1st Avenue Signalized 28.4 C - E C B Signalized 26.9 C F - S C Signalized 3.9 C E D D B Signalized 23.3 C C E B C Signalized 27.2 C C C D B Signalized 23.5 C C C C - Unsignalized A A - Unsignalized - - A B A A Unsignalized - - A - B - PM Peak Hour Signalized 31.3 C D B - E Signalized 25. C C C E E Signalized 74.5 E E E E E Signalized 97.3 F - D D F Signalized 62.8 E D - F D Hallandale Beach Boulevard & Federal Highway Hallandale Beach Boulevard & Dixie Highway Hallandale Beach Boulevard & SE/NE 1st Avenue Hallandale Beach Boulevard & SE/NE 8th Avenue Hallandale Beach Boulevard & SE/NE 1th Avenue County Line Road & Dixie highway County Line Road & SE 1st Avenue 214th Terrace & 3rd Avenue SE 3rd Avenue & SE 1th Court Optima DW & Federal Highway Signalized Signalized Signalized Signalized Signalized Signalized Signalized Unsignalized Unsignalized Unsignalized 96.7 F F E E F 33.1 C - E D B 33.9 C E - A D 65.9 E F D D C 31.5 C D E B D 26.6 C C B D C 21.6 C D C A A A A A A A - - A - A - k:\wpb_tpto\141\14193 optima plaza north\tia\ tia resubmittal\ optima plaza north tia.doc Page 12
17 Traffic Impact Analysis Intersection NE 213th Street & Biscayne Boulevard SE 9th Street & Federal Highway SE 3rd Street & Federal Highway SE 3rd Street & Dixie Highway SE 3rd Street & SE 1st Avenue Hallandale Beach Boulevard & Federal Highway Hallandale Beach Boulevard & Dixie Highway Hallandale Beach Boulevard & SE/NE 1st Avenue Hallandale Beach Boulevard & SE/NE 8th Avenue Hallandale Beach Boulevard & SE/NE 1th Avenue County Line Road & Dixie highway County Line Road & SE 1st Avenue 214th Terrace & 3rd Avenue SE 3rd Avenue & SE 1th Court Optima DW & Federal Highway NE 213th Street & Biscayne Boulevard SE 9th Street & Federal Highway SE 3rd Street & Federal Highway SE 3rd Street & Dixie Highway SE 3rd Street & SE 1st Avenue Hallandale Beach Boulevard & Federal Highway Table 5 22 Future Total Conditions Traffic Control Signalized Signalized Signalized Signalized Signalized Signalized Signalized Signalized Signalized Signalized Signalized Signalized Unsignalized Unsignalized Overall Delay / LOS Approach LOS NB SB EB WB 26. C C B - E 28.7 C B D E E 63.4 E D E F F 6.8 E - E D D F D - F C 77.4 E D E E F 29.6 C - E C B F - A C 3.7 C E D D B 23.4 C C E B C 29.6 C C C D C 31.6 C C C A A A B B A A Unsignalized - - B - B - PM Peak Hour Signalized Signalized Signalized Signalized Signalized Signalized AM Peak Hour 35.5 D D B - E 27.8 C C C E E 74. E E E E E 97.4 F - D D F 7. E E - F D 98.5 F F E E F Hallandale Beach Boulevard & Dixie Highway Hallandale Beach Boulevard & SE/NE 1st Avenue Hallandale Beach Boulevard & SE/NE 8th Avenue Hallandale Beach Boulevard & SE/NE 1th Avenue County Line Road & Dixie highway County Line Road & SE 1st Avenue 214th Terrace & 3rd Avenue SE 3rd Avenue & SE 1th Court Optima DW & Federal Highway Signalized Signalized Signalized Signalized Signalized Signalized Unsignalized Unsignalized Unsignalized 31.9 C - E D B 39.1 D E - A D 66.1 E F D D C 31.4 C D E B D 28.8 C C B D D 24.4 C D C A B A B B A A - - A - B - k:\wpb_tpto\141\14193 optima plaza north\tia\ tia resubmittal\ optima plaza north tia.doc Page 13
18 Traffic Impact Analysis Intersection Queuing The projected intersection queues were determined from the Synchro output at the main project driveway intersection and intersections with failing levels of service. A summary of the existing, future background and future total queues are presented in Tables 6, 7 and 8. As shown, the projected future queues can be accommodated within the left-turn and right-turn storage provided, with the exception of US-1 & Hallandale Beach Boulevard. As noted previously, the project will be required to contribute to the City s transportation mitigation fund, which may be used to implement capacity and/or queuing storage throughout the overall roadway network. Table 6 Project Queue For Failing/Project Access Intersections Existing AM Queue Length Project /Failing Intersection EBL EBR WBL WBR NBL NBR SBL SBR 95th Percentile Queue Optima Office Drive (US 1 access) Storage Available th Percentile Queue US 1 & Hallandale Beach Boulevard Storage Available Existing PM Queue Length Project /Failing Intersection EBL EBR WBL WBR NBL NBR SBL SBR 95th Percentile Queue Optima Office Drive (US 1 access) Storage Available th Percentile Queue US 1 & 3rd Street Storage Available th Percentile Queue US 1 & Hallandale Beach Boulevard Storage Available k:\wpb_tpto\141\14193 optima plaza north\tia\ tia resubmittal\ optima plaza north tia.doc Page 14
19 Traffic Impact Analysis Table 7 Project Queue For Failing/Project Access Intersections Future Background AM Queue Length Project /Failing Intersection EBL EBR WBL WBR NBL NBR SBL SBR 95th Percentile Queue Optima Office Drive (US 1 access) Storage Available th Percentile Queue US 1 & Hallandale Beach Boulevard Storage Available Future Background PM Queue Length Project /Failing Intersection EBL EBR WBL WBR NBL NBR SBL SBR 95th Percentile Queue Optima Office Drive (US 1 access) Storage Available th Percentile Queue US 1 & 3rd Street Storage Available th Percentile Queue US 1 & Hallandale Beach Boulevard Storage Available Table 8 Project Queue For Failing/Project Access Intersections Future Total AM Queue Length Project /Failing Intersection EBL EBR WBL WBR NBL NBR SBL SBR 95th Percentile Queue Optima Office Drive (US 1 access) Storage Available th Percentile Queue US 1 & Hallandale Beach Boulevard Storage Available Future Total PM Queue Length Project /Failing Intersection EBL EBR WBL WBR NBL NBR SBL SBR 95th Percentile Queue Optima Office Drive (US 1 access) Storage Available th Percentile Queue US 1 & 3rd Street Storage Available th Percentile Queue US 1 & Hallandale Beach Boulevard Storage Available k:\wpb_tpto\141\14193 optima plaza north\tia\ tia resubmittal\ optima plaza north tia.doc Page 15
20 Traffic Impact Analysis PROJECT DRIVEWAY ACCESS Although the majority of site traffic will be traveling to and from the site via US-1, the site will not have any direct access connections along its US-1 frontage. Instead, the site will utilize crossaccess connections on US-1 via the left-in/right-in/right-out Hampton Inn driveway to the north (serving outbound project traffic only) and via the right-in/right-out driveway at the existing Optima building to the south (in the City of Aventura). A pre-application meeting was held with the Florida Department of Transportation on December 17, 215 to determine the allowable access configuration for the site. The draft pre-application letter is provided in Appendix J of this report. k:\wpb_tpto\141\14193 optima plaza north\tia\ tia resubmittal\ optima plaza north tia.doc Page 16
21 Traffic Impact Analysis CONCLUSION Optima Plaza North is a proposed office and bank site located on the west side of Federal Highway (US 1) just north of the Broward County/Miami-Dade County line in Hallandale Beach, Florida. The site is proposed to be developed with 277,299 square feet of office use and 6,218 square feet of drive-in bank use. The analysis has been conducted to evaluate future level of service on the roadway segments and intersections identified in the study methodology. The analysis includes an assumption of background growth plus traffic generated by committed projects in the area. As shown in the analyses, some roadway segments and intersections within the study area currently operate at LOS E or F during weekday peak period conditions. The analysis indicates that no additional roadways or intersections that are currently operating at LOS D or better will degrade to LOS E or F. Additionally, it is noted that the project will be required to contribute to a transportation mitigation payment to the City per the City s transportation mitigation payment schedule. k:\wpb_tpto\141\14193 optima plaza north\tia\ tia resubmittal\ optima plaza north tia.doc Page 17
22 Traffic Impact Analysis APPENDIX A: SITE PLAN k:\wpb_tpto\141\14193 optima plaza north\tia\ tia resubmittal\ optima plaza north tia.doc

23 4533 P ONCE DE LEON BLV D. CORAL GAB LES, F LORIDA Tel: Fax: E -Mail: info@beharfont.c om S E A L : PROPOSED MIXED-USE DEVELOPMENT OPTIMA PLAZA NORTH 11 SOUTH FEDERAL HIGHWAY HALLANDALE, FL BEHAR FONT PARTNERS, P.A. THE DESIGN AND DRAWINGS FOR THIS PROJECT ARE PROPERTY OF THIS ARCHITECT AND ARE PROTECTED UNDER THE COPYRIGHT PROTECTION ACT. SITE LOCATION 76,1 SQFT. CONTEXT PLAN SCALE: N.T.S. 21 SCOTT STREET. BUFORD, GEORGIA 3518 Tel: DATE: PROJECT NO: DRAWING NAME: SHEET NO: G-1
24 OPTIMA PLAZA NORTH 11 SOUTH FEDERAL HIGHWAY HALLANDALE, FL 332 BUILDING COVERAGE: LOT COVERAGE 76,1 SQ. FT. 48, SQ. FT. (63%) MIN. PERVIOUS LOT AREA 15% OF LOT AREA 11,42 SQ. FT. 28,1 SQ. FT. (36%) FLOOR AREA (GROSS) OFFICE AREA (SQFT) BANK AREA (SQFT) COMMON AREA (SQFT) 272,34 SQ.FT. 11,23 SQ.FT. 55,742 SQ.FT. TOTAL BUILDING AREA (SQFT) 728,577 SQ.FT. BUILDING SETBACKS FRONT SIDE (NORTH) REAR (ADJACENT TO RESIDENTIAL) 15''-" SIDE (SOUTH) '-" '-" CORNER '-" 25'-" 15'-" 22'-" 15'-" N/A 15'-" BUILDING HEIGHT 35'-" 35'-" PARKING: OFFICE (1 P.S. : 25 SQFT. ) (1:25) 272,34 SQFT BANK (1 P.S. : 3 SQFT.) (1:3) 11,23 SQFT TOTAL PARKING LOADING: BANK (11,23 SQFT.) 1,1-4, SQFT P ONCE DE LEON BLV D. CORAL GAB LES, F LORIDA Tel: Fax: E -Mail: info@beharfont.c om S E A L : PROPOSED MIXED-USE DEVELOPMENT 213 BEHAR FONT PARTNERS, P.A. THE DESIGN AND DRAWINGS FOR THIS PROJECT ARE PROPERTY OF THIS ARCHITECT AND ARE PROTECTED UNDER THE COPYRIGHT PROTECTION ACT. ZONING CHART SCALE: N.T.S. 21 SCOTT STREET. BUFORD, GEORGIA 3518 Tel: DATE: PROJECT NO: DRAWING NAME: SHEET NO: A-


25 4533 P ONCE DE LEON BLV D. CORAL GAB LES, F LORIDA Tel: Fax: E -Mail: info@beharfont.c om 21 SCOTT STREET. BUFORD, GEORGIA 3518 Tel: S E A L : PROPOSED MIXED-USE DEVELOPMENT OPTIMA PLAZA NORTH HALLANDALE, FLORIDA 213 BEHAR FONT PARTNERS, P.A. THE DESIGN AND DRAWINGS FOR THIS PROJECT ARE PROPERTY OF THIS ARCHITECT AND ARE PROTECTED UNDER THE COPYRIGHT PROTECTION ACT. 648'-1" 36'-" 57'-" 2'-1" 99'-1" 74'-" 152'-6" 2'-1" 56'-2" 131'-8" GROUND LEVEL FLOOR PLAN SCALE: 1" = 3'-" DATE: PROJECT NO: DRAWING NAME: SHEET NO: A-1 21'-" STBK 66'-" 2'-1" 46'-3" 2'-1" 77'-11" 119'-7" 125'-1" 323'-1" 11'-4" 46'-3" 94'-4" 1'-8" 72'-5" 11'-4" 18'-8" 94'-4" 34'-4" 36'-5" 11'-4" 25'-2" STBK 15'-" STBK 17'-4" STBK STBK 28'-2" 3'-" 17'-" STBK
26 Traffic Impact Analysis APPENDIX B: STUDY METHODOLOGY k:\wpb_tpto\141\14193 optima plaza north\tia\ tia resubmittal\ optima plaza north tia.doc
27 MEMORANDUM To: From: Jose Rodriguez, P.E. Keith and Schnars, P.A. Christopher W. Heggen, P.E. Kimley-Horn and Associates, Inc. Date: October 27, 215 Subject: Optima Plaza North Traffic Evaluation Methodology Kimley-Horn # The Optima Plaza North site is an office and bank site located on the west side of Federal Highway (US 1) just north of the Broward County/Miami-Dade County line in Hallandale Beach, Florida. The site includes driveway connections on South Federal Highway (U.S. 1) and SE 1 th Street and a cross-access connection to the existing Optima building immediately south of this site. The following methodology has been developed to address the items to be included in the traffic analysis of this proposed right-in-only driveway. Trip generation: The trip generation potential for the retail building will be calculated using rates and equations published for Land Use 71 (General Office) and Land Use 912 (Drive-in Bank) by the Institute of Transportation Engineers (ITE) in the Trip Generation Handbook, Ninth Edition. Pass-by capture credits for the bank use will be calculated based upon percentages published in the Trip Generation Handbook. A preliminary trip generation calculation has been attached. Trip distribution/assignment: A select zone run will be performed using the Southeast Florida Regional Planning Model (SERPM) to determine overall traffic distribution in the vicinity of the site. Based upon this distribution, traffic volumes will be assigned to the local roadway network. Data collection: AM (7: AM 9: AM) and PM (4: PM 6: PM) peak period turning movement counts will be collected at the following locations: - NE 213 th Street & Biscayne Boulevard - SE 9 th Street & Federal Highway - SE 3 rd Street & Federal Highway - SE 3 rd Street & Dixie Highway - SE 3 rd Street & SE 1 st Avenue - Hallandale Beach Boulevard & Federal Highway - Hallandale Beach Boulevard & Dixie Highway - Hallandale Beach Boulevard & SE/NE 1 st Avenue - Hallandale Beach Boulevard & SE/NE 8 th Avenue - Hallandale Beach Boulevard & SE/NE 1 th Avenue - County Line Road & Dixie Highway - County Line Road & SE 1 st Avenue kimley-horn.com 192 Wekiva Way, Suite 2, West Palm Beach, FL

28 Page 2 - NE 214 th Terrace & East Dixie Highway - SE 1 th Street & SE 3 rd Avenue - Existing Optima Plaza driveways on NE 214 th Terrace and Biscayne Blvd From this count data, peak hour traffic volumes will be determined. For any counts conducted outside of the peak season (January March), the Peak Season Conversion Factor (PSCF) published by FDOT for this portion of Broward County will be applied. Future Background Volumes: Future background volumes will be determined by adding a.5% compounded annual growth rate plus specific development volumes from approved projects to the intersection counts. The list of approved projects provided by the City of Hallandale Beach will be utilized in the analysis to determine volumes added at study intersections. Total Future Volumes: Total future volumes will be determined by adding project traffic volumes at each of the study intersections. Intersection LOS Analysis: Intersection LOS analyses will be conducted for Existing Peak Season, Future Background Peak Season and Future Total Peak Season Conditions using Synchro software. HCM 2 output will be used to determine LOS and delay at each study intersection. Roadway LOS Analysis: Existing, Future Background and Total Future LOS analyses will be conducted for major roadways in Broward County within 1 mile of the project utilizing traffic count data and Adopted LOS Volumes published by the Broward County Metropolitan Planning Organization (MPO). Turn lane requirements and vehicular queue storage requirements will be determined at site turn lanes based upon the volumes of traffic anticipated to utilize the site driveways. Following a determination of project impacts, the Applicant will review potential mitigation measures with City staff and the City consultant to evaluate feasibility and appropriateness of these measures. The data collection, calculations, analyses and results will be summarized in a written report for City review. Relevant tables, charts, figures and worksheets will be included in the summary report. Please review the methodology for this analysis as outlined above and indicate your concurrence by signing in the space below. Should you have questions or comments regarding the proposed methodology, please call me via phone at (561) or via at chris.heggen@kimleyhorn.com. Concur by: Date: Jose Rodriguez, P.E. K:\WPB_TPTO\85294\cwh\215\Optima Plaza North\ Optima Plaza Traffic Methodology.docx kimley-horn.com 192 Wekiva Way, Suite 2, West Palm Beach, FL
29 Traffic Impact Analysis APPENDIX C: LINK DATA (BROWARD COUNTY MPO) k:\wpb_tpto\141\14193 optima plaza north\tia\ tia resubmittal\ optima plaza north tia.doc
30 Broward County Broward County Roadway Capacity and Level of Service Analysiscity and Level of Service Analysis APPENDIX C: North / South Roadways Capacity and Level of Service Analysis 213 & Design Daily Conditions Peak Hour Conditions Design Daily Conditions Peak Hour Conditions ID N/SRoadway Segment Code AADT Capacity V/C LOS Volume Capacity V/C LOS Code Volume Capacity V/C LOS Volume Capacity V/C LOS 795 NE 6 Ave N of Dixie Hwy D D D D 797 NE 6 Ave N of Prospect Rd D D D D 799 NE 6 Ave N of Commercial Blvd C C D D 81 NE 6 Ave N of NE 56 St C C C C 111 NW 6 Ave N of Atlantic Blvd D D D D 83 NE 3 Ave N of Copans Rd D D E F 85 NE 3 Ave N of Sample Rd D D D D 87 NE 3 Ave N of NE 48 St D D D D 157 NE 3 Ave N of NE 54 St / SW 15 St D D D D 89 Natura Blvd N of SE 1 St C C C C 811 Dixie Hwy/ 21 Ave N of Dade C L C C C C 813 Dixie Hwy/ 21 Ave N of Hndle Bch Blvd C C D D 815 Dixie Hwy/ 21 Ave N of Pembroke Rd C C D D 817 Dixie Hwy/ 21 Ave N of Hollywood Blvd C C D D 819 Dixie Hwy/ 21 Ave N of Sheridan St C C C C 149 Dixie Hwy/ 21 Ave N of Phippen Rd C C C C 821 SE 3 Ave N of SE 17 St C C D D 823 SE 3 Ave N of Davie Blvd C C D D 825 SE 3 Ave N of SE 7 St-CBD D D D D 827 NE 3 Ave N of Broward Blvd-CBD D D D D 829 NE 3 Ave N of NE 6 St C C D D 831 NE 4 Ave/Wilton Dr N of Sunrise Blvd D D D D 833 Dixie Hwy N of Oakland Pk Blvd D D D D 835 Dixie Hwy N of NE 38 St C C C C 837 Dixie Hwy N of Commercial Blvd C C C C 839 Dixie Hwy N of McNab Rd B B C C 841 Dixie Hwy N of Pompano Park Pl D D D D 843 Dixie Hwy N of Atlantic Blvd D D D D 845 Dixie Hwy N of NW 15 St C C C C 847 Dixie Hwy N of Copans Rd C C C C 849 Dixie Hwy N of Sample Rd C C C C 851 Dixie Hwy N of NE 48 St C C C C 853 Dixie Hwy N of SW 1 St C C C C 855 Dixie Hwy N of Hillsboro Blvd r.4 C r.42 C r.95 C r 1. D 857 NE 15 Ave N of Las Olas Blvd D D D E 859 NE 15 Ave N of Broward Blvd C C C C 861 NE 15 Ave N of NE 6 St D D D D 863 NE 15 Ave N of Sunrise Blvd C D D D 865 NE 15 Ave N of NE 13 St C C D D 145 NE 15 Ave N of NE 18 St D D E F 115 NE 16 Ave N of Oakland Pk Blvd C C C C 867 Cypress Rd /18 Av N of Floranada Rd E F F F 869 Cypress Rd /18 Av N of Commercial Blvd D D D D 871 Cypress Rd /18 Av N of NE 62 St D D E F 873 NE 5 Ave / 1 St / 2 Ave N of Atlantic Blvd C C C C 875 NE 11 Ave N of Atlantic Blvd C C C C 117 SW 3 Ave (Deerfield Bch) N of SW 1 St C C C C 1167 SE 2 Ave (Deerfield Bch)N of SE 1 St C C D D
31 Broward County Broward County Roadway Capacity and Level of Service Analysiscity and Level of Service Analysis APPENDIX C: North / South Roadways Capacity and Level of Service Analysis 213 & Design Daily Conditions Peak Hour Conditions Design Daily Conditions Peak Hour Conditions ID N/SRoadway Segment Code AADT Capacity V/C LOS Volume Capacity V/C LOS Code Volume Capacity V/C LOS Volume Capacity V/C LOS 877 US 1 N of Dade C L F F F F 879 US 1 N of Hndle Bch Blvd F F F F 881 US 1 N of Pembroke Rd D D F F 883 US 1 N of Hollywood Blvd D D F F 885 US 1 N of Sheridan St D D F F 887 US 1 N of Stirling Rd F F F F 889 US 1 N of Griffin Rd C C F F 891 US 1 N of I F F F F 893 US 1 N of SR F F F F 895 US 1 N of Davie Blvd C C D F 897 US 1 N of SE 7 St-CBD D D F F 899 US 1 N of Broward Blvd-CBD D D D F 91 US 1 N of NE 6 St D D D D 93 US 1 E of Searstown (see 536) F F F F 95 US 1 N of Gateway C C C D 97 US 1 N of Oakland Pk Blvd C C C D 99 US 1 N of Commercial Blvd C C C C 911 US 1 N of NE 62 St C C C D 913 US 1 N of McNab Rd C C C D 915 US 1 N of Atlantic Blvd C C C C 917 US 1 N of NE 1 St C C C D 919 US 1 N of Copans Rd C C C C 921 US 1 N of Sample Rd C C C C 923 US 1 N of SW 1 St C C C C 925 US 1 N of Hillsboro Blvd C C C C 927 Miami Rd N of Eller Dr e C C C C 929 Miami Rd N of SR C C C C 1111 Miami Rd N of SE 17 St C C C C 933 Victoria Pk Rd N of Broward Blvd C C D D 935 NE 2 Ave/7 St E of Victoria Pk Rd C C D D 937 NE/S 14 Ave N of Hndle Bch Blvd D D D D 939 N 14 Ave N of Hollywood Blvd C C C C 1113 SE 5 Ave N of Sheridan St D D F F 941 Diplomat Pkwy N of Hndle Bch Blvd C C C C 947 Eisenhower Blvd N of Eller Dr C C C C 999 Eisenhower Blvd N of Spangler Rd C C D D 949 Bayview Dr N of Sunrise Blvd D D F F 951 Bayview Dr N of Oakland Pk Blvd D D E F 953 Bayview Dr N of Commercial Blvd D D D D 955 NE 26 Ave / NE 1 St N of Atlantic Blvd C C C C 957 NE 23 Ave N of Copans Rd e C C D D 959 NE 22/23 Ave N of Sample Rd C C D D 961 SE 12 Ave N of NE 49 St D D C D 965 SR A1A N of Dade C L D D D D 967 SR A1A N of Hndle Bch Blvd D D D D 969 SR A1A N of Hollywood Blvd D D D E 971 SR A1A N of Sheridan St C C C C 973 SR A1A N of SE 17 St D E F F
32 Broward County Broward County Roadway Capacity and Level of Service AnalysisCapacity and Level of Service Analysis APPENDIX B: East / West Roadways Capacity and Level of Service Analysis 213 & Design Daily Conditions Peak Hour Conditions Daily Conditions Peak Hour Conditions ID E/W Roadway Segment Code AADT Capacity V/C LOS Volume Capacity V/C LOS Code Volume Capacity V/C LOS Volume Capacity V/C LOS 1118 Honey Hill Rd E of SW 148 Ave N/A N/A N/A N/A N/A N/A N/A N/A N/A C C 112 Honey Hill Rd E of Flamingo Rd D D F F 2 Bass Crk Rd E of SW 184 Ave N/A N/A N/A N/A N/A N/A N/A N/A N/A C C 1152 Bass Crk Rd E of SW 172 Ave D D C C 4 Bass Crk Rd E of Dykes Rd C C C C 6 County Line Rd E of University Dr r.68 C r.72 C r.68 C r.72 C 8 County Line Rd E of FTPK r.85 C r.89 C r.62 C r.65 C 1 County Line Rd E of SR F F F F 146 County Line Rd E of SW 48 Ave C C D D 12 County Line Rd E of SW 4 Ave D D D D 1124 SW 11 St E of I C C C C 14 Miramar Pkwy E of SW 196 Ave C C C C 18 Miramar Pkwy E of SW 184 Ave r.48 C r.5 C r.97 D r 1.3 F 2 Miramar Pkwy E of SW 172 Ave r.77 C r.82 C r.78 C r.83 C 22 Miramar Pkwy E of SW 16 Ave r 1.14 F r 1.21 F r.73 C r.77 C 24 Miramar Pkwy E of I F F C D 26 Miramar Pkwy E of SW 148 Ave C C C C 28 Miramar Pkwy E of SW 136 Ave C C C C 3 Miramar Pkwy E of Flamingo Rd C C C D 32 Miramar Pkwy E of Red Rd C C C C 34 Miramar Pkwy E of Palm Ave C D C F 36 Miramar Pkwy E of Douglas Rd C C F F 38 Miramar Pkwy E of University Dr C C F F 4 Hndle Bch Blvd E of SR C C F F 42 Hndle Bch Blvd E of I F F F F 44 Hndle Bch Blvd E of US C C D C 46 Hndle Bch Blvd E of Diplomat Pkwy C C C C 1 Monarch Lakes Blvd N of Miramar Pkwy C C D D 12 Miramar Blvd E of Flamingo Rd C C C C 14 Miramar Blvd E of Red Rd C C C C 16 Miramar Blvd E of Hiatus Rd C C D D 5 Miramar Blvd E of Palm Ave F F D D 52 Miramar Blvd E of Douglas Rd D D D D 56 Pembroke Rd E of US 27 N/A N/A N/A N/A N/A N/A N/A N/A N/A N/A N/A N/A N/A N/A N/A N/A N/A N/A 58 Pembroke Rd E of SW 196 Ave N/A N/A N/A N/A N/A N/A N/A N/A N/A N/A N/A N/A N/A N/A N/A N/A N/A N/A 6 Pembroke Rd E of SW 184 Ave D D r.54 C r.57 C 966 Pembroke Rd E of SW 172 Ave D D r.72 C r.76 C 1154 Pembroke Rd E of SW 16 Ave N/A N/A N/A N/A N/A N/A N/A N/A N/A r.92 C r.97 D 968 Pembroke Rd E of SW 145 Ave r.67 C r.71 C r 1.14 F r 1.2 F 62 Pembroke Rd E of SW 136 Ave r.67 C r.71 C r 1.16 F r 1.23 F 64 Pembroke Rd E of Flamingo Rd C C D F 66 Pembroke Rd E of Hiatus Rd C C C C 68 Pembroke Rd E of Palm Ave C C C C 7 Pembroke Rd E of Douglas Rd C C C C 72 Pembroke Rd E of University Dr C C C C 74 Pembroke Rd E of SW 68 Ave F F C C 15 Pembroke Rd E of SW 62 Ave C C C C 76 Pembroke Rd E of SR C C C D 78 Pembroke Rd E of I F F F F 8 NE 9 St E of US D D D D 148 NE 9 St E of Atlantic Shores D D D D
33 Traffic Impact Analysis APPENDIX D: SERPM MODEL OUTPUT k:\wpb_tpto\141\14193 optima plaza north\tia\ tia resubmittal\ optima plaza north tia.doc
34 Optima SERPM Trip Distribution (Licensed to Kimley-Horn and Associates, Inc.)
35 Optima SERPM Trip Distribution (Licensed to Kimley-Horn and Associates, Inc.)
36 Traffic Impact Analysis APPENDIX E: TURNING MOVEMENT COUNTS AND FDOT PEAK SEASON FACTORS k:\wpb_tpto\141\14193 optima plaza north\tia\ tia resubmittal\ optima plaza north tia.doc
37 83 SE 9TH STREET & S FEDERAL HIGHWAY HAL,I,ANDALE BEACH, FLORIDA COTNTED BY: A. GONZALEZ & A. palomino SIGNALIZED Traf f ic Survey Specia.l-ist.s, Inc. 85 SE 4lh Avenue, Unit 19 nflr^v RFA.h F'1^rida Phone (561) ALL VEHICLES Site Code : St.art Date: I/28/15 FilE I.D. : 9STR_US1 Page : I S FEDERAL HIGHI{AY From NorEh I ef oru ctdfft! rom hjas c I S FEDERAL HIGHWAY From South!rom west UTurn Left Thru Right UTurn Left. Thru Right DaEe 7/28/15 I UTurn LefC I Thru Righc I UTurn Left Thru Right 71 3 L 222 3l l 7: l O7t Hr Total 4 8 r4o7 1 I o 2 o 1l 2 2 Ll o 5 l 3 l l 8: 4552 l o 7 1 3l a 26 27L 3l 8:15 o4538 2l o 4 l a L l 8: l I I 8: l 2 l l Hr Tobal r r 4l 4 s r I 16: 16:15 16:3 L6t45 Hr Total - * BREAK * I o L l?q 4 14 sl 4l 2l 22 17: 17:15 17:3 r' Hr Total l '7 1 2 L l l 7l l r 491 6l l r-r I L I t2 4 l 4l e 9l l 7]-2499s '7 I r s r2l 18s 22 '16 l L l r o12 s s l3 I8 36 I 39 *TOTAL* s 669 1C? l 1 t42t9
38 SE 9TH STREET & S FEDERAI, HIGHWAY HALLANDALE BEACH. FLORIDA COITNTED BY: A. GONZALEZ & A. PALOMINO S IGNALI ZED Trrffia crrrvarr q^a.ial icra Th. 85 SE 4th Avenue, Unit 19 ne l rev RFA.h Fl nri ri Phone (561) ALL VEHICLES Site Code : start Date: I/28/75 FilE I.D. : 9STR_US1 Page : 2 S FEDERAL HIGHWAY From North I cf oru crdcft I rrom EasE. I s FEDERAT, HrcHwAY!rom Soucn From West. I I UTurn LefE. Thru Right I UTurn Left Thru Right. I UTurn Left Thru Right I UTurn Left Thru Right. '1Eaa DaEe 1/28/ Peak Hour Analysls By Entire Intersect.ion for the Period: 7: to 9: on 1,/28/1,5 Peak seare 8: I og, oo I og,oo 8: volume r r '7 76 Percent t l* 99* r r 81r 41 15r 4t 94* 1t t 2I* 7* 72+ I r Pk toeal I r4r7 HighesE 8:45 8: 8:45 I Oer+S volume l o Hi lotal I 4oe PHF.93.se I.87 S FEDERAL HIGHWAY 11 2, , ,364 4 SE 9TH STREET 58 L l -.-:'t::- ALL VEHICL 22 ' t' I l" t- 15 Intersection l l tl I J l- 3 ' e2? o?o I vjv 'I Otal. 2I 2I 1,9 +t I 2L SE 9TH STREET - 2,324 /b 2rll- s8 2,42I 58 L]-LL a -46 L I JJv ', --] S FEDERAL HIGHWAY
39 SE 9TH STREET & S FEDERAL HIGHWAY HALLANDALE BEACH, FLORIDA COTNTED BY: A. GONZALEZ & A. PAI,OMINO SIGNAI,I ZED ay.f ;- a,,rrral, cha-i:l ictsc Tn. 85 SE 4th Avenue, Unit 19 nel rav Beach. Fl ori da Phone (561) ALL VEHICLES Sit.e Code : slart DaEe: :/28/L5 File I.D. : 9STR_US1 Page : 3 S FEDERAL HIGHWAY From Nort.h I CF OTU <TPFFT I Fr^m tr.ets I S FEDERAL HIGHWAY I rrom sourn i From West I I UTurn Left Thru Right i UTurn Left Thru Right. I UTurn Left Thru Right. I UTurn Left Thru Right I ToEal DaEe LO/28/ Peak Hour Analysis By Entire Int.erseceion for the Period: 16: t.o 18:OO on LO/28/I5 Peak seare 16: 16: volume 34 L L3 PercenE t 2* 971 lc t '12* 7\ Pk ror.al L76'7 I 187 HighesE 16:3 te, +S volume Hi t.ot.at PHF : 39 L t 1t 2t 96t 1t 2e I te, ts I s7s ' e1 S FEDERAL HIGHWAY I!6:! t 24* 1? 66* 5 I6: 22\ L2 r,72 35 I2 SE 9TH STREET 6L 13 L2 L2 B6 --l lr I ALL VEHICL L I tl 33 'l I- 5 Intersection l l I 1,2 35 I 1-,72 '1 '7A1 Lt 'v' 'l 4 ' e4 JtJrv L,72 33 o-l 2,49 'IOtal- 2, r '7r 5 3l- SE 9TH STREET S FEDERAL HIGHW
40 SE 9TH STREET & S FEDERAL HIGHWAY HALLANDALE BEACH, FLORIDA COUNTED BY: A. GONZALEZ & A. PALOMINO SIGNALIZED Tr:ffi. srrrl'al, sna.i^licts< Tn. 85 SE 4th Avenue, Unit 19 npl rav PFA.h Fl.ri da Phone (551) PEDESTRIANS & BIKES Site Code : Start. Dat.e: l/28/1-s File I.D. : 9STR_USl Page : 1 S FEDERA], HIGHWAY From North I cf ofu QTDFFT tl I rrom Easr I S FEDERAL HIGHWAY I rrom sourn I cf ofu CTDFFT From West Left BrKES Right Peds I Left BrKES Rlght Peds I Left BrKES Right. Peds LefL BIKES Riqht Peds '1taa DaEe Io/28/Is : 1 7:15 7:3 O7t45 O O O 1 Hilr'o caf u r 8; 8:15 8:3 ol 1l 2l 4l ol l l o o l o o o o ol o o o o o o l 1 o o o o o ol o o l l o o ol o o o l 1 l l o o o ol o l o o ol l o o o ol l l 8:45 l l 1 2l Hr Total ol ol 1 l 2l * BREAK 16 r l5:15 L6:3 L6:45 Hr Total 1 1 l 1l ol o o ol o o ol o o ol ol 1 l 1 1 l l i l o l 1 o l 11 L7: ol ol L7:15 ol o 1l o o l L7:3 o 2l 2l o o ol L l l 1 t 11 HrTotal 3l 1l 13 o 1l ol 1l ol *TOTAL* 8l 1l 3l
41 NE 215TH STREET & DIXIE HIGHWAY HALLANDALE BEACH, FLORIDA COUNTED BY: ANGET, T,OPEZ SIGNALI ZED Tr:ffin qrrr\ra\r Cna.i^l ietse Tn. 85 SE 4th Avenue, Unit 19 nfl?^v P^a.h F'l6rida Phone (561) ALL VEHICLES Site Code : SEarE Date: I/28/f5 FilE I.D. I COUNDIXI Page : 1 DIXIE HIGHWAY From North n-tsa 1nl?e/1q --- INE ZrJln JTKEEI!rom Easr ll I DIXIE HIGHWAY I t rom soue.n INE 215TH STREET From West UTurn Left. Thru Right I UTurn Left. Thru Right I UTurn Left Thru Right UTurn Lefc Thru Righc Total 7: 4 32 I 7: : A7 t45 O ).4 I Hr Total r 8:15 8:3 o 88 se L L o '73 3s L 87 l cq I 235 s82r o1723 8:45 O o 16 r7 Hr Tot.al O 41 L94 78 o ol ol ol 3 65 o 2 ' e 1ss I zet s:+ r ol o 8 o L I I e3s 42r 4r o o42 16: :15 ss 39 t7 7 7t- 2 16: o :45 s O 2 83 l s l Hr Total O 25 r ol o 22 o 2s2l oi ol l 3L o 1,7r e I 12s8 17: o s2) :15 o 42 s :3 o 't:45 O o I 55 2 Hr ToLal O 2O3 23L l ,47 *TOTAL* to27 2a
42 NE 215TH STREET & DIXIE HIGHWAY HALI,ANDALE BEACH, FLORIDA COI,NTED BY: ANGEL LOPEZ SIGNALI ZED Tr:ffia qrrrrrav q^a.i.liatsa Tn. 85 SE 4th Avenue, Unit 19 ntrl r:v Ftoa.h Fl dri.la Phone (561) ALL VEHICLES Sit.e Code : St.art DaLer IO/28/15 File I.D. : COUNDIXI Page : 2 DIXIE HIGHWAY From North tvf^.-hrr^hhnn6 II\E ZIfIN JfKEEI I rrom Easc I DIXIE HIGHWAY from 5ucn I lrf t 1 qru ctdfft! rom wesr UTurn Left. Thru Right I uturn Left Thru Right I UTurn LefE Thru Right I uturn Left. Thru Right I ToEal DaEe LO/28/ Peak Hour Analysi-s By Entire IntersecEion for the Period: 7: to 9: on f/28/l5 Peak srar! 8: i 8 : volume O r Percent t 6t 29* 12t * 53t 47* Pk total Highesr 8 :45 Oe ' ls Volume Hi total 184 I ee PHF I DIXIE HIGHWAY l I 8: l 8 o 297 r i * 3* r e7\ 3os 8:3 ol o 2 o e I 8: g * 9't* 3t 388 8: L94 41 n 78 L94 4L NE 2IsTH STREET I 119 Id 376 T L2 rl 673 lo. ALL VEHTCLES 2sr 1re 'le tl llr32 I se3 L,32s I'rr_ r-r- o /5 'l 388 InLersection Total 41, I L,6!7 - r, lll2e7 lllzgt ttl l- I L32 L94 L ?nq,l ll 29 L L32 NE 2lsTH STREET DTXIE HIGHWAY
43 NE 215TH STREET & DIXIE HIGHWAY IALI,ANDALE BEACH, FLORIDA COUNTED BY: ANGEL LOPEZ SIENALIZED Traffic Survey Speclalists, Inc 85 SE 4Eh Avenue, Unit. 19 nplrrw PFA.h Fl.rida Phone (551) ALL VEHICLES site code : Start DaEe: L/28/L5 File LD. : COUNDIXI Page : 3 DIXIE HIGHWAY From North INE 215TH STREET I trom Easc I DIXIE HIGHWAY I FY^m c^rrih I \tf 1 <TU CTDiFf ' From WesE I t-l:furn Left Thru Right I UTurn Left Thru Rj.ght. I UTurn Left. Thru Right UTurn Left Thru Right DaEe r/28/r5 - Peak Hour Analysis By Entire InEersecEion for Lhe Period: 16: to 18: on L/28/I5 Peak seare 17: 17, Volume 23 23]- 7! Percent t 4t 46* 14* i ot 24* 76t ot Pk Eotal 55 4ss Highest I'l :3Q I 1z:45 Volume lo2'79'7 Hi hotal 145 I L24 9 PHF.87.e2.85 i 17: llt r 89r 311 L?: : g 199 'J,7 : t t 5t '[otal DIXIE HIGHWAY 77 z3l 23 n NE 215TH STREET L 45 7I 23r 23 ful 'l 5Os T O l. ALL VEHTCLES ss 344 tl rrr_ I ' ' 111,ne 1,124 r-rr I'lt_ 19 II 19 L99 Intersection Total 23, I r, r9 276 r l ttl I I 11 23,ll 1ll,ll ;tl 35 "tl DIXTE HIGHWAY?11,I ub 215TH street
44 NE 215TH STREET & DIXIE HIGHWAY }IALI,ANDALE BEACH, FLORIDA COITNTED BY: ANGEL LOPEZ SIGNALIZED TrrFfi- el111161, q^o.i:l icie Tn. 85 SE 4th Avenue, Unit 19 nelraw Rea.h F1^rida Phone (561) PEDESTRIANS & BIKES Site Code r starl Date: l/28/15 File I.D. : COIINDIXI Page : I DIXIE HIGHWAY From North INE 215TH STREET r rom Easr I IDIXIE HIGHWAY I Fr^m q^t,fh INE 215TH STREET I From west DaEe r/2a/r5. I I Left BrKES Rj.ght peds I Left BrKEs Right Peds I Left. BrKEs Right Peds I Lett BrKEs Right Peds I I Tot.al O7: 7:15 7:3 :45 Hr Total 8: 8:15 8:3 O8:45 O O 1 I 1 Hr Total 2l l 2 2 4l ol 1l ol 2 1 ol ol ol o o oj o o o ol o l o 1 l o ol o o o 1l o 1 o 1l l l 1l 1l 1 2 l I * BREAK * 15: 15: :3 1l 1l 1l 1 15:45 o O O 1 O 1 Hr Total 17: 17: l-5 17r3 l l ol ol ol 1l o 2 o l ol o o o ol o o o ol o o o ol o o o 1l ol o 2 o ol o o o Hilro ta r 1i l ol 1l ol ol l l o ol l l o 1l 1l ol l I L *TOTALT 1 I l 1l 6l 3
45 NE 215TH STREET & SE 1ST AVENUE ITALI,ANDALE BEACH, FLORIDA COUNTED BY: ADAM,IOHNSON S IGNALl ZED arrffi- e,,rrra1, cna-i:l iatsc Tn. 85 SE 4t.h Avenue, Unit 19 nflrar/ Pa^.h I'lnridS Phone (561) ALL VEHICLES Site Code : Start Date: 1./28/L5 File I.D. : 215S_1AV Page : 1 SE 1ST AVENUE From NorEh INE 215TH STREET I rrom Easc I se 1ST AVENUE I trr^m c^rrtsh INE 215TH STREET From West UTurn Left Thru Right UTurn Left Thru Right I UTurn Left Thru RighE I UTurn Left Thru Right I Total Dat.e 1/28l : 7:15 7:3 15 2L l ol o e e l ol 35 2 o?t45 o 2 23 I O O O Ol O l Hr Total? 61 I 9659 ol ol ol ol ol ol ol ol o : el 375 8:1,5 r r-s8 1 I 39 8: :45 O 7 f6 l 2 22 l? s5 Hr Tot.al 4s r22l ol I * BREAK 16: o o 26 o o o ol 6354 ol 1 16: o o o ol 84 4'7 ol 16:3 o o s 22 o o ol 6844 ol 1 16: l 82 7r Hr Total 1 14 l ol 17: : s I 3 4 ol o o o ol o o o ol ol ol l ol 73 9 o ? r7 8 o L I 71 l 17t41 O O 1 i7 o o o ol o R? so o I o 11 6q I Hr ToLal I 14sl l ol 48 o *TOTAL* ol ol 12\6 r7r
46 NE 215TH STREET & SE 1ST AVENUE T{ALLANDALE BEACH, FLORIDA COTNTED BY: ADAM.IOHNSON SIGNALI ZED rr:f f i n q,lyrra\/ qha^ial r uur v s, upuers ^Fd 85 SE 4th Avenue, Unit 19 DFlr^v RFaeh. Florida Phone (551) ALL VEHICLES slte code : stare Date: r/28/15 File I.D. : 215S_1AV Page : 2 SE 1ST AVENUE From North INE 215TH STREET I From East I se 1s" AVENUE!rom souen INE 215TH STREET l From tlest. I UTurn Lefr Thru Right I UTurn Left Thru Right, UTurn Left Thru Right UTurn LefC Thru Rj.ght Date Il28l peak Hour Analysfs By Enti.re InLersection for the Period: 7: to 9: on 1/28/f5 Peak start 8r 8: I osroo 8: Volume o ol o 133 e8 o 341 Percent t t 27$ 73\ t t ot t I * s8t 42+ t t 32* t 68t Pk EoCal ] L L7 7 Highest 8:?: 8:1s 8:45 volume Hi. toral r PHF.7O SE 1ST AVENUE I I ToLal L NE 215TH STREET r33 LZZ 255 'l l_o / ALL 55 VEHICLES 34L 341 1_,332 ll ,77 fnlersectlon Total 1 41q -t -'r r,r L NE 215TH STREET SE 15 AVENUE
47 NE 215TH STREET & SE 1ST AVENUE HAIJI'ANDALE BEACH, FLORIDA COTNTED BY: ADAM JOHNSON SIGNALI ZED Traffic Survey Specialists, Inc 85 SE 4th Avenue, Unit. 19 Delray Beach, Florida Phone (561) ALL VEHICLES Site Code : start DaEe: 1/28/L5 File I.D. : 215S_1AV Page : 3 SE 1ST AVENUE From North INE 21sTH STREET trr^m F>cf I se lst AVENUE!rom soucn INE 215TH STREET I From west Lrlurn Left I I Thru Righr I uturn Left. Thru Righr I uturn Left I Thru Right I uturn Left Thru Right DaEe LO/28/15 - Peak Hour Analysi-s By EnEire InEersectj.on for the Period: 16:OO Eo 18:oo on Io/28/15 Peak seart 17r I rz oo ' 1?: oo Volume I 1451 o o 315 2s8 o Percent ot t 5t 95t t or ot ot I ot s5t 4sr o$ 573 Pk total 153 HighesE 17:3 Volume 3 Hi EoLal 43 PHF.89 lo I 7: oo 4 lo.o 17, s6.e2 SE 1ST AVENUE 17: t 673 l7 : s 51t t 39& I1 NE 215TH STREET 31s L n.tr 265 L45 L45 --_l lr I 'rr- I5J ll:' 'l 81e ALL VEHTCLES rl rl t,133 L 673 ir'ttersection Total I tl ll t- I tl ll. L'3ee s ^-9tl zorll tl s tl tl SE 1ST AVENUE I I o o NE 21sTH STREET n
48 NE 215TH STREET & SE 1ST AVENUE HALLANDALE BEACH, FLORIDA COUNTED BY: ADAM JOHNSON SIGNALIZED Traffic Survey Specialists, Inc. 85 SE 4th Avenue, Unit 19 nclrav Fteach. Florida Phone (561) PEDESTRIANS & BIKES slte code : Start. Dat.e: l/28/15 Flle I.D. : 215S_LAV Page : 1 SE 1ST AVENUE From North DaEe r)/28/r5 - INE 215TH STREET I rrom Easr I SE 1ST AVENUE l! rom 5ouE.n INE 215TH STREET I trom west lll Left BrKEs Right. peds I l,eft BrKEs Right peds I Lefc BrKEs Rlght. Peds I Left BrKEs Right Peds 7: 7: L 2 o't:45 1 t l Hr Total 3l ol ol ol l 8; o o o ol o o o ol o o o ol 8:15 o o o ol o o o ol o o o ol 8:3 o o o ol o o o 1l o o l 8145 O O O 1 l o o l l Hr Tot.al 1l l o o o 1l o o ol l ol TotaI I 3 L : 1 o l o ol 15:15 o o o ol o o o ol 16:3 o o o ol o o o ol 16:45 O l l l HrTotal rl ol o o l l 1 *TOTAL* cl ol 1l l
49 NE 213TH STREET & US1/BISCAYNE BOULEVARD }ALLANDALE BEACH, FLORIDA COITNTED BY: C. PALOMINO & M. CRUZ SIGNALIZED Traffic survey specialists, Inc 85 SE 4th Avenue, Unit 19 nplraw FIFA.h Fl6rida Phone (561) ALL VEHICLES sit.e code : StarE Date: 1/28/1-5 File I.D. : 213S_US1 Page : 1 US I/BISCAYNE BLVD From North lt\e ztjtn JtKEEI tl UTurn Left. Thru Right I UTurn Left. Thru Rj.ght 1 UTurn Left. Thru Right UTurn Left. Thru Right DaEe ro/28/75 I I,rom EasE. lus l/brscayne BLVD I from uoutn t----- I From west 'rotat 2r : 7:15 7: Hr Total ol ol ol ol '7I 4r ql ro I 74 1 I I o r9'7 23 l o I r r ol er-e 1 8: l o 147 8: s1 17 l l o 7192 o8: l l Hr Total l 1, 29 4L5l I2T3 r2s I T BREAK *. 16: rb: tf 4774r :3 2A o :45 I 73 3' sl 1 o o o o o I rreg Hr Tot.al 3 3I2 ]-632 o 236 o O 2O2s!47 l 4732 ol ol ol ol 17: 17:15 1-7r !7t I o I t2r Hr Total l 191 5ZL I 297 r-3e I 4619 *TOTAL* ol 824 1??7 635 ol L6297
50 NE 213TH STREET & US1/BISCAYNE BOULEVARD HALI,ANDALE BEACH, FLORIDA COIjNTED BY: C. PALOMINO & M. CRUZ SIGNA],IZED Tr>ffin q,,rvav q^..ial i ^F^ 85 SE 4Lh Avenue, Unlt. 19 nflr^v RFe.h Florida Phone (561) AT,]. VEHICI,ES sile code ; slart Date: 1/28/15 File I.D. : 213S_US1 Page : 2 US I/BISCAYNE BLVD From North I NE ZrJln DTKEEI lus 1/BrscAYNE BLVD I from sourn t----- rom wesf, Highest. 8:3 VOIUMC U IUU Hi. total 674 PI{F.87 I Lrrurn Left Thru Right I LrTurn Left. Thru Right I UTurn Left Thru Right. I UTurn LefE Thru Right I Total Date 1/28l15 Peak Hour Analysis By Ent.ire fneersect.ion for Ehe Period: 7r to 9r on IO/28/I5 Peak slart 8r I og, oo I ob, oo 8 r volume l12oe o 416 o Percent t l-5* 84t t I or 33r r 66r r t 91* 9* t t t t Pk EoEal 2352.^. 133s I 8:4s oe:+s e2 US 1/BISCAYNE BLVD I I 126l e1 I 7;. 366 n r,2r3 4r6 1 a< 366 L,629 2,5)z '. 1-n ' "? ool rl ll2t rl '1626 I' I Jr2o J t -vr. ALL VEHTCLES -J I 4r-6 4]-6 1,11' 2L I'rr_ rl Intersection Total :ee I 4,316-49t lllr2s t- I r l I _ a Er A _ I J JJ= ll NE 213TH STREET ztj.b 4L6 21oll. l'r,2r qq6 U US 7/BISCAYNE BL L,273
51 NE 213TH STREET & US]./BISCAYNE BOULEVARD HAI.,LANDALE BEACH, FLORIDA COTNTED BY: C. PALOMINO & M' CRUZ SIGNALI ZED Traffic survey Special-tscs, Inc 85 SE 4th Avenue, Uni! 19 nflrav Rcaeh. Florida Phone (561) ALL VEHICLES Slte Code : stare Dace; L/28/15 Fi.1e I.D. : 213S_US1 Page : 3 us r-ibiscayne BLID From North INE 213TH STREET trr^m F:at lus 1/BTSCAYNE BLVD I From South t----- From West: Peak seare 16: vorume 3 5 lz PercenL t 16t Pk t.otal 1947 HighesE 16:3 Volume 2 a6 Hi total 511 pi{f.95 I : l t * t 39t t 61 I re es ' 423 ol o 68 o 163 I.e4 I U:furn Left. Thru Right I UTurn Lefr Thru RighE I UTurn Left. Thru Righc I UTurn Left Thru Right I Tot.a1 Date 1/28l peak Hour Analysis By Entire InEersecti-on for the Peri-od: 15: to 18: on 1o/28/15 16: oo 3?41 3 2O2s r4'1 61* I t ot 93t 7\ 2L'7 5 16, ss331 I <aq I q? US 1/BISCAYNE BL I l-6: * t 7:. t r L, U 2, r, , l =tr'!o t I --1 -ftllrvciflr-\-!.trrd ALL VEHTCLES r- - F; 4,43 5 t NE 213TH STREET L47 I, r,olz t I Intersection Tota1 4,'732 tl J-^^A? L,632 1, g6g 2,25 2,25 TTq 1 /RTq AYNE BLVD
52 NE 213TH STREET & USI/BISCAYNE BOULEVARD HALI,ANDALE BEACH, FLORIDA COUNTED BY: C. PALOMINO & M. CRUZ SIGNALI ZED TY:ffi. uur c,ryrra\r v ul cha-ial: upusru --^ 85 SE 4E.h Avenue, Unlt. 19 Delrarr Reanh Fl^rida Phone (561) PEDESTRIANS & BIKES si.te code : Starc Date: I/28/L5 File LD. :213S_US1 Page : 1 US 1/BISCAYNE BLVD From North INE 213TH STREET lus l/brscayne BLVD I From South t----- I r rom wesr I From East lll Lerr BIKES Rlght. peds I Lefr BIKES Rlghr Peds I LefL BIKES Right. Peds I Left BIKES RighL Peds ToEal 7: 7:15 7:3 r4 Hr ToEal 8: 8:15 8: o 3 1l o o ol 4l 1.1 1i ol l 1l o 2 o ol o o o o o ol o o o s l o 8:45 1 l 1l 2 5 Hr Total 1 1l rl 4l 2L 1l ol ol l I 3 1 ol ol 2l 1l 1l r. I 11 I, : 16: :3 16:45 O Hr Totsal 1 ol 4l 3l 1l el ol 2l 1l 3l o o o ol o o o ol o l l o22 o o o ol l l 6l o o o ol 2 2l 17: ol ol ol o 2 i 2 17:15 l I I 2l ol 1l 5 17:3 ol ol o o l I7t45 I i 1 1 4l o l 111 Hr Tot.al 1l 6l ol 3 o 2l I *TOTALT l I2 12 1
53 NE 214TH TERRACE & SE 3RD AVENUE TALI,ANDALE BEACH, FLORIDA COT'NTED BY: MARISA CRUZ NOT SIGNALIZED Traffic Survey Specialists, Inc 85 SE 4Eh Avenue, Unit. 19 nplr^v RPaeh Flnrida Phone (551) AL! VENILIED Site Code : StarE Date: I/29/15 FiIe LD. :214T_3AV Page : 1 SE 3RD AVENUE From NorEh INE 214TH TERRACE I From EasE t---- I From South INE 214TH TERRACE I From wese I I UTurn Left Thru Right I UTurn Lefb Thru Rlght I UTurn DaEe l/29/l I Thru Right. I uturn Left Thru Right 1t41 7: 7:15?:3 1 7t45 Q O O O I O O O O I O O O o 1 I 1 HrToEal ol o ol o 4 l 4 8: 1 8: l-5 O 2 8:3 4 o l o l 11 1 ol 1 ol o o o 3 11 l l l 2 1 a:45 o 14 O O I O O O O I O O o 1 I Hr Toral O 2L rl s 11 l 126 ol I ol ol ol I7 24 >l 16: to: f ) 16:3 15: I I Hr Total 14 I L 7 2 ol l 2l 6l l 1 1 o o ol 1?: 1 11 I :15 3 l 2 el 1"4 17: o l 1 42 L7:45 O O 2 I o 8 13 l 3 26 HrTotal 3 3l o l l ol l ol 1 d TTOTAL* 8l?8 ol 1,
54 NE 214TH TERRACE & SE 3RD AVENUE }IALLANDALE BEACH, FLORIDA COUNTED BY: MARISA CRUZ NOT SIGNALIZED Traffic Survey Specjalists, Inc. 85 SE 4Eh Avenue, Unit 19 npl raw RFe.h F l.ri da Phone (s61) ALL VEHICLES Site Code : seare Date: I/29/15 Fi.le I.D. : 214T_3AV Page : 2 SE 3RD AVENUE From NorEh INE 214TH TERRACE I rrom Easr t----- I From south Peak Hour Anatysls By Entire IntersecEion for the Period: 7: to 9: on Io/29/15 Peak stare 8: 8: I obroo volume o 2L 1l o 5 1l o o o PercenE t 95$ o$ s*l r ot 83r 17t t t t * Pk total 22 l6 l Highest. 8 :45 I ob,3o i 7: Volume Hi- total 14 )4 l PI{F.39 I.38 I.o INE 214TH TERRACE From West: lll uturn Letr Thru Rj-ghr I uturn LefE Thru Right I uturn Left Thru Right I uturn LefE. Thru Right I Total DaEe r/29/ SE 3RD AVENUE 8: $ 27 8 : r26 4t 96t t 2L t 1 2L 22 NE 214TH TERRACE 5 I zo 26
55 NE 214TH TERRACE & SE 3RD AVENUE IIALLAI"DALE BEACH, FLORIDA COUNTED BY: MARISA CRUZ NOT SIGNALIZED Traffic Survey specralists, Inc. 85 SE 4th Avenue, Unit 19 DFIrav Reach. Florida Phone (551) ALL VEHICLES si.le code : SEart Date: I/29/15 File I.D. ; 214T_3AV Page : 3 SE 3RD AVENUE From NorEh JNE 214TH TERRACE I From EasE t----- I From soulh INE 214TH TERRACE I From west I I llllurn Le f t I Thru Rlght I UTurn Left Thru DaEe 1/29/ ' Peak Hour Analysis By Entire fnlersection for Lhe Period: Peak seart 17: I 17: volume33122 Percent t 5t t 58 t $ 26* PkEoLal 6 8s HighesE 1?:15 17:3 volume O 3 l 11 Hihotal 3 4). Pr{F.5 I.s2 I R i ohr I lltrrrn Lef f. Thru 16: to 18: on I/29/75 17: 63 o?4r r t lo I 7: oo 3 o o io I. t I Right I uturn Left Thru Right 17: l 1 r 11r le 17r l 1 ls I.45 44* 44* I I I ol rl I I l I ToEal SE 3RD AVENUE NE 2I4TH n v zz ^^ 3 TERRACE 25 lrrl ll 6l I 34 e2 I'rr_ 9 rnrersecrion Toral llootti I ll lo tll r- I T I" 'Al-rl-, v.crnl\-l-r-cjd, -t ALL VEHTCLES I ll8s22 tl --r r lo -. u NE 2T4TH TERRACE -
56 NE 214TH TERRACE & SE 3RD AVENUE HALLANDALE BEACH, FLORIDA COTNTED BY: MARISA CRUZ NOT SIGNALIZED Tr:ffi a et,r\rav q^a^i al i ara Tn. 85 SE 4th Avenue, Unit 19 nfl rav Flce.h Fl ori da Phone (561) PEDESTR]ANS & BIKES SiEe Code : cf.-ts n:tsa. 1 n /29 /1q Fi.le r.d. : 214T_3AV Page : 1 SE 3RD AVENUE From North Left BIKES Rj-ght Peds DaEe 1/29/ l----- INE 214TH TERRACE NE 21.4TH TERRACE From EasE I From SouLh I From West ll LerE BrKES Right Peds I Left BrKES Right. Peds I Left BrKEs Rj-ght Peds Total 7: loo 7:15 loo 7:3 loooo o7:45 O o 3 o o o o I o o o o I o l HrTotaI 3l o l o o ol o ol 3 * BREAK * : o o l 16:15 1 o o o ol 15:3 1 o o o ol o o I o o o l l Hr Total 2 o l l o o o ol ol ol 2l 17: 17:15 I 17:3 17:4\ O 1 i o l l Hr Total 3l ol ol l ol ol ol ol ol ol ol ol l I 1 1 t- *TOTAL* 8l ol ol ol
57 1 OPTIMA OFFICE DRIVEWAY & US 1 IIALLANDALE BEACH, FLORIDA COUNTED BY r ADAlvl,JOHNSON DRIVEWAY VOLITV1ES ONLY stare I us1 I From North Tr:ffia errrlrflr qna-ialiqrq Tn. 524 Gardeni-a Terrace Delray Beach, Florida Phone (561) TURNS ONLY ]optima office DRIVEWAY IUS 1 From East 1 I From South t----'! rom wese. Study Name: OPTDWUS1 site code : seart Date: 1A/29/15 Page : I Time I UTurn Left. I Thru RiqhEl Lrlfurn LefE I Thru Rightl UTurn Left I Thru Riqhtl UTurn Left Thru Riqhtl Total L/29/1,5 I 7:1 1l 7:15 o 2l 7:31 2l o?:451 5l HOUr I 11 Ud: UU I I I o 81 o o 71 I ol nl ol l l I ol ol l l l I o o l o o ol o I l r. l 1 3 ^l 2 l uo: tl I e 8:3 1ol ol o o ol o o 1 8:451 o 131 O l o o ol 3l 15 HOUr I ol >l l I l 2l I I I I I lo: rt 1 16:3 J Hour J ol o o o ol o ol o o o l o o ol o o o l o o l i l 1l 2 8 o o o ol o o l o o o1 o o rl o o l l l 14 I I t?.tql I7.?n l L7:451 Hour l o I o o 31 ol 13 1 o ol i ol ol ol I ol wl ol 1 l L2l 16 r e l s2 Toral l & Ahr t Int. l l o 611-1oo. o I I I ol -l 'l i ^l -l -l oo. o I 4e.71
58 o NE 214TH TERRACE & OPTIMA GARAGE DRIVE WAY, HALI,ANDALE BEACH, FLORIDA COUNTED BYI CRISTINA PALOMINO NOT SIGNALIZED TraIfic Survey Specia]isLs, Inc 85 SE 4th Avenue, Unit 19 Delrav BPach. Florida Phone (561) ALL VEHIC],ES SiEe Code : St.art DaEe: l/29/15 Fi.1e I.D. r 214T_DWY Page : 1 OPTIMA GARAGE DRIVEWAY From North INE 214TH TERRACE I From East. t----- I From SouEh INE 2t4TH TERRACE From West lll UTurn Lefr Thru Right I UTurn Left Thru Right. UTurn LefC Thru RighE I UTurn LefE Thru Right DaEe Io/29/I5 -- TotaL 71 7: :3 1 7:45 3 o o I o o o o I o o o o I o 1 o Hr ToEaI 3 l l ol 81 8:15 8:3 ol ol 1 1l o ol o 3 3 ol ol 1 l o ol o 5 o oj o 1l 3 1l o ol I 4 l o8:45 l l o ol 21 3 l Hr Tot.al 1l 2l l * BREAK 16: 3 O : t5:3 A :45 O O O I I l Hr Total ol 1 17; r /: a5 17:3 lo rn I -vl ql 18 Hr Tot.al 76 1l o 2 3 ol ol ol ol ol oi l ol 1 1 L 2 ol l o l 3 ol l 3 o l o o 1 o ), l o o ol o o ol o 7 l I6 lo *TOTALT to2 3l ol l L97
59 NE 214TH TERRACE & OPTIMA GARAGE DRIVE WAY, TALI,ANDALE BEACH, FLORIDA COT,NTED BY: CRISTINA PAI,OMINO NOT SIGNAI,IZED OPTIMA GARAGE DR From North IVEWAY INE 214TH TERRACE I From East Traffic Survey SPeciallsts, lnc 85 SE 4Ch Avenue, UniL 19 nplrav RFa.h Florida Phone (561) ALL VEHICLES t'-- I From soulh INE 214TH TERRACE ] From l,lest srte uooe : uuf5uzl) SLart DaEe: r/29/15 File I.D. : 2I4T_DWY Page : 2 I UTurn LefE I Thru Rlght I uturn Left Thru Right. I uturn Left Thru Right I uturn LefE Thru Right ToLal DaEe 7/29/Ls peak Hour Analysis By Entire InEersection for the Period: 7r to 9: on 7/29/15 Peak seart 8: 8, oo 8: I o8: oo Volume l 37 1 Percent ot ot t 1* I g t 7rt 29* t t t & t 79* 2L* t Pk t.ota] Highest 8:3 7: I oe, as Volume 2)- Hi total 1 Fn!. z) l7 8:3 11 l4.44. OPTIMA GARAGE DRIVEWAY I l 124 I.4e 3'7 n 2 NE 2L4TH 5l U q I 1n TERRACE 3' lr2. ALL VEHTCLES llis -l ll',' '.o lurli[o I L: 47 r"tersection Total 55 l1l-o - 'l ll.n 39 lo _---_r
60 NE 214TH TERRACE & OPTIMA GARAGE DRIVE WAY, }IALLANDALE BEACH, FLORIDA COUNTED BY: CRISTINA PALOMINO NOT SIGNAI,IZED a+'ff:r cil^'av c^a.ial ictq Tn. 85 SE 4th Avenue, UniL 19 nclrav Beach. Florida Phone (561) ALL VEHICLES site code : SEarL Date: I/29/15 File I.D. : 2I-4T_DWY Page : 3 OPT]MA GARAGE DRIVEWAY From NorEh INE 214TH TERRACE I From East l----- I From soueh INE 214TH TERRACE!rom wesc I uturn Lefr Thru Right I uturn Left Thru Right. I uturn Left Thru Right I uturn Left Thru Right DaEe a/29/ peak Hour Analysis By Entire IntersecEion for the Period: 16: t.o 18: on I/29/15 Peak seare 1?: 17: Volume 1 76 o 81 Percenr ot 1& ot 99+ t t 89t Pk tolal 77 le 1t g Highest 17:3 I r7 t4s Volume 1 o 39 o o 3 Hi tota] 4 14 PHF.48 I,to I 17: t t t 7: I 17: l '7 o r t t 1t * l7 12: oo 13 l 3 o..58 '1tal OPTIMA GARAGE DRIVEWAY n n 1 NE 214TH 8 76 TERRACE 84 lr t6 -al II lle ls11?l 'l.n 78 - ALL vehrcles r--l -l7 Intersection Total I l---l _J r e3 rl L- o r t 1 8 NE 2I4TH TERRACE n
61 NE 214TH TERRACE & OPTIMA GARAGE DRIVE WAY, HALI,ANDALE BEACH, FLORIDA COIINTED BY: CRISTINA PALOMINO NOT SIGNALIZED Traffic Survey specialists, Inc. 85 SE 4th Avenue, Unit 19 nf l rev Rcaeh Fl ori.ia Phone (561) PEDESTRIANS & BIKES sice code : Start Date: L/29/f5 File I.D. : 214T DWI Page OPTIMA GARAGE DRIVEWAY From North INE 214TH TERRACE I From East t-----!rom uourn INE 214TH TERRACE I l.rom wesr I I Left BIKES Right peds I Left BIKES RighE Peds I LefE BIKES Right Peds ] Left BrKEs Rigtrt Peds I ToEal DaEe r/29/75 I 7: o o ol 7:15 o o o l o 7:3 o ol o O7245 o o o :tl o o o ol o o o ol o o l Hr aotaf o 31 o ol o o o l o l 3 16: 15: :3 1 15:45 l l HrToEal 2l ol o o ol 17: 17;15 17:3 l7 :45 1 ol 1l 2l 1l ol l ol o l o o l o o o l o t Hr Total 1 41 o ol o o ol ol ol oj l o ol ol ol l ol ol ol ol l I 1 *TOTALT el ol ol ol
62 NE 214TH TERRACE & OPTIMA GARAGE DRIVE WAY, }IALLANDALE BEACH, FLORIDA COUNTED BY: CRISTINA PALOMINO NOT SIGNALIZED IOPTIMA I Fr^m N^rtsh GARAGE DRIVEWAY INE Traffic Survey Special.ists, Inc 524 Gardenia Terrace nfl Y:\/ RFA.h Fl nrr da Phone (561) 2' DROP OFF LOOP 214TH TERRACE t----- I. rom East From South Start I I Tjme]UTurnLeftThruRiqhtUTurnLefcThruRiqht UTurnLeftThruR1qhtiUTurn@ r/29/l5 INE 214TH TERRACE I From west I St.udy Name: 214T_DWY Site Code : start Date: Lo/29/15 Page : l- Intvl Totall t Apr. I t lnl. I ol o -l I o o o o ol -rl I l -l
63 SE 3RD STREET & DIXIE HIGHWAY }IALI,ANDA],E BEACH, FLORIDA COI,NTED BY: SEBASTIAN SALVO SIGNALIZED Traffic Survey spec.ialises, rnc 85 SE 4th Avenue, Unit 19 nflrav Reach. Florida Phone (561) ALL VEHICLES Si-Ee Code : Start Date: L/29/75 Fi-Le I.D. : 3ST_DIXI Page : 1 DIXIE HIGHWAY From North I CF 1DN qtpfft l t rom Easc I DIxIE HIGHWAY From South I cf 1Dn cfpfft trram Wpqt UTurn Left l Thru Right I UTurn LefE Thru Right UTurn Left Thru Right I UTurn Left Thru Right I Tota1 7: 7: l-5 7: l ol l 2L o'r:45 o o ol O O O Ol Hr Total l o3298 l ol ]-44 8: 8:15 8:3 68I452, sl o L ol ol ol o8:45 O A 2 o '7 25 l Hr Total r23 ol l l ol ol ol o qq ol l 37! : 15:15 L6r45 Hr Total 17: 17:15 17:3 1'7 : r rl L2 r ? r32 52 L23 1l 1l 3l 4l L1 LO l l L L9 7I 5 'tl ol o o l r ol ol ol l l l l OI l l 45 1 Hr aotat el ol l ,1, r *TOTAL* s I ol ol
64 SE 3RD STREET & DIXIE HIGHWAY }IALLANDALE BEACH, FLORIDA COUNTED BY: SEBASTIAN SALVO SIGNALIZED araffit crrrlrar/ sna.i:liefe Tr. 85 SE 4ch Avenue, Unit 19 nflraw RFa.h Flnrida Phone (561) ALL VEHICLES SiEe Code : start Date: L/29/15 File I.D. : 3ST_DIXI Page : 2 DIXIE HIGHWAY From North Fr^m Frat I oe,ts t5 DIX]E HIGHWAY IDIxIE HIGHWAY I Fr^m c^,,tsh 7: ol o o o o lo I. I CF?DN CTDFFT I from wesc tl UTurn Left. Thru Rjght I UTurn Left Thru Right I UTurn Left Thru Right I UTurn LefE Thru Right I Total DaEe 1/29/ peak Hour Analysis By Ent.ire IntersecLion for the Period: 7: to 9:OO on LO/29/L5 Peak start 8: 8: 8: 8: Volume r23 ol o o PercenE t 42* 56t 1r t r7* 83* r r or s t t * 97* 3t Pk total e lo Highest 8 :45 8:3 Volume Hi t.otal 32]. 83 PHF.8.8 l-5 5'7 9 ':ijo SE 3RD STREET l--' nro I L t vav r,o2g [ nv L l lr I -1 'fl!!venilied ALL VEHICLES [- [: llr4e rl I 266 fntersection Tota1 I L,443 ll I I L2 L r L L SE 3RD STREET L23 zo U 6L2 DIXIE H]GHWAY
65 SE 3RD STREET & DIXIE HIGHWAY TALLANDALE BEACH, FLORIDA COUNTED BY: SEBASTIAN SALVO SIGNA],IZED T.:fFi- q,,rrrfv qnf-i^l ieie In. 85 SE 4th Avenue, Unit 19 nal r^w Rcaeh Fl ori da Phone (s51) AI,I, VEHICLES slte code : SEart Date: l/29/15 File LD. : 3ST_DIXI Page : 3 DIXIE HIGHWAY From North UTurn Left Thru DaEe L/29/I5 --' Peak Hour Analysis BY Entire Peak start 17r Volume Percent S 31t 67* Pk total 64L Hj-ghesE 17:3 Volume 59 L32 Hi total I94 PHF.83 I SE 3RD STREET I From EasE I Rj-ght. I UTurn LefC Thru I UtAIE nlunwar I trom Soutn I RighC I UTurn Left Thru Intersec Eion for the Period: 16: to 18: on I/29/f5 17: 17: 9 s334 1t t 13t 87t t t t 393 lo 17:3 I ozroo 3 2t95 loo lo t I cf zpn qrpfft! rom wesr l Pi nhts ITT,rrn T,Ff ts Thru t 17: t : t I Di dht I T^t.l 1, t 15t 45 1 I l DIXIE HIGHWAY SE 3RD STREET nv q ]-25 z5 L25 z5 tr I I 4et 64r ALL VEHICLES I n"u vehr_c.rr.h;s t. I I48 Intersectj-on Total- tl l- j - 1,L z qnq Erl 7L8 t. --r t L SE 3RD STREET zvv L25 D]XIE HIGHWAY
66 SE 3RD STREET & DIXIE HIGHWAY IiALI,ANDALE BEACH, FLORIDA COUNTED BY: SEBASTIAN SALVO S IGNALI ZED Tr.ffi- c,,rl'ar/ qna.i>li<tse Tn. 85 SE 4th Avenue, Unit 19 nal rav RF^.h Flnri.la Phone (561) PEDESTRIANS & BIKES slte code : seart Dater r/29/15 File I.D. : 3ST_DIXI Page : 1 DIXIE HIGHWAY From North IJE JKU DIKEEr I trr^m Faets IDIXIE HIGHWAY l trom soucn CF ldn CTDFFT tll LefE BIKES Right Peds I Left BIKES Rj"ght Peds I LefC BIKES Right Peds I Left BIKES Right Peds DaEe r/29/rs : o o l o o O7r!5 o l?:3 o 1 o ol O O O O I O O O O 1 O o o 2l Hr Total l o ol ol 2l 8: 8:15 8:3 l l l l l l l l l 8:45 o o 2 o o o o o o o I o Hr ToEal 21 l o l ol ol ol ol 'totar * BREAK * 16: 16: :3 1 o o ol o o l l 15:45 I I O 2 I HrToLal O 2 l 17: 17:15 17:3 ol l l l 17t45 O O I t t- l l Hr Tot.a1 oi l 2 2l l l I ol 2l l 2 l 1l ol l 1l ol ol 2l 2 1 ) 1 I TTOTAL* 2l ol 4l sl
67 163 SE 3RD STREET & SE 1gT AVENUE HAI,I,ANDALE BEACH, FLORIDA COIJNTED BY: AMBER PALOMINO S]GNALIZED ar-+f:^ uur q,1r\ro\r ve1 qna.ir'l upuu: i^f - 85 SE 4t,h Avenue, UniC l-9 npl r^v RFe.h Fl ori da Phone (561) ALL VEHICLES Si-Le Code : Start Date: L/29/75 File I.D. : 3ST_1AVE Page : 1 SE 1ST AVENUE From North lll UTurn Left. Thru Right ] UTurn LefE Thru Rj-ght UTurn Left Thru Right. I UTurn Left. Thru Right DaEe Ia/29/L ' 7:?:15 7:3 lb! ol ol ol JKU DTKEEf I trom Easc I I se 1ST AVENUE I Fr^m q^,,rh I r.rom west "1:45 O O O O I 1 O 24 9 O o 8 95 o l Hr'toLat u l i3233 l 8: l 8:15 l 8:3 l 8: r I 11 re I Hr Total ol o l o23461 L I o L16 9 r37 L O2 7l ol ol ol l ol Total- 76 1L L s * BREAK *. 16: 16:15 15: O HrTotal 17: 17:l-5!7t3O ol l ol l L'7245 I I s I ?4 I 14 z) I l 2l 4J 1l L ol a7 Hr Total. oi L97 11o I l l ol 1,271 l l ol ol S 297 *TOTAL* ol 34 l L
68 SE 3RD STREET & SE 1ST AVENUE TIALLANDALE BEACH, FLORIDA COTNTED BY: AMBER PALOMINO SIGNALIZED Tr5fFi^ c,'^rail cha^i:l icfc Tn- 85 SE 4th Avenue, Unit 19 nflrav Rcaeh. Florida Phone (561) ALL VEHICLES sit.e Code : Start Date: IO/29/L5 File LD. : 3ST_1AVE Page : 2 SE 1ST AVENUE From North ll UTurn Left Thru Right. I UTurn Left Thru Right I UTurn Left Thru Rj-ght I UTurn Left Thru Right r Total DaEe L/29/ Peak Hour Analysis By Entire Int.ersecEj-on for Ehe Period: 7:OO to 9: on \O/29/L5 Peak start 8: Volume Percent g t t t Pk toeal Hj-ghest. 7: Volume Hi EoEal PHF.O i Fr^m Faei 8: t t 523 r49 8:45 2L I SE 1ST AVENUE lrom Soutn I from west 8:?1 o 73 2O2 7 47t I Ot 26* 72* 2* 282 I o8: SE ].ST AVENUE 8: 43 t 7* 624 8: t t r64 SE 3RD STREET s1 nv 43 5Bl 43 --l -llr I' I.73 31s t 581 I 1 nqq, VJJ s -r.,*ij!v,=''j.\-!ed ALL VEHTCLES r- I 282, l 22 -;; Intersection Total tl tl t- I J - 1 n 1 rol t I r L 78 SE 3RD STREET 7B SE ].S AVENUE
69 SE 3RD STREET & SE 1ST AVENUE }AI,LANDALE BEACH, FLORIDA COUNTED BY: AMBER PAITOMINO S IGNALI ZED Traffic Survey specialists, lnc. 85 SE 4th Avenue, Unit 19 nfl rav RF^.h Fl.ri da Phone (561) ALL VEHICLES Site Code : St.art Dat.e ; I /29 / 15 File I.D. : 3ST_1AVE Page : 3 SE 1ST AVENUE From North I se 3RD STREET I From EasL I SE 1ST AVENUE I From south I cf?dn erptrtrt I From west nria 1n/?q/ UTurn Left Thru Peak Hour Analysis By Entire Intersec Peak start 17: Vofume PercenE t g 3 t Pk t.otal Highest 7: Volume Hi totaf PHF.O I Right I uturn Left tion for the Perlodr 17r 1r97 B 8 62t' 3r't 17; I Thrrr Pi ahf TIT]lrn LefE Thru L6: t.o * 34 18: on l/29/i5 17: t 29t' 69t : I Di^hts TTT,,rh T.afts Thhr Pidhf Total i 17: 1 J 48 2* t 15& I 316 I I'7 :45 4 o 11 I eb J S t 87 SE 1ST AVENUE SE 3RD STREET 1_86 L B l rl tl 6e.'.lLVE'''L-IED. l_85 A?A I --r ALL VEHICLES r- I [J tl ll 6ee ses L I ll 316 Intersection Total I ll I I 1,27L 1 I z,i I L ti 119 L>I 278 SE 3RD STREET 119 r IU SE 1-S AVENUE
70 SE 3RD STREET & SE 1ST AVENUE HALLANDALE BEACH, FLORIDA COIJNTED BY: AlvlBER PALOMINO SIGNALI ZED tr)f f;. crryrrol, chc^i : I i cf e Tn. 85 SE 4t.h Avenue, Unlt 19 npl rav Ftpe.h Fl nri d Phone (561) PEDESTRIANS & BIKES SlEe Code : 152L5 Start Date: I/29/L5 File LD. : 3ST_1AVE Page : 1 SE 1ST AVENUE From NorEh From East I se 1sr AVENUE I from Soucn I CF ldn QTPFFf From West I.efE BIKES Right DaEe 1/29/ Peds Lefr BrKES Rlghr Peds I Left BrKEs RighL Peds I LefE. BrKEs RighE peds Total o 7: :3 7:45 1 Hr ToEal l o l 1 l o 2 o l 1 o ol o l l 1l 1 l 1 o 2l oi ol ol 8: 8:15 8:3 8:45 O O o 1 l o ol o o o o o ol o o o ol o o o o o o oi o ol o o o o ol l Hr Total l 1 o ol l l l ol l l- 2 a 2 l 11 16: 15:15 16:3 L6:45 I HrTotal. O 2 17: 17:l-5 17:3 3l ol ol ol o o 2 ol o o o o ol 1J l l l l 11 2 o o ol o o o oj o o o ol o o o ol o o o l o o ol o ol o o o o o o ol 17:4a O O O O I o o o?l l Hr Total ol o o 2l l l 2 2 *TOTAL* 4l 3l 4l l
71 214 PEAK SEASON FACTOR CATEGORY REPORT - REPORT TYPE: ALL CATEGORY: 861 CEN.-W OF US1 TO SR7 MOCF:.97 WEEK DATES SF PSCF ================================================================================ 1 1/1/214-1/4/ /5/214-1/11/ /12/214-1/18/ /19/214-1/25/ * 5 1/26/214-2/1/ * 6 2/2/214-2/8/ * 7 2/9/214-2/15/ * 8 2/16/214-2/22/ * 9 2/23/214-3/1/ *1 3/2/214-3/8/ *11 3/9/214-3/15/ *12 3/16/214-3/22/ *13 3/23/214-3/29/ *14 3/3/214-4/5/ *15 4/6/214-4/12/ *16 4/13/214-4/19/ *17 4/2/214-4/26/ /27/214-5/3/ /4/214-5/1/ /11/214-5/17/ /18/214-5/24/ /25/214-5/31/ /1/214-6/7/ /8/214-6/14/ /15/214-6/21/ /22/214-6/28/ /29/214-7/5/ /6/214-7/12/ /13/214-7/19/ /2/214-7/26/ /27/214-8/2/ /3/214-8/9/ /1/214-8/16/ /17/214-8/23/ /24/214-8/3/ /31/214-9/6/ /7/214-9/13/ /14/214-9/2/ /21/214-9/27/ /28/214-1/4/ /5/214-1/11/ /12/214-1/18/ /19/214-1/25/ /26/214-11/1/ /2/214-11/8/ /9/214-11/15/ /16/214-11/22/ /23/214-11/29/ /3/214-12/6/ /7/214-12/13/ /14/214-12/2/ /21/214-12/27/ /28/214-12/31/ * PEAK SEASON 9-MAR :7:53 83UPD 4_861_PKSEASON.TXT
72 214 PEAK SEASON FACTOR CATEGORY REPORT - REPORT TYPE: ALL CATEGORY: 8659 BROWARD I595 MOCF:.97 WEEK DATES SF PSCF ================================================================================ 1 1/1/214-1/4/ /5/214-1/11/ /12/214-1/18/ * 4 1/19/214-1/25/ * 5 1/26/214-2/1/ * 6 2/2/214-2/8/ * 7 2/9/214-2/15/ * 8 2/16/214-2/22/ * 9 2/23/214-3/1/ *1 3/2/214-3/8/ *11 3/9/214-3/15/ *12 3/16/214-3/22/ *13 3/23/214-3/29/ *14 3/3/214-4/5/ *15 4/6/214-4/12/ *16 4/13/214-4/19/ /2/214-4/26/ /27/214-5/3/ /4/214-5/1/ /11/214-5/17/ /18/214-5/24/ /25/214-5/31/ /1/214-6/7/ /8/214-6/14/ /15/214-6/21/ /22/214-6/28/ /29/214-7/5/ /6/214-7/12/ /13/214-7/19/ /2/214-7/26/ /27/214-8/2/ /3/214-8/9/ /1/214-8/16/ /17/214-8/23/ /24/214-8/3/ /31/214-9/6/ /7/214-9/13/ /14/214-9/2/ /21/214-9/27/ /28/214-1/4/ /5/214-1/11/ /12/214-1/18/ /19/214-1/25/ /26/214-11/1/ /2/214-11/8/ /9/214-11/15/ /16/214-11/22/ /23/214-11/29/ /3/214-12/6/ /7/214-12/13/ /14/214-12/2/ /21/214-12/27/ /28/214-12/31/ * PEAK SEASON 9-MAR :7:53 83UPD 4_8659_PKSEASON.TXT
73 214 PEAK SEASON FACTOR CATEGORY REPORT - REPORT TYPE: ALL CATEGORY: 8675 BROWARD I75 URBAN MOCF:.99 WEEK DATES SF PSCF ================================================================================ 1 1/1/214-1/4/ /5/214-1/11/ /12/214-1/18/ /19/214-1/25/ /26/214-2/1/ /2/214-2/8/ /9/214-2/15/ * 8 2/16/214-2/22/ * 9 2/23/214-3/1/ *1 3/2/214-3/8/ *11 3/9/214-3/15/ *12 3/16/214-3/22/ *13 3/23/214-3/29/ *14 3/3/214-4/5/ *15 4/6/214-4/12/ *16 4/13/214-4/19/ *17 4/2/214-4/26/ *18 4/27/214-5/3/ *19 5/4/214-5/1/ *2 5/11/214-5/17/ /18/214-5/24/ /25/214-5/31/ /1/214-6/7/ /8/214-6/14/ /15/214-6/21/ /22/214-6/28/ /29/214-7/5/ /6/214-7/12/ /13/214-7/19/ /2/214-7/26/ /27/214-8/2/ /3/214-8/9/ /1/214-8/16/ /17/214-8/23/ /24/214-8/3/ /31/214-9/6/ /7/214-9/13/ /14/214-9/2/ /21/214-9/27/ /28/214-1/4/ /5/214-1/11/ /12/214-1/18/ /19/214-1/25/ /26/214-11/1/ /2/214-11/8/ /9/214-11/15/ /16/214-11/22/ /23/214-11/29/ /3/214-12/6/ /7/214-12/13/ /14/214-12/2/ /21/214-12/27/ /28/214-12/31/ * PEAK SEASON 9-MAR :7:53 83UPD 4_8675_PKSEASON.TXT
74 214 PEAK SEASON FACTOR CATEGORY REPORT - REPORT TYPE: ALL CATEGORY: 8676 BROWARD I75 RURAL MOCF:.92 WEEK DATES SF PSCF ================================================================================ 1 1/1/214-1/4/ /5/214-1/11/ /12/214-1/18/ /19/214-1/25/ * 5 1/26/214-2/1/ * 6 2/2/214-2/8/ * 7 2/9/214-2/15/ * 8 2/16/214-2/22/ * 9 2/23/214-3/1/ *1 3/2/214-3/8/ *11 3/9/214-3/15/ *12 3/16/214-3/22/ *13 3/23/214-3/29/ *14 3/3/214-4/5/ *15 4/6/214-4/12/ *16 4/13/214-4/19/ *17 4/2/214-4/26/ /27/214-5/3/ /4/214-5/1/ /11/214-5/17/ /18/214-5/24/ /25/214-5/31/ /1/214-6/7/ /8/214-6/14/ /15/214-6/21/ /22/214-6/28/ /29/214-7/5/ /6/214-7/12/ /13/214-7/19/ /2/214-7/26/ /27/214-8/2/ /3/214-8/9/ /1/214-8/16/ /17/214-8/23/ /24/214-8/3/ /31/214-9/6/ /7/214-9/13/ /14/214-9/2/ /21/214-9/27/ /28/214-1/4/ /5/214-1/11/ /12/214-1/18/ /19/214-1/25/ /26/214-11/1/ /2/214-11/8/ /9/214-11/15/ /16/214-11/22/ /23/214-11/29/ /3/214-12/6/ /7/214-12/13/ /14/214-12/2/ /21/214-12/27/ /28/214-12/31/ * PEAK SEASON 9-MAR :7:53 83UPD 4_8676_PKSEASON.TXT
75 214 PEAK SEASON FACTOR CATEGORY REPORT - REPORT TYPE: ALL CATEGORY: 8695 BROWARD I95 MOCF:.97 WEEK DATES SF PSCF ================================================================================ 1 1/1/214-1/4/ /5/214-1/11/ /12/214-1/18/ * 4 1/19/214-1/25/ * 5 1/26/214-2/1/ * 6 2/2/214-2/8/ * 7 2/9/214-2/15/ * 8 2/16/214-2/22/ * 9 2/23/214-3/1/ *1 3/2/214-3/8/ *11 3/9/214-3/15/ *12 3/16/214-3/22/ *13 3/23/214-3/29/ *14 3/3/214-4/5/ *15 4/6/214-4/12/ *16 4/13/214-4/19/ /2/214-4/26/ /27/214-5/3/ /4/214-5/1/ /11/214-5/17/ /18/214-5/24/ /25/214-5/31/ /1/214-6/7/ /8/214-6/14/ /15/214-6/21/ /22/214-6/28/ /29/214-7/5/ /6/214-7/12/ /13/214-7/19/ /2/214-7/26/ /27/214-8/2/ /3/214-8/9/ /1/214-8/16/ /17/214-8/23/ /24/214-8/3/ /31/214-9/6/ /7/214-9/13/ /14/214-9/2/ /21/214-9/27/ /28/214-1/4/ /5/214-1/11/ /12/214-1/18/ /19/214-1/25/ /26/214-11/1/ /2/214-11/8/ /9/214-11/15/ /16/214-11/22/ /23/214-11/29/ /3/214-12/6/ /7/214-12/13/ /14/214-12/2/ /21/214-12/27/ /28/214-12/31/ * PEAK SEASON 9-MAR :7:53 83UPD 4_8695_PKSEASON.TXT
76 Traffic Impact Analysis APPENDIX F: GROWTH RATE CALCULATIONS AND VOLUME DEVELOPMENT WORKSHEETS k:\wpb_tpto\141\14193 optima plaza north\tia\ tia resubmittal\ optima plaza north tia.doc
77 VOLUME DEVELOPMENT SHEET 213th STREET & US 1/BISCAYNE Growth Rate =.5%.5% Peak Season = Buildout Year = Years = 5 5 AM Peak Hour Northbound Southbound Eastbound Westbound LT Thru RT LT Thru RT LT Thru RT LT Thru RT Existing Volume on 1/28/215 1, , Peak Season Volume 1, , Traffic Volume Growth 1, , th Avenue Village Committed Inbound Traffic Assignment 5% Inbound Traffic Volumes 5 Outbound Traffic Assignment 5% Outbound Traffic Volumes -5 Total 7th Avenue Village CVS Committed Inbound Traffic Assignment 22 Inbound Traffic Volumes 1 Outbound Traffic Assignment Outbound Traffic Volumes 1 Total CVS Hallandale Oasis Committed Inbound Traffic Assignment 1% Inbound Traffic Volumes 4 38 Outbound Traffic Assignment 1% Outbound Traffic Volumes Total Hallandale Oasis 4 11 Domus Office Committed Inbound Traffic Assignment % 19% % % % % % % % % % 11% Inbound Traffic Volumes Outbound Traffic Assignment % % % 11% 19% % % % % % % % Outbound Traffic Volumes Total Domus Office Hallandale Square Committed Inbound Traffic Assignment 3% Inbound Traffic Volumes Outbound Traffic Assignment 5% Outbound Traffic Volumes Total Hallandale Square 16 6 Hallandale Artsquare Committed Inbound Traffic Assignment 48% Inbound Traffic Volumes Outbound Traffic Assignment 25% 69% Outbound Traffic Volumes Total Hallandale Artsquare Gulfstream Point Committed Inbound Traffic Assignment Inbound Traffic Volumes 74 Outbound Traffic Assignment Outbound Traffic Volumes 117 Total Gulfstream Point 22 Background Traffic 1, , Project Traffic Inbound Traffic Assignment 19.% 11.% Inbound Traffic Volumes Outbound Traffic Assignment 11.% 19.% Outbound Traffic Volumes Project Traffic TOTAL TRAFFIC 1, , PM Peak Hour Northbound Southbound Eastbound Westbound LT Thru RT LT Thru RT LT Thru RT LT Thru RT Existing Volume on 1/28/215 2, , Peak Season Volume 2, , Traffic Volume Growth 2, , th Avenue Village Committed Inbound Traffic Assignment % 5% % % % % % % % % % % Inbound Traffic Volumes 2 31 Outbound Traffic Assignment % % % % 5% % % % % % % % Outbound Traffic Volumes 2 38 Total 7th Avenue Village 2 2 CVS Committed Inbound Traffic Assignment % % % % % % % % % % % % Inbound Traffic Volumes 4 Outbound Traffic Assignment % % % % % % % % % % % % Outbound Traffic Volumes 4 Total CVS Hallandale Oasis Committed Inbound Traffic Assignment % 1% % % % % % % % % % % Inbound Traffic Volumes 9 88 Outbound Traffic Assignment % % % % 1% % % % % % % % Outbound Traffic Volumes Total Hallandale Oasis 9 21 Domus Office Committed Inbound Traffic Assignment % 19% % % % % % % % % % 11% Inbound Traffic Volumes Outbound Traffic Assignment % % % 11% 19% % % % % % % % Outbound Traffic Volumes Total Domus Office Hallandale Square Committed Inbound Traffic Assignment % 3% % % % % % % % % % % Inbound Traffic Volumes Outbound Traffic Assignment % % % % 5% % % % % % % % Outbound Traffic Volumes Total Hallandale Square Hallandale Artsquare Committed Inbound Traffic Assignment % 48% % % % % % % % % % % Inbound Traffic Volumes Outbound Traffic Assignment % 25% % % 69% % % % % % % % Outbound Traffic Volumes Total Hallandale Artsquare Gulfstream Point Committed Inbound Traffic Assignment % % % % % % % % % % % % Inbound Traffic Volumes 128 Outbound Traffic Assignment % % % % % % % % % % % % Outbound Traffic Volumes 87 Total Gulfstream Point 22 Background Traffic 2, , Project Traffic Inbound Traffic Assignment % 19% % % % % % % % % % 11% Inbound Traffic Volumes Outbound Traffic Assignment % % % 11% 19% % % % % % % % Outbound Traffic Volumes Project Traffic TOTAL TRAFFIC 2, ,
78 VOLUME DEVELOPMENT SHEET SE 9th Street & US 1 Growth Rate =.5%.5% Peak Season = Buildout Year = Years = 5 5 AM Peak Hour Northbound Southbound Eastbound Westbound LT Thru RT LT Thru RT LT Thru RT LT Thru RT Existing Volume on 1/28/ , , Peak Season Volume 56 1, , Traffic Volume Growth 57 1, , th Avenue Village Committed Inbound Traffic Assignment 5% Inbound Traffic Volumes 5 Outbound Traffic Assignment 5% Outbound Traffic Volumes -5 Total 7th Avenue Village CVS Committed Inbound Traffic Assignment Inbound Traffic Volumes 1 Outbound Traffic Assignment Outbound Traffic Volumes 1 Total CVS Hallandale Oasis Committed Inbound Traffic Assignment 1% Inbound Traffic Volumes 4 38 Outbound Traffic Assignment 1% Outbound Traffic Volumes Total Hallandale Oasis 4 11 Domus Office Committed Inbound Traffic Assignment % 7% % % 7% % % % % % % % Inbound Traffic Volumes Outbound Traffic Assignment % % % % % % % % % % % % Outbound Traffic Volumes 51 Total Domus Office Hallandale Square Committed Inbound Traffic Assignment 3% Inbound Traffic Volumes Outbound Traffic Assignment 5% Outbound Traffic Volumes Total Hallandale Square 16 6 Hallandale Artsquare Committed Inbound Traffic Assignment Inbound Traffic Volumes 68 Outbound Traffic Assignment Outbound Traffic Volumes 123 Total Hallandale Artsquare Gulfstream Point Committed Inbound Traffic Assignment 48% 43% 7% 2% Inbound Traffic Volumes Outbound Traffic Assignment 2% 47% 1% Outbound Traffic Volumes Total Gulfstream Point Background Traffic 95 1, , Project Traffic Inbound Traffic Assignment 7.% 7.% Inbound Traffic Volumes Outbound Traffic Assignment Outbound Traffic Volumes 69 Project Traffic TOTAL TRAFFIC 95 1, , PM Peak Hour Northbound Southbound Eastbound Westbound LT Thru RT LT Thru RT LT Thru RT LT Thru RT Existing Volume on 1/28/ , , Peak Season Volume 45 2, , Traffic Volume Growth 46 2, , th Avenue Village Committed Inbound Traffic Assignment % 5% % % % % % % % % % % Inbound Traffic Volumes 2 31 Outbound Traffic Assignment % % % % 5% % % % % % % % Outbound Traffic Volumes 2 38 Total 7th Avenue Village 2 2 CVS Committed Inbound Traffic Assignment % % % % % % % % % % % % Inbound Traffic Volumes 4 Outbound Traffic Assignment % % % % % % % % % % % % Outbound Traffic Volumes 4 Total CVS Hallandale Oasis Committed Inbound Traffic Assignment % 1% % % % % % % % % % % Inbound Traffic Volumes 9 88 Outbound Traffic Assignment % % % % 1% % % % % % % % Outbound Traffic Volumes Total Hallandale Oasis 9 21 Domus Office Committed Inbound Traffic Assignment % 7% % % 7% % % % % % % % Inbound Traffic Volumes Outbound Traffic Assignment % % % % % % % % % % % % Outbound Traffic Volumes 279 Total Domus Office 8 8 Hallandale Square Committed Inbound Traffic Assignment % 3% % % % % % % % % % % Inbound Traffic Volumes Outbound Traffic Assignment % % % % 5% % % % % % % % Outbound Traffic Volumes Total Hallandale Square Hallandale Artsquare Committed Inbound Traffic Assignment % % % % % % % % % % % % Inbound Traffic Volumes 163 Outbound Traffic Assignment % % % % % % % % % % % % Outbound Traffic Volumes 134 Total Hallandale Artsquare Gulfstream Point Committed Inbound Traffic Assignment 48% % % % 43% % % % 7% 2% % % Inbound Traffic Volumes Outbound Traffic Assignment 2% 47% 1% % % % % % % % % % Outbound Traffic Volumes Total Gulfstream Point Background Traffic 19 2, , Project Traffic Inbound Traffic Assignment % 7% % % 7% % % % % % % % Inbound Traffic Volumes Outbound Traffic Assignment % % % % % % % % % % % % Outbound Traffic Volumes 363 Project Traffic TOTAL TRAFFIC 19 2, ,
79 VOLUME DEVELOPMENT SHEET 3RD STREET & US 1 (FEDERAL HWY) Growth Rate =.5%.5% Peak Season = Buildout Year = Years = 5 5 AM Peak Hour Northbound Southbound Eastbound Westbound LT Thru RT LT Thru RT LT Thru RT LT Thru RT Existing Volume on 1/28/ , , Peak Season Volume 66 1, , Traffic Volume Growth 68 1, , th Avenue Village Committed Inbound Traffic Assignment 5% Inbound Traffic Volumes 5 Outbound Traffic Assignment 5% Outbound Traffic Volumes -5 Total 7th Avenue Village CVS Committed Inbound Traffic Assignment Inbound Traffic Volumes 1 Outbound Traffic Assignment Outbound Traffic Volumes 1 Total CVS Hallandale Oasis Committed Inbound Traffic Assignment Inbound Traffic Volumes 38 Outbound Traffic Assignment Outbound Traffic Volumes 113 Total Hallandale Oasis Domus Office Committed Inbound Traffic Assignment % % % % 17% % % % % % % % % Inbound Traffic Volumes Outbound Traffic Assignment % 17% % % % % % % % % % % % Outbound Traffic Volumes 9 51 Total Domus Office 9 47 Hallandale Square Committed Inbound Traffic Assignment 3% 7% Inbound Traffic Volumes Outbound Traffic Assignment 5% 25% Outbound Traffic Volumes Total Hallandale Square Hallandale Artsquare Committed Inbound Traffic Assignment Inbound Traffic Volumes 68 Outbound Traffic Assignment Outbound Traffic Volumes 123 Total Hallandale Artsquare Gulfstream Point Committed Inbound Traffic Assignment 35% 4% 2% Inbound Traffic Volumes Outbound Traffic Assignment 2% 39% 1% Outbound Traffic Volumes Total Gulfstream Point Background Traffic 7 1, , Project Traffic Inbound Traffic Assignment 17.% Inbound Traffic Volumes Outbound Traffic Assignment 17.% Outbound Traffic Volumes Project Traffic TOTAL TRAFFIC 7 1, , PM Peak Hour Northbound Southbound Eastbound Westbound LT Thru RT LT Thru RT LT Thru RT LT Thru RT Existing Volume on 1/28/ , , Peak Season Volume 125 1, , Traffic Volume Growth 128 1, , th Avenue Village Committed Inbound Traffic Assignment % 5% % % % % % % % % % % % Inbound Traffic Volumes 2 31 Outbound Traffic Assignment % % % % 5% % % % % % % % % Outbound Traffic Volumes 2 38 Total 7th Avenue Village 2 2 CVS Committed Inbound Traffic Assignment % % % % % % % % % % % % % Inbound Traffic Volumes 4 Outbound Traffic Assignment % % % % % % % % % % % % % Outbound Traffic Volumes 4 Total CVS Hallandale Oasis Committed Inbound Traffic Assignment % % % % % % % % % % % % % Inbound Traffic Volumes 88 Outbound Traffic Assignment % % % % % % % % % % % % % Outbound Traffic Volumes 28 Total Hallandale Oasis Domus Office Committed Inbound Traffic Assignment % % % % 17% % % % % % % % % Inbound Traffic Volumes Outbound Traffic Assignment % 17% % % % % % % % % % % % Outbound Traffic Volumes Total Domus Office Hallandale Square Committed Inbound Traffic Assignment % 3% % 7% % % % % % % % % % Inbound Traffic Volumes Outbound Traffic Assignment % % % % 5% % % % % 25% % % % Outbound Traffic Volumes Total Hallandale Square Hallandale Artsquare Committed Inbound Traffic Assignment % % % % % % % % % % % % % Inbound Traffic Volumes 163 Outbound Traffic Assignment % % % % % % % % % % % % % Outbound Traffic Volumes 134 Total Hallandale Artsquare Gulfstream Point Committed Inbound Traffic Assignment % % % % 35% % % % 4% 2% % % % Inbound Traffic Volumes Outbound Traffic Assignment 2% 39% 1% % % % % % % % % % % Outbound Traffic Volumes Total Gulfstream Point Background Traffic 13 1, , Project Traffic Inbound Traffic Assignment % % % % 17% % % % % % % % % 16 Inbound Traffic Volumes 18 Outbound Traffic Assignment % 17% % % % % % % % % % % % Outbound Traffic Volumes Project Traffic TOTAL TRAFFIC 13 1, ,
80 VOLUME DEVELOPMENT SHEET 3RD STREET & DIXIE HIGHWAY Growth Rate =.5%.5% Peak Season = Buildout Year = Years = 5 5 AM Peak Hour Northbound Southbound Eastbound Westbound LT Thru RT LT Thru RT LT Thru RT LT Thru RT Existing Volume on 1/28/ Peak Season Volume Traffic Volume Growth th Avenue Village Committed Inbound Traffic Assignment Inbound Traffic Volumes 5 Outbound Traffic Assignment 5% Outbound Traffic Volumes -5 Total 7th Avenue Village CVS Committed Inbound Traffic Assignment Inbound Traffic Volumes 1 Outbound Traffic Assignment Outbound Traffic Volumes 1 Total CVS Hallandale Oasis Committed Inbound Traffic Assignment Inbound Traffic Volumes 38 Outbound Traffic Assignment Outbound Traffic Volumes 113 Total Hallandale Oasis Domus Office Committed Inbound Traffic Assignment % % % % % 21% % % % % % % Inbound Traffic Volumes Outbound Traffic Assignment % % % % % % % % % % % % Outbound Traffic Volumes 51 Total Domus Office 58 Hallandale Square Committed Inbound Traffic Assignment Inbound Traffic Volumes 52 Outbound Traffic Assignment Outbound Traffic Volumes 119 Total Hallandale Square Hallandale Artsquare Committed Inbound Traffic Assignment Inbound Traffic Volumes 68 Outbound Traffic Assignment Outbound Traffic Volumes 123 Total Hallandale Artsquare Gulfstream Point Committed Inbound Traffic Assignment Inbound Traffic Volumes 74 Outbound Traffic Assignment Outbound Traffic Volumes 117 Total Gulfstream Point 22 Background Traffic Project Traffic Inbound Traffic Assignment 21.% Inbound Traffic Volumes Outbound Traffic Assignment Outbound Traffic Volumes 69 Project Traffic 85 TOTAL TRAFFIC PM Peak Hour Northbound Southbound Eastbound Westbound LT Thru RT LT Thru RT LT Thru RT LT Thru RT Existing Volume on 1/28/ Peak Season Volume Traffic Volume Growth th Avenue Village Committed Inbound Traffic Assignment % % % % % % % % % % % % Inbound Traffic Volumes 31 Outbound Traffic Assignment % % % % 5% % % % % % % % Outbound Traffic Volumes 2 38 Total 7th Avenue Village 2 CVS Committed Inbound Traffic Assignment % % % % % % % % % % % % Inbound Traffic Volumes 4 Outbound Traffic Assignment % % % % % % % % % % % % Outbound Traffic Volumes 4 Total CVS Hallandale Oasis Committed Inbound Traffic Assignment % % % % % % % % % % % % Inbound Traffic Volumes 88 Outbound Traffic Assignment % % % % % % % % % % % % Outbound Traffic Volumes 28 Total Hallandale Oasis Domus Office Committed Inbound Traffic Assignment % % % % % 21% % % % % % % Inbound Traffic Volumes Outbound Traffic Assignment % % % % % % % % % % % % Outbound Traffic Volumes 279 Total Domus Office 24 Hallandale Square Committed Inbound Traffic Assignment % % % % % % % % % % % % Inbound Traffic Volumes 35 Outbound Traffic Assignment % % % % % % % % % % % % Outbound Traffic Volumes 711 Total Hallandale Square Hallandale Artsquare Committed Inbound Traffic Assignment % % % % % % % % % % % % Inbound Traffic Volumes 163 Outbound Traffic Assignment % % % % % % % % % % % % Outbound Traffic Volumes 134 Total Hallandale Artsquare Gulfstream Point Committed Inbound Traffic Assignment % % % % % % % % % % % % Inbound Traffic Volumes 128 Outbound Traffic Assignment % % % % % % % % % % % % Outbound Traffic Volumes 87 Total Gulfstream Point 22 Background Traffic Project Traffic Inbound Traffic Assignment % % % % % 21% % % % % % % Inbound Traffic Volumes Outbound Traffic Assignment % % % % % % % % % % % % Outbound Traffic Volumes 363 Project Traffic 22 TOTAL TRAFFIC
81 VOLUME DEVELOPMENT SHEET 3RD STREET & 1ST AVE Growth Rate =.5%.5% Peak Season = Buildout Year = Years = 5 5 AM Peak Hour Northbound Southbound Eastbound Westbound LT Thru RT LT Thru RT LT Thru RT LT Thru RT Existing Volume on 1/28/ Peak Season Volume Traffic Volume Growth th Avenue Village Committed Inbound Traffic Assignment 5% Inbound Traffic Volumes 5 Outbound Traffic Assignment Outbound Traffic Volumes -5 Total 7th Avenue Village CVS Committed Inbound Traffic Assignment Inbound Traffic Volumes 1 Outbound Traffic Assignment Outbound Traffic Volumes 1 Total CVS Hallandale Oasis Committed Inbound Traffic Assignment Inbound Traffic Volumes 38 Outbound Traffic Assignment Outbound Traffic Volumes 113 Total Hallandale Oasis Domus Office Committed Inbound Traffic Assignment % % % % % % % % % % % % Inbound Traffic Volumes 275 Outbound Traffic Assignment % 3% % % % % % % % % % % Outbound Traffic Volumes Total Domus Office 15 Hallandale Square Committed Inbound Traffic Assignment Inbound Traffic Volumes 52 Outbound Traffic Assignment Outbound Traffic Volumes 119 Total Hallandale Square Hallandale Artsquare Committed Inbound Traffic Assignment Inbound Traffic Volumes 68 Outbound Traffic Assignment Outbound Traffic Volumes 123 Total Hallandale Artsquare Gulfstream Point Committed Inbound Traffic Assignment Inbound Traffic Volumes 74 Outbound Traffic Assignment Outbound Traffic Volumes 117 Total Gulfstream Point 22 Background Traffic Project Traffic Inbound Traffic Assignment Inbound Traffic Volumes 44 Outbound Traffic Assignment 3.% Outbound Traffic Volumes Project Traffic 21 TOTAL TRAFFIC PM Peak Hour Northbound Southbound Eastbound Westbound LT Thru RT LT Thru RT LT Thru RT LT Thru RT Existing Volume on 1/28/ Peak Season Volume Traffic Volume Growth th Avenue Village Committed Inbound Traffic Assignment % 5% % % % % % % % % % % Inbound Traffic Volumes 2 31 Outbound Traffic Assignment % % % % % % % % % % % % Outbound Traffic Volumes 38 Total 7th Avenue Village 2 CVS Committed Inbound Traffic Assignment % % % % % % % % % % % % Inbound Traffic Volumes 4 Outbound Traffic Assignment % % % % % % % % % % % % Outbound Traffic Volumes 4 Total CVS Hallandale Oasis Committed Inbound Traffic Assignment % % % % % % % % % % % % Inbound Traffic Volumes 88 Outbound Traffic Assignment % % % % % % % % % % % % Outbound Traffic Volumes 28 Total Hallandale Oasis Domus Office Committed Inbound Traffic Assignment % % % % % % % % % % % % Inbound Traffic Volumes 114 Outbound Traffic Assignment % 3% % % % % % % % % % % Outbound Traffic Volumes Total Domus Office 84 Hallandale Square Committed Inbound Traffic Assignment % % % % % % % % % % % % Inbound Traffic Volumes 35 Outbound Traffic Assignment % % % % % % % % % % % % Outbound Traffic Volumes 711 Total Hallandale Square Hallandale Artsquare Committed Inbound Traffic Assignment % % % % % % % % % % % % Inbound Traffic Volumes 163 Outbound Traffic Assignment % % % % % % % % % % % % Outbound Traffic Volumes 134 Total Hallandale Artsquare Gulfstream Point Committed Inbound Traffic Assignment % % % % % % % % % % % % Inbound Traffic Volumes 128 Outbound Traffic Assignment % % % % % % % % % % % % Outbound Traffic Volumes 87 Total Gulfstream Point 22 Background Traffic Project Traffic Inbound Traffic Assignment % % % % % % % % % % % % Inbound Traffic Volumes 16 Outbound Traffic Assignment % 3% % % % % % % % % % % Outbound Traffic Volumes Project Traffic 19 TOTAL TRAFFIC
82 VOLUME DEVELOPMENT SHEET HALLANDALE BEACH BOULEVARD & US 1 (FEDERAL HWY) Growth Rate =.5%.5% Peak Season = Buildout Year = Years = 5 5 AM Peak Hour Northbound Southbound Eastbound Westbound LT Thru RT LT Thru RT LT Thru RT LT Thru RT Existing Volume on 1/28/ Peak Season Volume , Traffic Volume Growth , th Avenue Village Committed Inbound Traffic Assignment 5% 5% 15% Inbound Traffic Volumes 1 5 Outbound Traffic Volumes -1-5 Total 7th Avenue Village -1 1 CVS Committed Inbound Traffic Assignment Inbound Traffic Volumes 1 Outbound Traffic Assignment Outbound Traffic Volumes 1 Total CVS Hallandale Oasis Committed Inbound Traffic Assignment 1% 1% 3% Inbound Traffic Volumes Outbound Traffic Assignment 1% 3% 1% Outbound Traffic Volumes Total Hallandale Oasis Domus Office Committed Inbound Traffic Assignment % % % % 9% % % % 3% 5% % % % Inbound Traffic Volumes Outbound Traffic Assignment 3% 9% 5% % % % % % % % % % % Outbound Traffic Volumes Total Domus Office Hallandale Square Committed Inbound Traffic Assignment 25% 2% 26% 5% Inbound Traffic Volumes Outbound Traffic Assignment 5% 5% 2% 26% 25% Outbound Traffic Volumes Total Hallandale Square Hallandale Artsquare Committed Inbound Traffic Assignment 25% Inbound Traffic Volumes Outbound Traffic Assignment 4% Outbound Traffic Volumes Total Hallandale Artsquare Gulfstream Point Committed Inbound Traffic Assignment Inbound Traffic Volumes 74 Outbound Traffic Assignment Outbound Traffic Volumes 117 Total Gulfstream Point 22 Background Traffic , ,25 16 Project Traffic Inbound Traffic Assignment 9.% 3.% 5.% Inbound Traffic Volumes Outbound Traffic Assignment 3.% 9.% 5.% Outbound Traffic Volumes Project Traffic TOTAL TRAFFIC , ,25 16 PM Peak Hour Northbound Southbound Eastbound Westbound LT Thru RT LT Thru RT LT Thru RT LT Thru RT Existing Volume on 1/28/ , ,21 16 Peak Season Volume , , Traffic Volume Growth , , th Avenue Village Committed Inbound Traffic Assignment 5% % % % % 5% % % % % 15% % % Inbound Traffic Volumes Outbound Traffic Assignment % % % % % % 5% 15% 5% % % % % Outbound Traffic Volumes Total 7th Avenue Village CVS Committed Inbound Traffic Assignment % % % % % % % % % % % % % Inbound Traffic Volumes 4 Outbound Traffic Assignment % % % % % % % % % % % % % Outbound Traffic Volumes 4 Total CVS Hallandale Oasis Committed Inbound Traffic Assignment % % 1% 1% % % % 3% % % % % % Inbound Traffic Volumes Outbound Traffic Assignment % % % % % % % % % 1% 3% 1% % Outbound Traffic Volumes Total Hallandale Oasis Domus Office Committed Inbound Traffic Assignment % % % % 9% % % % 3% 5% % % % Inbound Traffic Volumes Outbound Traffic Assignment 3% 9% 5% % % % % % % % % % % Outbound Traffic Volumes Total Domus Office Hallandale Square Committed Inbound Traffic Assignment % % % 25% 2% % % % % % 26% 5% % Inbound Traffic Volumes Outbound Traffic Assignment 5% 5% 2% % % % % 26% 25% % % % % Outbound Traffic Volumes Total Hallandale Square Hallandale Artsquare Committed Inbound Traffic Assignment % 25% % % % % % % % % % % % Inbound Traffic Volumes Outbound Traffic Assignment % % % % 4% % % % % % % % % Outbound Traffic Volumes Total Hallandale Artsquare Gulfstream Point Committed Inbound Traffic Assignment % % % % % % % % % % % % % Inbound Traffic Volumes 128 Outbound Traffic Assignment % % % % % % % % % % % % % Outbound Traffic Volumes 87 Total Gulfstream Point 22 Background Traffic 573 1, , , ,25 23 Project Traffic Inbound Traffic Assignment % % % % 9% % % % 3% 5% % % % Inbound Traffic Volumes Outbound Traffic Assignment 3% 9% 5% % % % % % % % % % % Outbound Traffic Volumes Project Traffic TOTAL TRAFFIC 585 1, , , ,25 23
83 Growth Rate =.5%.5% Peak Season = 1 1 Buildout Year = Years = 5 5 VOLUME DEVELOPMENT SHEET HALLANDALE BEACH BOULEVARD & DIXIE HIGHWAY AM Peak Hour Northbound Southbound Eastbound Westbound LT Thru RT LT Thru RT LT Thru RT LT Thru RT Existing Volume on 1/13/ , ,353 Peak Season Volume , ,353 Traffic Volume Growth , ,387 7th Avenue Village Committed Inbound Traffic Assignment 6% 31% Inbound Traffic Volumes 2 Outbound Traffic Assignment 31% 5% Outbound Traffic Volumes -2 Total 7th Avenue Village -2 2 CVS Committed Inbound Traffic Assignment Inbound Traffic Volumes Outbound Traffic Assignment Outbound Traffic Volumes Total CVS Hallandale Oasis Committed Inbound Traffic Assignment Inbound Traffic Volumes Outbound Traffic Assignment Outbound Traffic Volumes Total Hallandale Oasis Domus Office Committed Inbound Traffic Assignment % % % % 12% % % 3% 21% % % % Inbound Traffic Volumes Outbound Traffic Assignment % % % % % % % % % % % % Outbound Traffic Volumes Total Domus Office Hallandale Square Committed Inbound Traffic Assignment 31% Inbound Traffic Volumes 16 Outbound Traffic Assignment 26% Outbound Traffic Volumes 31 Total Hallandale Square Hallandale Artsquare Committed Inbound Traffic Assignment Inbound Traffic Volumes Outbound Traffic Assignment 14% Outbound Traffic Volumes 17 Total Hallandale Artsquare 17 Gulfstream Point Committed Inbound Traffic Assignment Inbound Traffic Volumes Outbound Traffic Assignment Outbound Traffic Volumes Total Gulfstream Point 22 Background Traffic , ,42 Project Traffic Inbound Traffic Assignment 12.% 3.% 21.% Inbound Traffic Volumes Outbound Traffic Assignment Outbound Traffic Volumes Project Traffic TOTAL TRAFFIC , ,42 PM Peak Hour Northbound Southbound Eastbound Westbound LT Thru RT LT Thru RT LT Thru RT LT Thru RT Existing Volume on 1/13/ , ,832 Peak Season Volume , ,832 Traffic Volume Growth , ,878 7th Avenue Village Committed Inbound Traffic Assignment % % % % % 6% % % % % 31% % Inbound Traffic Volumes 2 1 Outbound Traffic Assignment % % % % % % % 31% 5% % % % Outbound Traffic Volumes 12 2 Total 7th Avenue Village CVS Committed Inbound Traffic Assignment % % % % % % % % % % % % Inbound Traffic Volumes Outbound Traffic Assignment % % % % % % % % % % % % Outbound Traffic Volumes
84 Growth Rate =.5%.5% Peak Season = 1 1 Buildout Year = Years = 5 5 VOLUME DEVELOPMENT SHEET HALLANDALE BEACH BOULEVARD &NE 1ST AVENUE AM Peak Hour Northbound Southbound Eastbound Westbound LT Thru RT LT Thru RT LT Thru RT LT Thru RT Existing Volume on 1/13/ ,42 1,28 22 Peak Season Volume ,42 1,28 22 Traffic Volume Growth ,437 1, th Avenue Village Committed Inbound Traffic Assignment 5% 25% Inbound Traffic Volumes 1 Outbound Traffic Assignment 6% 25% Outbound Traffic Volumes -1 Total 7th Avenue Village -1 1 CVS Committed Inbound Traffic Assignment Inbound Traffic Volumes Outbound Traffic Assignment Outbound Traffic Volumes Total CVS Hallandale Oasis Committed Inbound Traffic Assignment Inbound Traffic Volumes Outbound Traffic Assignment Outbound Traffic Volumes Total Hallandale Oasis Domus Office Committed Inbound Traffic Assignment % % % % % % % % % % % % Inbound Traffic Volumes Outbound Traffic Assignment 18% 12% % % % % % % % % % % Outbound Traffic Volumes 9 6 Total Domus Office 9 6 Hallandale Square Committed Inbound Traffic Assignment 31% Inbound Traffic Volumes 16 Outbound Traffic Assignment 26% Outbound Traffic Volumes 31 Total Hallandale Square Hallandale Artsquare Committed Inbound Traffic Assignment 14% Inbound Traffic Volumes 1 Outbound Traffic Assignment Outbound Traffic Volumes Total Hallandale Artsquare 1 Gulfstream Point Committed Inbound Traffic Assignment Inbound Traffic Volumes Outbound Traffic Assignment Outbound Traffic Volumes Total Gulfstream Point 22 Background Traffic ,452 1, Project Traffic Inbound Traffic Assignment Inbound Traffic Volumes Outbound Traffic Assignment 18.% 12.% Outbound Traffic Volumes 12 8 Project Traffic 12 8 TOTAL TRAFFIC ,452 1, PM Peak Hour Northbound Southbound Eastbound Westbound LT Thru RT LT Thru RT LT Thru RT LT Thru RT Existing Volume on 1/13/ ,121 1,68 35 Peak Season Volume ,121 1,68 35 Traffic Volume Growth ,149 1, th Avenue Village Committed Inbound Traffic Assignment 5% % % % % % % % % % 25% % Inbound Traffic Volumes 2 8 Outbound Traffic Assignment % % % % % % 6% 25% % % % % Outbound Traffic Volumes 2 1 Total 7th Avenue Village CVS Committed Inbound Traffic Assignment % % % % % % % % % % % % Inbound Traffic Volumes Outbound Traffic Assignment % % % % % % % % % % % % Outbound Traffic Volumes
85 VOLUME DEVELOPMENT SHEET 8TH AVENUE & HALLANDALE BEACH BOULEVARD Growth Rate =.5%.5% Peak Season = Buildout Year = Years = 5 5 AM Peak Hour Northbound Southbound Eastbound Westbound LT Thru RT LT Thru RT LT Thru RT LT Thru RT Existing Volume on 1/28/ , ,336 Peak Season Volume , ,376 Traffic Volume Growth , ,411 7th Avenue Village Committed Inbound Traffic Assignment 1% Inbound Traffic Volumes 1 5 Outbound Traffic Assignment 3% 1% Outbound Traffic Volumes -1-5 Total 7th Avenue Village -1 1 Hallandale Oasis Committed Inbound Traffic Assignment Inbound Traffic Volumes 38 Outbound Traffic Assignment Outbound Traffic Volumes 113 Total Hallandale Oasis Domus Office Committed Inbound Traffic Assignment % % % % % % % % % % 5% % Inbound Traffic Volumes Outbound Traffic Assignment % % % % % % % 5% % % % % Outbound Traffic Volumes 3 51 Total Domus Office 3 14 Hallandale Square Committed Inbound Traffic Assignment 2% 51% 1% Inbound Traffic Volumes Outbound Traffic Assignment 51% 2% Outbound Traffic Volumes Total Hallandale Square Hallandale Artsquare Committed Inbound Traffic Assignment Inbound Traffic Volumes 68 Outbound Traffic Assignment Outbound Traffic Volumes 123 Total Hallandale Artsquare Gulfstream Point Committed Inbound Traffic Assignment Inbound Traffic Volumes 74 Outbound Traffic Assignment Outbound Traffic Volumes 117 Total Gulfstream Point 22 Background Traffic , ,426 Project Traffic Inbound Traffic Assignment 5.% Inbound Traffic Volumes 2 44 Outbound Traffic Assignment 5.% Outbound Traffic Volumes 3 69 Project Traffic 3 2 TOTAL TRAFFIC , ,446 PM Peak Hour Northbound Southbound Eastbound Westbound LT Thru RT LT Thru RT LT Thru RT LT Thru RT Existing Volume on 1/28/ , ,724 Peak Season Volume , ,776 Traffic Volume Growth , ,821 7th Avenue Village Committed Inbound Traffic Assignment % % % % % % % % % % 1% % Inbound Traffic Volumes 3 31 Outbound Traffic Assignment 3% % % % % % % 1% % % % % Outbound Traffic Volumes Total 7th Avenue Village CVS Committed Inbound Traffic Assignment % % % % % % % % % % % % Inbound Traffic Volumes 4 Outbound Traffic Assignment % % % % % % % % % % % % Outbound Traffic Volumes 4 Total CVS Hallandale Oasis Committed Inbound Traffic Assignment % % % % % % % % % % % % Inbound Traffic Volumes 88 Outbound Traffic Assignment % % % % % % % % % % % % Outbound Traffic Volumes 28 Total Hallandale Oasis Domus Office Committed Inbound Traffic Assignment % % % % % % % % % % 5% % Inbound Traffic Volumes Outbound Traffic Assignment % % % % % % % 5% % % % % Outbound Traffic Volumes Total Domus Office 14 6 Hallandale Square Committed Inbound Traffic Assignment % % % % 2% % % % 51% 1% % % Inbound Traffic Volumes Outbound Traffic Assignment 51% 2% % % % % % % % % % % Outbound Traffic Volumes Total Hallandale Square Hallandale Artsquare Committed Inbound Traffic Assignment % % % % % % % % % % % % Inbound Traffic Volumes 163 Outbound Traffic Assignment % % % % % % % % % % % % Outbound Traffic Volumes 134 Total Hallandale Artsquare Gulfstream Point Committed Inbound Traffic Assignment % % % % % % % % % % % % Inbound Traffic Volumes 128 Outbound Traffic Assignment % % % % % % % % % % % % Outbound Traffic Volumes 87 Total Gulfstream Point 22 Background Traffic , ,83 Project Traffic Inbound Traffic Assignment % % % % % % % % % % 5% % Inbound Traffic Volumes 5 16 Outbound Traffic Assignment % % % % % % % 5% % % % % Outbound Traffic Volumes Project Traffic 18 5 TOTAL TRAFFIC , ,835
86 VOLUME DEVELOPMENT SHEET 1TH AVENUE & HALLANDALE BEACH BOULEVARD Growth Rate =.5%.5% Peak Season = Buildout Year = Years = 5 5 AM Peak Hour Northbound Southbound Eastbound Westbound LT Thru RT LT Thru RT LT Thru RT LT Thru RT Existing Volume on 1/28/ , , Peak Season Volume , , Traffic Volume Growth , , th Avenue Village Committed Inbound Traffic Assignment 1% Inbound Traffic Volumes 1 5 Outbound Traffic Assignment 1% Outbound Traffic Volumes -1-5 Total 7th Avenue Village -1 1 CVS Committed Inbound Traffic Assignment Inbound Traffic Volumes 1 Outbound Traffic Assignment Outbound Traffic Volumes 1 Total CVS Hallandale Oasis Committed Inbound Traffic Assignment Inbound Traffic Volumes 38 Outbound Traffic Assignment Outbound Traffic Volumes 113 Total Hallandale Oasis Domus Office Committed Inbound Traffic Assignment % % % % % % % % % % 5% % % Inbound Traffic Volumes Outbound Traffic Assignment % % % % % % % 5% % % % % % Outbound Traffic Volumes 3 51 Total Domus Office 3 14 Hallandale Square Committed Inbound Traffic Assignment 2% 5% Inbound Traffic Volumes Outbound Traffic Assignment 2% 8% Outbound Traffic Volumes Total Hallandale Square Hallandale Artsquare Committed Inbound Traffic Assignment Inbound Traffic Volumes 68 Outbound Traffic Assignment Outbound Traffic Volumes 123 Total Hallandale Artsquare Gulfstream Point Committed Inbound Traffic Assignment Inbound Traffic Volumes 74 Outbound Traffic Assignment Outbound Traffic Volumes 117 Total Gulfstream Point 22 Background Traffic , , Project Traffic Inbound Traffic Assignment 5.% Inbound Traffic Volumes 2 44 Outbound Traffic Assignment 5.% Outbound Traffic Volumes 3 69 Project Traffic 3 2 TOTAL TRAFFIC , ,47 58 PM Peak Hour Northbound Southbound Eastbound Westbound LT Thru RT LT Thru RT LT Thru RT LT Thru RT Existing Volume on 1/28/ , ,62 96 Peak Season Volume , , Traffic Volume Growth , , th Avenue Village Committed Inbound Traffic Assignment % % % % % % % % % % 1% % % Inbound Traffic Volumes 3 31 Outbound Traffic Assignment % % % % % % % 1% % % % % % Outbound Traffic Volumes 4 38 Total 7th Avenue Village 4 3 CVS Committed Inbound Traffic Assignment % % % % % % % % % % % % % Inbound Traffic Volumes 4 Outbound Traffic Assignment % % % % % % % % % % % % % Outbound Traffic Volumes 4 Total CVS Hallandale Oasis Committed Inbound Traffic Assignment % % % % % % % % % % % % % Inbound Traffic Volumes 88 Outbound Traffic Assignment % % % % % % % % % % % % % Outbound Traffic Volumes 28 Total Hallandale Oasis Domus Office Committed Inbound Traffic Assignment % % % % % % % % % % 5% % % Inbound Traffic Volumes Outbound Traffic Assignment % % % % % % % 5% % % % % % Outbound Traffic Volumes Total Domus Office 14 6 Hallandale Square Committed Inbound Traffic Assignment % % % % % 2% % % % % 5% % % Inbound Traffic Volumes Outbound Traffic Assignment % 2% 8% % % % % % % % % % % Outbound Traffic Volumes Total Hallandale Square Hallandale Artsquare Committed Inbound Traffic Assignment % % % % % % % % % % % % % Inbound Traffic Volumes 163 Outbound Traffic Assignment % % % % % % % % % % % % % Outbound Traffic Volumes 134 Total Hallandale Artsquare Gulfstream Point Committed Inbound Traffic Assignment % % % % % % % % % % % % % Inbound Traffic Volumes 128 Outbound Traffic Assignment % % % % % % % % % % % % % Outbound Traffic Volumes 87 Total Gulfstream Point 22 Background Traffic , , Project Traffic Inbound Traffic Assignment % % % % % % % % % % 5% % % Inbound Traffic Volumes Outbound Traffic Assignment % % % % % % % 5% % % % % % Outbound Traffic Volumes Project Traffic 2 7 TOTAL TRAFFIC , ,745 11
87 VOLUME DEVELOPMENT SHEET County Line(215th street) & Dixie Highway Growth Rate =.5%.5% Peak Season = Buildout Year = Years = 5 5 AM Peak Hour Northbound Southbound Eastbound Westbound LT Thru RT LT Thru RT LT Thru RT LT Thru RT Existing Volume on 1/28/ Peak Season Volume Traffic Volume Growth th Avenue Village Committed Inbound Traffic Assignment Inbound Traffic Volumes 5 Outbound Traffic Assignment 5% Outbound Traffic Volumes -5 Total 7th Avenue Village CVS Committed Inbound Traffic Assignment Inbound Traffic Volumes 1 Outbound Traffic Assignment Outbound Traffic Volumes 1 Total CVS Hallandale Oasis Committed Inbound Traffic Assignment Inbound Traffic Volumes 38 Outbound Traffic Assignment Outbound Traffic Volumes 113 Total Hallandale Oasis Domus Office Committed Inbound Traffic Assignment % % % % % % % % % % % % Inbound Traffic Volumes 275 Outbound Traffic Assignment % % % % 3% % % % % % % % Outbound Traffic Volumes Total Domus Office 15 Hallandale Square Committed Inbound Traffic Assignment Inbound Traffic Volumes 52 Outbound Traffic Assignment Outbound Traffic Volumes 119 Total Hallandale Square Hallandale Artsquare Committed Inbound Traffic Assignment Inbound Traffic Volumes 68 Outbound Traffic Assignment Outbound Traffic Volumes 123 Total Hallandale Artsquare Gulfstream Point Committed Inbound Traffic Assignment Inbound Traffic Volumes 74 Outbound Traffic Assignment Outbound Traffic Volumes 117 Total Gulfstream Point 22 Background Traffic Project Traffic Inbound Traffic Assignment Inbound Traffic Volumes 44 Outbound Traffic Assignment 3.% Outbound Traffic Volumes Project Traffic 21 TOTAL TRAFFIC PM Peak Hour Northbound Southbound Eastbound Westbound LT Thru RT LT Thru RT LT Thru RT LT Thru RT Existing Volume on 1/28/ Peak Season Volume Traffic Volume Growth th Avenue Village Committed Inbound Traffic Assignment % % % % % % % % % % % % Inbound Traffic Volumes 31 Outbound Traffic Assignment % % % % 5% % % % % % % % Outbound Traffic Volumes 2 38 Total 7th Avenue Village 2 CVS Committed Inbound Traffic Assignment % % % % % % % % % % % % Inbound Traffic Volumes 4 Outbound Traffic Assignment % % % % % % % % % % % % Outbound Traffic Volumes 4 Total CVS Hallandale Oasis Committed Inbound Traffic Assignment % % % % % % % % % % % % Inbound Traffic Volumes 88 Outbound Traffic Assignment % % % % % % % % % % % % Outbound Traffic Volumes 28 Total Hallandale Oasis Domus Office Committed Inbound Traffic Assignment % % % % % % % % % % % % Inbound Traffic Volumes 114 Outbound Traffic Assignment % % % % 3% % % % % % % % Outbound Traffic Volumes Total Domus Office 84 Hallandale Square Committed Inbound Traffic Assignment % % % % % % % % % % % % Inbound Traffic Volumes 35 Outbound Traffic Assignment % % % % % % % % % % % % Outbound Traffic Volumes 711 Total Hallandale Square Hallandale Artsquare Committed Inbound Traffic Assignment % % % % % % % % % % % % Inbound Traffic Volumes 163 Outbound Traffic Assignment % % % % % % % % % % % % Outbound Traffic Volumes 134 Total Hallandale Artsquare Gulfstream Point Committed Inbound Traffic Assignment % % % % % % % % % % % % Inbound Traffic Volumes 128 Outbound Traffic Assignment % % % % % % % % % % % % Outbound Traffic Volumes 87 Total Gulfstream Point 22 Background Traffic Project Traffic Inbound Traffic Assignment % % % % % % % % % % % % Inbound Traffic Volumes 16 Outbound Traffic Assignment % % % % 3% % % % % % % % Outbound Traffic Volumes Project Traffic 19 TOTAL TRAFFIC
88 VOLUME DEVELOPMENT SHEET County Line Road(215th street) & SE 1st Avenue Growth Rate =.5%.5% Peak Season = Buildout Year = Years = 5 5 AM Peak Hour Northbound Southbound Eastbound Westbound LT Thru RT LT Thru RT LT Thru RT LT Thru RT Existing Volume on 1/28/ Peak Season Volume Traffic Volume Growth th Avenue Village Committed Inbound Traffic Assignment 5% Inbound Traffic Volumes 5 Outbound Traffic Assignment Outbound Traffic Volumes -5 Total 7th Avenue Village CVS Committed Inbound Traffic Assignment Inbound Traffic Volumes 1 Outbound Traffic Assignment Outbound Traffic Volumes 1 Total CVS Hallandale Oasis Committed Inbound Traffic Assignment Inbound Traffic Volumes 38 Outbound Traffic Assignment Outbound Traffic Volumes 113 Total Hallandale Oasis Domus Office Committed Inbound Traffic Assignment % 3% % % % % % % % % % % Inbound Traffic Volumes Outbound Traffic Assignment % % % % % % % % % % % % Outbound Traffic Volumes 51 Total Domus Office 83 Hallandale Square Committed Inbound Traffic Assignment Inbound Traffic Volumes 52 Outbound Traffic Assignment Outbound Traffic Volumes 119 Total Hallandale Square Hallandale Artsquare Committed Inbound Traffic Assignment Inbound Traffic Volumes 68 Outbound Traffic Assignment Outbound Traffic Volumes 123 Total Hallandale Artsquare Gulfstream Point Committed Inbound Traffic Assignment Inbound Traffic Volumes 74 Outbound Traffic Assignment 4% Outbound Traffic Volumes Total Gulfstream Point 5 22 Background Traffic Project Traffic Inbound Traffic Assignment 3.% Inbound Traffic Volumes Outbound Traffic Assignment Outbound Traffic Volumes 69 Project Traffic 121 TOTAL TRAFFIC PM Peak Hour Northbound Southbound Eastbound Westbound LT Thru RT LT Thru RT LT Thru RT LT Thru RT Existing Volume on 1/28/ Peak Season Volume Traffic Volume Growth th Avenue Village Committed Inbound Traffic Assignment % 5% % % % % % % % % % % Inbound Traffic Volumes 2 31 Outbound Traffic Assignment % % % % % % % % % % % % Outbound Traffic Volumes 38 Total 7th Avenue Village 2 CVS Committed Inbound Traffic Assignment % % % % % % % % % % % % Inbound Traffic Volumes 4 Outbound Traffic Assignment % % % % % % % % % % % % Outbound Traffic Volumes 4 Total CVS Hallandale Oasis Committed Inbound Traffic Assignment % % % % % % % % % % % % Inbound Traffic Volumes 88 Outbound Traffic Assignment % % % % % % % % % % % % Outbound Traffic Volumes 28 Total Hallandale Oasis Domus Office Committed Inbound Traffic Assignment % 3% % % % % % % % % % % Inbound Traffic Volumes Outbound Traffic Assignment % % % % % % % % % % % % Outbound Traffic Volumes 279 Total Domus Office 34 Hallandale Square Committed Inbound Traffic Assignment % % % % % % % % % % % % Inbound Traffic Volumes 35 Outbound Traffic Assignment % % % % % % % % % % % % Outbound Traffic Volumes 711 Total Hallandale Square Hallandale Artsquare Committed Inbound Traffic Assignment % % % % % % % % % % % % Inbound Traffic Volumes 163 Outbound Traffic Assignment % % % % % % % % % % % % Outbound Traffic Volumes 134 Total Hallandale Artsquare Gulfstream Point Committed Inbound Traffic Assignment % % % % % % % % % % % % Inbound Traffic Volumes 128 Outbound Traffic Assignment % % % % 4% % % % % % % % Outbound Traffic Volumes 3 87 Total Gulfstream Point 3 22 Background Traffic Project Traffic Inbound Traffic Assignment % 3% % % % % % % % % % % Inbound Traffic Volumes Outbound Traffic Assignment % % % % % % % % % % % % Outbound Traffic Volumes 363 Project Traffic 32 TOTAL TRAFFIC
89 VOLUME DEVELOPMENT SHEET 214TH TERRACE & SE 3RD AVENUE Growth Rate =.5%.5% Peak Season = Buildout Year = Years = 5 5 AM Peak Hour Northbound Southbound Eastbound Westbound LT Thru RT LT Thru RT LT Thru RT LT Thru RT Existing Volume on 1/28/ Peak Season Volume Traffic Volume Growth th Avenue Village Committed Inbound Traffic Assignment Inbound Traffic Volumes 5 Outbound Traffic Assignment Outbound Traffic Volumes -5 Total 7th Avenue Village CVS Committed Inbound Traffic Assignment Inbound Traffic Volumes 1 Outbound Traffic Assignment Outbound Traffic Volumes 1 Total CVS Hallandale Oasis Committed Inbound Traffic Assignment Inbound Traffic Volumes 38 Outbound Traffic Assignment Outbound Traffic Volumes 113 Total Hallandale Oasis Domus Office Committed Inbound Traffic Assignment % % % % 1% % % % 7% 2% % % Inbound Traffic Volumes Outbound Traffic Assignment 7% 1% 2% % % % % % % % % % Outbound Traffic Volumes Total Domus Office Hallandale Square Committed Inbound Traffic Assignment Inbound Traffic Volumes 52 Outbound Traffic Assignment Outbound Traffic Volumes 119 Total Hallandale Square Hallandale Artsquare Committed Inbound Traffic Assignment Inbound Traffic Volumes 68 Outbound Traffic Assignment Outbound Traffic Volumes 123 Total Hallandale Artsquare Gulfstream Point Committed Inbound Traffic Assignment Inbound Traffic Volumes 74 Outbound Traffic Assignment Outbound Traffic Volumes 117 Total Gulfstream Point 22 Background Traffic Project Traffic Inbound Traffic Assignment 1.% 7.% 2.% Inbound Traffic Volumes Outbound Traffic Assignment 7.% 1.% 2.% Outbound Traffic Volumes Project Traffic TOTAL TRAFFIC PM Peak Hour Northbound Southbound Eastbound Westbound LT Thru RT LT Thru RT LT Thru RT LT Thru RT Existing Volume on 1/28/ Peak Season Volume Traffic Volume Growth th Avenue Village Committed Inbound Traffic Assignment % % % % % % % % % % % % Inbound Traffic Volumes 31 Outbound Traffic Assignment % % % % % % % % % % % % Outbound Traffic Volumes 38 Total 7th Avenue Village CVS Committed Inbound Traffic Assignment % % % % % % % % % % % % Inbound Traffic Volumes 4 Outbound Traffic Assignment % % % % % % % % % % % % Outbound Traffic Volumes 4 Total CVS Hallandale Oasis Committed Inbound Traffic Assignment % % % % % % % % % % % % Inbound Traffic Volumes 88 Outbound Traffic Assignment % % % % % % % % % % % % Outbound Traffic Volumes 28 Total Hallandale Oasis Domus Office Committed Inbound Traffic Assignment % % % % 1% % % % 7% 2% % % Inbound Traffic Volumes Outbound Traffic Assignment 7% 1% 2% % % % % % % % % % Outbound Traffic Volumes Total Domus Office Hallandale Square Committed Inbound Traffic Assignment % % % % % % % % % % % % Inbound Traffic Volumes 35 Outbound Traffic Assignment % % % % % % % % % % % % Outbound Traffic Volumes 711 Total Hallandale Square Hallandale Artsquare Committed Inbound Traffic Assignment % % % % % % % % % % % % Inbound Traffic Volumes 163 Outbound Traffic Assignment % % % % % % % % % % % % Outbound Traffic Volumes 134 Total Hallandale Artsquare Gulfstream Point Committed Inbound Traffic Assignment % % % % % % % % % % % % Inbound Traffic Volumes 128 Outbound Traffic Assignment % % % % % % % % % % % % Outbound Traffic Volumes 87 Total Gulfstream Point 22 Background Traffic Project Traffic Inbound Traffic Assignment % % % % 1% % % % 7% 2% % % Inbound Traffic Volumes Outbound Traffic Assignment 7% 1% 2% % % % % % % % % % Outbound Traffic Volumes Project Traffic TOTAL TRAFFIC
90 VOLUME DEVELOPMENT SHEET 214th TRACE & OPTIMA GARAGE DRIVE Growth Rate =.5%.5% Peak Season = Buildout Year = Years = 5 5 AM Peak Hour Northbound Southbound Eastbound Westbound LT Thru RT LT Thru RT LT Thru RT LT Thru RT Existing Volume on 1/28/ Peak Season Volume Traffic Volume Growth th Avenue Village Committed Inbound Traffic Assignment Inbound Traffic Volumes 5 Outbound Traffic Assignment Outbound Traffic Volumes -5 Total 7th Avenue Village CVS Committed Inbound Traffic Assignment Inbound Traffic Volumes 1 Outbound Traffic Assignment Outbound Traffic Volumes 1 Total CVS Hallandale Oasis Committed Inbound Traffic Assignment Inbound Traffic Volumes 38 Outbound Traffic Assignment Outbound Traffic Volumes 113 Total Hallandale Oasis Domus Office Committed Inbound Traffic Assignment % % % % % % % % % % % % Inbound Traffic Volumes 275 Outbound Traffic Assignment % % % % % 51% % % % % % % Outbound Traffic Volumes Total Domus Office 26 Hallandale Square Committed Inbound Traffic Assignment Inbound Traffic Volumes 52 Outbound Traffic Assignment Outbound Traffic Volumes 119 Total Hallandale Square Hallandale Artsquare Committed Inbound Traffic Assignment Inbound Traffic Volumes 68 Outbound Traffic Assignment Outbound Traffic Volumes 123 Total Hallandale Artsquare Gulfstream Point Committed Inbound Traffic Assignment Inbound Traffic Volumes 74 Outbound Traffic Assignment Outbound Traffic Volumes 117 Total Gulfstream Point 22 Background Traffic Project Traffic Inbound Traffic Assignment Inbound Traffic Volumes 44 Outbound Traffic Assignment 51.% Outbound Traffic Volumes Project Traffic 35 TOTAL TRAFFIC PM Peak Hour Northbound Southbound Eastbound Westbound LT Thru RT LT Thru RT LT Thru RT LT Thru RT Existing Volume on 1/28/ Peak Season Volume Traffic Volume Growth th Avenue Village Committed Inbound Traffic Assignment % % % % % % % % % % % % Inbound Traffic Volumes 31 Outbound Traffic Assignment % % % % % % % % % % % % Outbound Traffic Volumes 38 Total 7th Avenue Village CVS Committed Inbound Traffic Assignment % % % % % % % % % % % % Inbound Traffic Volumes 4 Outbound Traffic Assignment % % % % % % % % % % % % Outbound Traffic Volumes 4 Total CVS Hallandale Oasis Committed Inbound Traffic Assignment % % % % % % % % % % % % Inbound Traffic Volumes 88 Outbound Traffic Assignment % % % % % % % % % % % % Outbound Traffic Volumes 28 Total Hallandale Oasis Domus Office Committed Inbound Traffic Assignment % % % % % % % % % % % % Inbound Traffic Volumes 114 Outbound Traffic Assignment % % % % % 51% % % % % % % Outbound Traffic Volumes Total Domus Office 142 Hallandale Square Committed Inbound Traffic Assignment % % % % % % % % % % % % Inbound Traffic Volumes 35 Outbound Traffic Assignment % % % % % % % % % % % % Outbound Traffic Volumes 711 Total Hallandale Square Hallandale Artsquare Committed Inbound Traffic Assignment % % % % % % % % % % % % Inbound Traffic Volumes 163 Outbound Traffic Assignment % % % % % % % % % % % % Outbound Traffic Volumes 134 Total Hallandale Artsquare Gulfstream Point Committed Inbound Traffic Assignment % % % % % % % % % % % % Inbound Traffic Volumes 128 Outbound Traffic Assignment % % % % % % % % % % % % Outbound Traffic Volumes 87 Total Gulfstream Point 22 Background Traffic Project Traffic Inbound Traffic Assignment % % % % % % % % % % % % Inbound Traffic Volumes 16 Outbound Traffic Assignment % % % % % 51% % % % % % % Outbound Traffic Volumes Project Traffic 185 TOTAL TRAFFIC
91 VOLUME DEVELOPMENT SHEET OPTIMA OFFICE DRIVEWAY & US 1 Growth Rate =.5%.5% Peak Season = Buildout Year = Years = 5 5 AM Peak Hour Northbound Southbound Eastbound Westbound LT Thru RT LT Thru RT LT Thru RT LT Thru RT Existing Volume on 1/28/215 1,413 2, Peak Season Volume 1,455 2, Traffic Volume Growth 1,492 2, th Avenue Village Committed Inbound Traffic Assignment 5% Inbound Traffic Volumes 5 Outbound Traffic Assignment 5% Outbound Traffic Volumes -5 Total 7th Avenue Village CVS Committed Inbound Traffic Assignment Inbound Traffic Volumes 1 Outbound Traffic Assignment Outbound Traffic Volumes 1 Total CVS Hallandale Oasis Committed Inbound Traffic Assignment 1% Inbound Traffic Volumes 4 38 Outbound Traffic Assignment 1% Outbound Traffic Volumes Total Hallandale Oasis 4 11 Domus Office Committed Inbound Traffic Assignment 3% % % % % 7% % % % % % % Inbound Traffic Volumes Outbound Traffic Assignment % % % % % % 17% % 3% % % % Outbound Traffic Volumes Total Domus Office Hallandale Square Committed Inbound Traffic Assignment 3% Inbound Traffic Volumes Outbound Traffic Assignment 5% Outbound Traffic Volumes Total Hallandale Square 16 6 Hallandale Artsquare Committed Inbound Traffic Assignment Inbound Traffic Volumes 68 Outbound Traffic Assignment Outbound Traffic Volumes 123 Total Hallandale Artsquare Gulfstream Point Committed Inbound Traffic Assignment 48% Inbound Traffic Volumes Outbound Traffic Assignment 25% 69% Outbound Traffic Volumes Total Gulfstream Point Background Traffic 83 1,577 2, Project Traffic Inbound Traffic Assignment 3.% 7.% Inbound Traffic Volumes Outbound Traffic Assignment 17.% 3.% Outbound Traffic Volumes Project Traffic TOTAL TRAFFIC 24 1,577 2, PM Peak Hour Northbound Southbound Eastbound Westbound LT Thru RT LT Thru RT LT Thru RT LT Thru RT Existing Volume on 1/28/215 2,73 1, Peak Season Volume 2,135 1, Traffic Volume Growth 2,189 1, th Avenue Village Committed Inbound Traffic Assignment % 5% % % % % % % % % % % Inbound Traffic Volumes 2 31 Outbound Traffic Assignment % % % % 5% % % % % % % % Outbound Traffic Volumes 2 38 Total 7th Avenue Village 2 2 CVS Committed Inbound Traffic Assignment % % % % % % % % % % % % Inbound Traffic Volumes 4 Outbound Traffic Assignment % % % % % % % % % % % % Outbound Traffic Volumes 4 Total CVS Hallandale Oasis Committed Inbound Traffic Assignment % 1% % % % % % % % % % % Inbound Traffic Volumes 9 88 Outbound Traffic Assignment % % % % 1% % % % % % % % Outbound Traffic Volumes Total Hallandale Oasis 9 21 Domus Office Committed Inbound Traffic Assignment 3% % % % % 7% % % % % % % Inbound Traffic Volumes Outbound Traffic Assignment % % % % % % 17% % 3% % % % Outbound Traffic Volumes Total Domus Office Hallandale Square Committed Inbound Traffic Assignment % 3% % % % % % % % % % % Inbound Traffic Volumes Outbound Traffic Assignment % % % % 5% % % % % % % % Outbound Traffic Volumes Total Hallandale Square Hallandale Artsquare Committed Inbound Traffic Assignment % % % % % % % % % % % % Inbound Traffic Volumes 163 Outbound Traffic Assignment % % % % % % % % % % % % Outbound Traffic Volumes 134 Total Hallandale Artsquare Gulfstream Point Committed Inbound Traffic Assignment % 48% % % % % % % % % % % Inbound Traffic Volumes Outbound Traffic Assignment % 25% % % 69% % % % % % % % Outbound Traffic Volumes Total Gulfstream Point Background Traffic 34 2,388 2, Project Traffic Inbound Traffic Assignment 3% % % % % 7% % % % % % % Inbound Traffic Volumes Outbound Traffic Assignment % % % % % % 17% % 3% % % % Outbound Traffic Volumes Project Traffic TOTAL TRAFFIC 66 2,388 2,
92 Traffic Impact Analysis APPENDIX G: SIGNAL TIMING WORKSHEETS k:\wpb_tpto\141\14193 optima plaza north\tia\ tia resubmittal\ optima plaza north tia.doc
93
94
95
96
97
98
99
100
101
102
103
104
105
106
107
108
109
110
111
112
113
114
115
116
117
118
119
120
121
122
123
124
125
126
127
128
129
130
131
132
133
134
135
136
137
138
139
140
141
142
143
144
145
146
147
148 Traffic Impact Analysis APPENDIX H: INTERSECTION ANALYSIS k:\wpb_tpto\141\14193 optima plaza north\tia\ tia resubmittal\ optima plaza north tia.doc
149 Queues Future Total PM 1: Biscayne Boulevard & NE 213th Street 1/6/216 Lane Group WBL WBR NBT NBR SBL SBT Lane Group Flow (vph) v/c Ratio Control Delay Queue Delay Total Delay Queue Length 5th (ft) 142 ~ Queue Length 95th (ft) # Internal Link Dist (ft) Turn Bay Length (ft) Base Capacity (vph) Starvation Cap Reductn Spillback Cap Reductn Storage Cap Reductn Reduced v/c Ratio ~ Volume exceeds capacity, queue is theoretically infinite. Queue shown is maximum after two cycles. # 95th percentile volume exceeds capacity, queue may be longer. Queue shown is maximum after two cycles. Page 1
150 HCM Signalized Intersection Capacity Analysis Future Total PM 1: Biscayne Boulevard & NE 213th Street 1/6/216 Movement WBL WBR NBT NBR SBL SBT Lane Configurations Traffic Volume (vph) Future Volume (vph) Ideal Flow (vphpl) Total Lost time (s) Lane Util. Factor Frt Flt Protected Satd. Flow (prot) Flt Permitted Satd. Flow (perm) Peak-hour factor, PHF Adj. Flow (vph) RTOR Reduction (vph) Lane Group Flow (vph) Turn Type Prot Perm NA Perm Prot NA Protected Phases Permitted Phases 8 2 Actuated Green, G (s) Effective Green, g (s) Actuated g/c Ratio Clearance Time (s) Vehicle Extension (s) Lane Grp Cap (vph) v/s Ratio Prot c.8 c.51 c v/s Ratio Perm.2.8 v/c Ratio Uniform Delay, d Progression Factor Incremental Delay, d Delay (s) Level of Service E E D C E A Approach Delay (s) Approach LOS E D B HCM 2 Control Delay 38.3 HCM 2 Level of Service D HCM 2 Volume to Capacity ratio.92 Actuated Cycle Length (s) 16. Sum of lost time (s) 13.5 Intersection Capacity Utilization 87.1% ICU Level of Service E Analysis Period (min) 15 c Critical Lane Group Page 2
151 Queues Future Total PM 2: US 1 & SE 9th Street 1/6/216 Lane Group EBT WBL WBT WBR NBL NBT NBR SBL SBT Lane Group Flow (vph) v/c Ratio Control Delay Queue Delay Total Delay Queue Length 5th (ft) Queue Length 95th (ft) Internal Link Dist (ft) Turn Bay Length (ft) Base Capacity (vph) Starvation Cap Reductn Spillback Cap Reductn Storage Cap Reductn Reduced v/c Ratio Page 3
152 HCM Signalized Intersection Capacity Analysis Future Total PM 2: US 1 & SE 9th Street 1/6/216 Movement EBL EBT EBR WBL WBT WBR NBL NBT NBR SBL SBT SBR Lane Configurations Traffic Volume (vph) Future Volume (vph) Ideal Flow (vphpl) Total Lost time (s) Lane Util. Factor Frt Flt Protected Satd. Flow (prot) Flt Permitted Satd. Flow (perm) Peak-hour factor, PHF Adj. Flow (vph) RTOR Reduction (vph) Lane Group Flow (vph) Turn Type Split NA Split NA Prot Prot NA Perm Prot NA Protected Phases Permitted Phases 2 Actuated Green, G (s) Effective Green, g (s) Actuated g/c Ratio Clearance Time (s) Vehicle Extension (s) Lane Grp Cap (vph) v/s Ratio Prot c.1.5 c.5. c.7 c v/s Ratio Perm.2 v/c Ratio Uniform Delay, d Progression Factor Incremental Delay, d Delay (s) Level of Service E F F E F C A E C Approach Delay (s) Approach LOS E E C C HCM 2 Control Delay 26.8 HCM 2 Level of Service C HCM 2 Volume to Capacity ratio.8 Actuated Cycle Length (s) Sum of lost time (s) 27. Intersection Capacity Utilization 83.1% ICU Level of Service E Analysis Period (min) 15 c Critical Lane Group Page 4
153 Queues Future Total PM 3: US 1 & 3 rd Street 1/6/216 Lane Group EBL EBT WBL WBT WBR NBL NBT NBR SBL SBT Lane Group Flow (vph) v/c Ratio Control Delay Queue Delay Total Delay Queue Length 5th (ft) ~ Queue Length 95th (ft) #1526 m61 m#967 Internal Link Dist (ft) Turn Bay Length (ft) Base Capacity (vph) Starvation Cap Reductn Spillback Cap Reductn Storage Cap Reductn Reduced v/c Ratio ~ Volume exceeds capacity, queue is theoretically infinite. Queue shown is maximum after two cycles. # 95th percentile volume exceeds capacity, queue may be longer. Queue shown is maximum after two cycles. m Volume for 95th percentile queue is metered by upstream signal. Page 5
154 HCM Signalized Intersection Capacity Analysis Future Total PM 3: US 1 & 3 rd Street 1/6/216 Movement EBL EBT EBR WBL WBT WBR NBL NBT NBR SBL SBT SBR Lane Configurations Traffic Volume (vph) Future Volume (vph) Ideal Flow (vphpl) Total Lost time (s) Lane Util. Factor Frt Flt Protected Satd. Flow (prot) Flt Permitted Satd. Flow (perm) Peak-hour factor, PHF Adj. Flow (vph) RTOR Reduction (vph) Lane Group Flow (vph) Turn Type Split NA Split NA Prot Prot NA Perm Prot NA Protected Phases Permitted Phases 2 Actuated Green, G (s) Effective Green, g (s) Actuated g/c Ratio Clearance Time (s) Vehicle Extension (s) Lane Grp Cap (vph) v/s Ratio Prot c.1.1 c c.8 c v/s Ratio Perm.1 v/c Ratio Uniform Delay, d Progression Factor Incremental Delay, d Delay (s) Level of Service E E E D D F F C E E Approach Delay (s) Approach LOS E E F E HCM 2 Control Delay 86.7 HCM 2 Level of Service F HCM 2 Volume to Capacity ratio 1.1 Actuated Cycle Length (s) 16. Sum of lost time (s) 26. Intersection Capacity Utilization 99.7% ICU Level of Service F Analysis Period (min) 15 c Critical Lane Group Page 6
155 Queues Future Total PM 4: Dixie Highway & 3rd Street 1/6/216 Lane Group EBT WBT SBL SBT Lane Group Flow (vph) v/c Ratio Control Delay Queue Delay Total Delay Queue Length 5th (ft) Queue Length 95th (ft) 189 m Internal Link Dist (ft) Turn Bay Length (ft) Base Capacity (vph) Starvation Cap Reductn 246 Spillback Cap Reductn 15 Storage Cap Reductn Reduced v/c Ratio m Volume for 95th percentile queue is metered by upstream signal. Page 7
156 HCM Signalized Intersection Capacity Analysis Future Total PM 4: Dixie Highway & 3rd Street 1/6/216 Movement EBL EBT EBR WBL WBT WBR NBL NBT NBR SBL SBT SBR Lane Configurations Traffic Volume (vph) Future Volume (vph) Ideal Flow (vphpl) Total Lost time (s) Lane Util. Factor Frt Flt Protected Satd. Flow (prot) Flt Permitted Satd. Flow (perm) Peak-hour factor, PHF Adj. Flow (vph) RTOR Reduction (vph) 5 13 Lane Group Flow (vph) Turn Type NA Prot NA Split NA Protected Phases Permitted Phases Actuated Green, G (s) Effective Green, g (s) Actuated g/c Ratio Clearance Time (s) 4.5 Vehicle Extension (s) 3. Lane Grp Cap (vph) v/s Ratio Prot c.9 c.16 c v/s Ratio Perm.9 v/c Ratio Uniform Delay, d Progression Factor Incremental Delay, d Delay (s) Level of Service D A D D Approach Delay (s) Approach LOS D A A D HCM 2 Control Delay 31.7 HCM 2 Level of Service C HCM 2 Volume to Capacity ratio.43 Actuated Cycle Length (s) Sum of lost time (s) 16.5 Intersection Capacity Utilization 53.% ICU Level of Service A Analysis Period (min) 15 c Critical Lane Group Page 8
157 Queues Future Total PM 5: 1st Avenue & 3rd Street 1/6/216 Lane Group EBT WBT WBR NBT Lane Group Flow (vph) v/c Ratio Control Delay Queue Delay Total Delay Queue Length 5th (ft) Queue Length 95th (ft) #576 Internal Link Dist (ft) Turn Bay Length (ft) Base Capacity (vph) Starvation Cap Reductn 221 Spillback Cap Reductn Storage Cap Reductn Reduced v/c Ratio # 95th percentile volume exceeds capacity, queue may be longer. Queue shown is maximum after two cycles. Page 9
158 HCM Signalized Intersection Capacity Analysis Future Total PM 5: 1st Avenue & 3rd Street 1/6/216 Movement EBL EBT EBR WBL WBT WBR NBL NBT NBR SBL SBT SBR Lane Configurations Traffic Volume (vph) Future Volume (vph) Ideal Flow (vphpl) Total Lost time (s) Lane Util. Factor Frt Flt Protected Satd. Flow (prot) Flt Permitted Satd. Flow (perm) Peak-hour factor, PHF Adj. Flow (vph) RTOR Reduction (vph) 13 1 Lane Group Flow (vph) Turn Type Prot NA NA Perm Split NA Protected Phases Permitted Phases 7 Actuated Green, G (s) Effective Green, g (s) Actuated g/c Ratio Clearance Time (s) Vehicle Extension (s) Lane Grp Cap (vph) v/s Ratio Prot c.12 c.12 c.27 v/s Ratio Perm.8.2 v/c Ratio Uniform Delay, d Progression Factor Incremental Delay, d Delay (s) Level of Service A D D E Approach Delay (s) Approach LOS A D E A HCM 2 Control Delay 42.2 HCM 2 Level of Service D HCM 2 Volume to Capacity ratio.59 Actuated Cycle Length (s) Sum of lost time (s) 16.5 Intersection Capacity Utilization 63.8% ICU Level of Service B Analysis Period (min) 15 c Critical Lane Group Page 1
159 Queues Future Total PM 6: US 1 & Hallandale Beach Boulevard 1/6/216 Lane Group EBL EBT WBL WBT NBL NBT NBR SBL SBT Lane Group Flow (vph) v/c Ratio Control Delay Queue Delay Total Delay Queue Length 5th (ft) ~477 ~63 ~ ~ Queue Length 95th (ft) #312 #578 m#536 m#629 m#49 m287 m3 # Internal Link Dist (ft) Turn Bay Length (ft) Base Capacity (vph) Starvation Cap Reductn Spillback Cap Reductn Storage Cap Reductn Reduced v/c Ratio ~ Volume exceeds capacity, queue is theoretically infinite. Queue shown is maximum after two cycles. # 95th percentile volume exceeds capacity, queue may be longer. Queue shown is maximum after two cycles. m Volume for 95th percentile queue is metered by upstream signal. Page 11
160 HCM Signalized Intersection Capacity Analysis Future Total PM 6: US 1 & Hallandale Beach Boulevard 1/6/216 Movement EBL EBT EBR WBL WBT WBR NBL NBT NBR SBL SBT SBR Lane Configurations Traffic Volume (vph) Future Volume (vph) Ideal Flow (vphpl) Total Lost time (s) Lane Util. Factor Frt Flt Protected Satd. Flow (prot) Flt Permitted Satd. Flow (perm) Peak-hour factor, PHF Adj. Flow (vph) RTOR Reduction (vph) Lane Group Flow (vph) Turn Type Prot NA Prot NA Prot NA pm+ov Prot NA Protected Phases Permitted Phases 2 Actuated Green, G (s) Effective Green, g (s) Actuated g/c Ratio Clearance Time (s) Vehicle Extension (s) Lane Grp Cap (vph) v/s Ratio Prot c.19 c.3 c.19 c v/s Ratio Perm.16 v/c Ratio Uniform Delay, d Progression Factor Incremental Delay, d Delay (s) Level of Service F D F E F E A F E Approach Delay (s) Approach LOS E F F E HCM 2 Control Delay 93.4 HCM 2 Level of Service F HCM 2 Volume to Capacity ratio 1.11 Actuated Cycle Length (s) 16. Sum of lost time (s) 28. Intersection Capacity Utilization 99.1% ICU Level of Service F Analysis Period (min) 15 c Critical Lane Group Page 12
161 Queues Future Total PM 7: Hallandale Beach Boulevard & Dixie Highway 1/6/216 Lane Group EBT WBL WBT SBT Lane Group Flow (vph) v/c Ratio Control Delay Queue Delay Total Delay Queue Length 5th (ft) Queue Length 95th (ft) 484 m94 m Internal Link Dist (ft) Turn Bay Length (ft) Base Capacity (vph) Starvation Cap Reductn Spillback Cap Reductn 24 1 Storage Cap Reductn Reduced v/c Ratio m Volume for 95th percentile queue is metered by upstream signal. Page 13
162 HCM Signalized Intersection Capacity Analysis Future Total PM 7: Hallandale Beach Boulevard & Dixie Highway 1/6/216 Movement EBL EBT EBR WBL WBT WBR NBL NBT NBR SBL SBT SBR Lane Configurations Traffic Volume (vph) Future Volume (vph) Ideal Flow (vphpl) Total Lost time (s) Lane Util. Factor Frt Flt Protected Satd. Flow (prot) Flt Permitted Satd. Flow (perm) Peak-hour factor, PHF Adj. Flow (vph) RTOR Reduction (vph) 6 19 Lane Group Flow (vph) Turn Type NA Prot NA Perm NA Protected Phases Permitted Phases 4 Actuated Green, G (s) Effective Green, g (s) Actuated g/c Ratio Clearance Time (s) Vehicle Extension (s) Lane Grp Cap (vph) v/s Ratio Prot.28.6 c.44 v/s Ratio Perm.1 v/c Ratio Uniform Delay, d Progression Factor Incremental Delay, d Delay (s) Level of Service D F B E Approach Delay (s) Approach LOS D B A E HCM 2 Control Delay 32.1 HCM 2 Level of Service C HCM 2 Volume to Capacity ratio.63 Actuated Cycle Length (s) 16. Sum of lost time (s) 22.5 Intersection Capacity Utilization 14.3% ICU Level of Service G Analysis Period (min) 15 c Critical Lane Group Page 14
163 Queues Future Total PM 8: 1st Avenue & Hallandale Beach Boulevard 1/6/216 Lane Group EBL EBT WBT NBL NBT NBR Lane Group Flow (vph) v/c Ratio Control Delay Queue Delay Total Delay Queue Length 5th (ft) 45 2 ~ Queue Length 95th (ft) m7 2 m755 #792 # Internal Link Dist (ft) Turn Bay Length (ft) Base Capacity (vph) Starvation Cap Reductn Spillback Cap Reductn Storage Cap Reductn Reduced v/c Ratio ~ Volume exceeds capacity, queue is theoretically infinite. Queue shown is maximum after two cycles. # 95th percentile volume exceeds capacity, queue may be longer. Queue shown is maximum after two cycles. m Volume for 95th percentile queue is metered by upstream signal. Page 15
164 HCM Signalized Intersection Capacity Analysis Future Total PM 8: 1st Avenue & Hallandale Beach Boulevard 1/6/216 Movement EBL EBT EBR WBL WBT WBR NBL NBT NBR SBL SBT SBR Lane Configurations Traffic Volume (vph) Future Volume (vph) Ideal Flow (vphpl) Total Lost time (s) Lane Util. Factor Frt Flt Protected Satd. Flow (prot) Flt Permitted Satd. Flow (perm) Peak-hour factor, PHF Adj. Flow (vph) RTOR Reduction (vph) 1 74 Lane Group Flow (vph) Turn Type Prot NA NA Split NA Prot Protected Phases Permitted Phases Actuated Green, G (s) Effective Green, g (s) Actuated g/c Ratio Clearance Time (s) Vehicle Extension (s) Lane Grp Cap (vph) v/s Ratio Prot.3 c.27 c.4 c v/s Ratio Perm v/c Ratio Uniform Delay, d Progression Factor Incremental Delay, d Delay (s) Level of Service C A E F F D Approach Delay (s) Approach LOS A E F A HCM 2 Control Delay 44.6 HCM 2 Level of Service D HCM 2 Volume to Capacity ratio.91 Actuated Cycle Length (s) 16. Sum of lost time (s) 22.5 Intersection Capacity Utilization 14.3% ICU Level of Service G Analysis Period (min) 15 c Critical Lane Group Page 16
165 Queues Future Total PM 9: Hallandale Beach Boulevard & E 8th Avenue 1/6/216 Lane Group EBT EBR WBL WBT NBT SBL SBT SBR Lane Group Flow (vph) v/c Ratio Control Delay Queue Delay Total Delay Queue Length 5th (ft) ~ Queue Length 95th (ft) m366 m47 m # Internal Link Dist (ft) Turn Bay Length (ft) Base Capacity (vph) Starvation Cap Reductn Spillback Cap Reductn Storage Cap Reductn Reduced v/c Ratio ~ Volume exceeds capacity, queue is theoretically infinite. Queue shown is maximum after two cycles. # 95th percentile volume exceeds capacity, queue may be longer. Queue shown is maximum after two cycles. m Volume for 95th percentile queue is metered by upstream signal. Page 17
166 HCM Signalized Intersection Capacity Analysis Future Total PM 9: Hallandale Beach Boulevard & E 8th Avenue 1/6/216 Movement EBL EBT EBR WBL WBT WBR NBL NBT NBR SBL SBT SBR Lane Configurations Traffic Volume (vph) Future Volume (vph) Ideal Flow (vphpl) Total Lost time (s) Lane Util. Factor Frt Flt Protected Satd. Flow (prot) Flt Permitted Satd. Flow (perm) Peak-hour factor, PHF Adj. Flow (vph) RTOR Reduction (vph) Lane Group Flow (vph) Turn Type NA Perm pm+pt NA Split NA Split NA Perm Protected Phases Permitted Phases Actuated Green, G (s) Effective Green, g (s) Actuated g/c Ratio Clearance Time (s) Vehicle Extension (s) Lane Grp Cap (vph) v/s Ratio Prot.34.2 c.39 c.28 c.7.1 v/s Ratio Perm v/c Ratio Uniform Delay, d Progression Factor Incremental Delay, d Delay (s) Level of Service C C E C F D D D Approach Delay (s) Approach LOS C C F D HCM 2 Control Delay 68.6 HCM 2 Level of Service E HCM 2 Volume to Capacity ratio.83 Actuated Cycle Length (s) 16. Sum of lost time (s) 17. Intersection Capacity Utilization 79.7% ICU Level of Service D Analysis Period (min) 15 c Critical Lane Group Page 18
167 Queues Future Total PM 1: Hallandale Beach Boulevard & E 1th Avenue 1/6/216 Lane Group EBL EBT EBR WBL WBT WBR NBL NBT NBR SBT Lane Group Flow (vph) v/c Ratio Control Delay Queue Delay Total Delay Queue Length 5th (ft) Queue Length 95th (ft) m216 m68 m Internal Link Dist (ft) Turn Bay Length (ft) Base Capacity (vph) Starvation Cap Reductn 3 Spillback Cap Reductn Storage Cap Reductn Reduced v/c Ratio m Volume for 95th percentile queue is metered by upstream signal. Page 19
168 HCM Signalized Intersection Capacity Analysis Future Total PM 1: Hallandale Beach Boulevard & E 1th Avenue 1/6/216 Movement EBL EBT EBR WBL WBT WBR NBL NBT NBR SBL SBT SBR Lane Configurations Traffic Volume (vph) Future Volume (vph) Ideal Flow (vphpl) Total Lost time (s) Lane Util. Factor Frt Flt Protected Satd. Flow (prot) Flt Permitted Satd. Flow (perm) Peak-hour factor, PHF Adj. Flow (vph) RTOR Reduction (vph) Lane Group Flow (vph) Turn Type Prot NA Perm Prot NA Perm Prot NA Perm Protected Phases Permitted Phases Actuated Green, G (s) Effective Green, g (s) Actuated g/c Ratio Clearance Time (s) Vehicle Extension (s) Lane Grp Cap (vph) v/s Ratio Prot c c v/s Ratio Perm.2.5 c.16 v/c Ratio Uniform Delay, d Progression Factor Incremental Delay, d Delay (s) Level of Service F A A E D C D D D E Approach Delay (s) Approach LOS B D D E HCM 2 Control Delay 31.4 HCM 2 Level of Service C HCM 2 Volume to Capacity ratio.66 Actuated Cycle Length (s) 16. Sum of lost time (s) 13.5 Intersection Capacity Utilization Err% ICU Level of Service H Analysis Period (min) 15 c Critical Lane Group Page 2
169 Queues Future Total PM 11: Dixie Highway & County Line Road 1/6/216 Lane Group EBT WBT NBL NBR SBL SBT SBR Lane Group Flow (vph) v/c Ratio Control Delay Queue Delay Total Delay Queue Length 5th (ft) 64 ~ Queue Length 95th (ft) 19 m# Internal Link Dist (ft) Turn Bay Length (ft) Base Capacity (vph) Starvation Cap Reductn Spillback Cap Reductn 16 6 Storage Cap Reductn Reduced v/c Ratio ~ Volume exceeds capacity, queue is theoretically infinite. Queue shown is maximum after two cycles. # 95th percentile volume exceeds capacity, queue may be longer. Queue shown is maximum after two cycles. m Volume for 95th percentile queue is metered by upstream signal. Page 21
170 HCM Signalized Intersection Capacity Analysis Future Total PM 11: Dixie Highway & County Line Road 1/6/216 Movement EBL EBT EBR WBL WBT WBR NBL NBT NBR SBL SBT SBR Lane Configurations Traffic Volume (vph) Future Volume (vph) Ideal Flow (vphpl) Total Lost time (s) Lane Util. Factor Frt Flt Protected Satd. Flow (prot) Flt Permitted Satd. Flow (perm) Peak-hour factor, PHF Adj. Flow (vph) RTOR Reduction (vph) Lane Group Flow (vph) Turn Type NA Split NA D.Pm Prot custom NA Perm Protected Phases Permitted Phases Actuated Green, G (s) Effective Green, g (s) Actuated g/c Ratio Clearance Time (s) Vehicle Extension (s) Lane Grp Cap (vph) v/s Ratio Prot c.6 c c.26 v/s Ratio Perm v/c Ratio Uniform Delay, d Progression Factor Incremental Delay, d Delay (s) Level of Service D D C C B B B Approach Delay (s) Approach LOS D D C B HCM 2 Control Delay 3.6 HCM 2 Level of Service C HCM 2 Volume to Capacity ratio.75 Actuated Cycle Length (s) 91.1 Sum of lost time (s) 18. Intersection Capacity Utilization 72.4% ICU Level of Service C Analysis Period (min) 15 c Critical Lane Group Page 22
171 Queues Future Total PM 12: County Line Road & 1st Avenue 1/6/216 Lane Group EBL EBR NBL NBT SBT SBR Lane Group Flow (vph) v/c Ratio Control Delay Queue Delay Total Delay Queue Length 5th (ft) Queue Length 95th (ft) 45 #431 # Internal Link Dist (ft) Turn Bay Length (ft) Base Capacity (vph) Starvation Cap Reductn Spillback Cap Reductn 9 9 Storage Cap Reductn Reduced v/c Ratio # 95th percentile volume exceeds capacity, queue may be longer. Queue shown is maximum after two cycles. Page 23
172 HCM Signalized Intersection Capacity Analysis Future Total PM 12: County Line Road & 1st Avenue 1/6/216 Movement EBL EBR NBL NBT SBT SBR Lane Configurations Traffic Volume (vph) Future Volume (vph) Ideal Flow (vphpl) Total Lost time (s) Lane Util. Factor Frt Flt Protected Satd. Flow (prot) Flt Permitted Satd. Flow (perm) Peak-hour factor, PHF Adj. Flow (vph) RTOR Reduction (vph) Lane Group Flow (vph) Turn Type Prot Prot Perm NA NA Prot Protected Phases Permitted Phases 8 Actuated Green, G (s) Effective Green, g (s) Actuated g/c Ratio Clearance Time (s) Vehicle Extension (s) Lane Grp Cap (vph) v/s Ratio Prot c v/s Ratio Perm c.26 v/c Ratio Uniform Delay, d Progression Factor Incremental Delay, d Delay (s) Level of Service A A E D C C Approach Delay (s) Approach LOS A D C HCM 2 Control Delay 25. HCM 2 Level of Service C HCM 2 Volume to Capacity ratio.65 Actuated Cycle Length (s) 91.1 Sum of lost time (s) 18. Intersection Capacity Utilization 56.4% ICU Level of Service B Analysis Period (min) 15 c Critical Lane Group Page 24
173 HCM Unsignalized Intersection Capacity Analysis Future Total PM 13: E 1st Avenue & NE 214th Terr 1/6/216 Movement WBL WBR NBT NBR SBL SBT Lane Configurations Traffic Volume (veh/h) Future Volume (Veh/h) Sign Control Stop Free Free Grade % % % Peak Hour Factor Hourly flow rate (vph) Pedestrians Lane Width (ft) Walking Speed (ft/s) Percent Blockage Right turn flare (veh) Median type None None Median storage veh) Upstream signal (ft) 144 px, platoon unblocked vc, conflicting volume vc1, stage 1 conf vol vc2, stage 2 conf vol vcu, unblocked vol tc, single (s) tc, 2 stage (s) tf (s) p queue free % cm capacity (veh/h) Direction, Lane # WB 1 NB 1 SB 1 Volume Total Volume Left Volume Right csh Volume to Capacity... Queue Length 95th (ft) Control Delay (s)... Lane LOS A Approach Delay (s)... Approach LOS A Average Delay. Intersection Capacity Utilization.% ICU Level of Service A Analysis Period (min) 15 Page 25
174 HCM Unsignalized Intersection Capacity Analysis Future Total PM 14: SE 3rd Ave & SE 1th Ct 1/6/216 Movement EBL EBT EBR WBL WBT WBR NBL NBT NBR SBL SBT SBR Lane Configurations Traffic Volume (veh/h) Future Volume (Veh/h) Sign Control Free Free Stop Stop Grade % % % % Peak Hour Factor Hourly flow rate (vph) Pedestrians Lane Width (ft) Walking Speed (ft/s) Percent Blockage Right turn flare (veh) Median type None None Median storage veh) Upstream signal (ft) px, platoon unblocked vc, conflicting volume vc1, stage 1 conf vol vc2, stage 2 conf vol vcu, unblocked vol tc, single (s) tc, 2 stage (s) tf (s) p queue free % cm capacity (veh/h) Direction, Lane # EB 1 WB 1 NB 1 SB 1 Volume Total Volume Left Volume Right csh Volume to Capacity Queue Length 95th (ft) Control Delay (s) Lane LOS A A B B Approach Delay (s) Approach LOS B B Average Delay 7.8 Intersection Capacity Utilization 4.9% ICU Level of Service A Analysis Period (min) 15 Page 26
175 HCM Unsignalized Intersection Capacity Analysis Future Total PM 37: NE 214th Terr & SE 3rd Ave 1/6/216 Movement EBL EBT WBT WBR SBL SBR Lane Configurations Traffic Volume (veh/h) Future Volume (Veh/h) Sign Control Free Free Stop Grade % % % Peak Hour Factor Hourly flow rate (vph) Pedestrians Lane Width (ft) Walking Speed (ft/s) Percent Blockage Right turn flare (veh) Median type None None Median storage veh) Upstream signal (ft) px, platoon unblocked vc, conflicting volume vc1, stage 1 conf vol vc2, stage 2 conf vol vcu, unblocked vol tc, single (s) tc, 2 stage (s) tf (s) p queue free % cm capacity (veh/h) Direction, Lane # EB 1 WB 1 SB 1 Volume Total Volume Left 1 Volume Right csh Volume to Capacity Queue Length 95th (ft) 51 Control Delay (s) Lane LOS B Approach Delay (s) Approach LOS B Average Delay 1.3 Intersection Capacity Utilization 35.3% ICU Level of Service A Analysis Period (min) 15 Page 27
176 HCM Unsignalized Intersection Capacity Analysis Future Total PM 41: Optima Office Drive 1/6/216 Movement EBL EBR NBL NBT SBT SBR Lane Configurations Traffic Volume (veh/h) Future Volume (Veh/h) Sign Control Stop Free Free Grade % % % Peak Hour Factor Hourly flow rate (vph) Pedestrians Lane Width (ft) Walking Speed (ft/s) Percent Blockage Right turn flare (veh) Median type None None Median storage veh) Upstream signal (ft) px, platoon unblocked vc, conflicting volume vc1, stage 1 conf vol vc2, stage 2 conf vol vcu, unblocked vol 1341 tc, single (s) tc, 2 stage (s) tf (s) p queue free % 1 78 cm capacity (veh/h) Direction, Lane # EB 1 NB 1 NB 2 NB 3 NB 4 SB 1 SB 2 SB 3 Volume Total Volume Left 72 Volume Right csh Volume to Capacity Queue Length 95th (ft) Control Delay (s) Lane LOS F C Approach Delay (s) Approach LOS F Average Delay 1.1 Intersection Capacity Utilization 93.5% ICU Level of Service F Analysis Period (min) 15 Page 28
177 HCM Unsignalized Intersection Capacity Analysis Future Total PM 46: Optima Drive 1/6/216 Movement EBL EBT WBT WBR SBL SBR Lane Configurations Traffic Volume (veh/h) Future Volume (Veh/h) Sign Control Free Free Stop Grade % % % Peak Hour Factor Hourly flow rate (vph) Pedestrians Lane Width (ft) Walking Speed (ft/s) Percent Blockage Right turn flare (veh) Median type None None Median storage veh) Upstream signal (ft) px, platoon unblocked vc, conflicting volume vc1, stage 1 conf vol vc2, stage 2 conf vol vcu, unblocked vol tc, single (s) tc, 2 stage (s) tf (s) p queue free % cm capacity (veh/h) Direction, Lane # EB 1 WB 1 SB 1 Volume Total Volume Left Volume Right csh Volume to Capacity... Queue Length 95th (ft) Control Delay (s)... Lane LOS A Approach Delay (s)... Approach LOS A Average Delay. Intersection Capacity Utilization.% ICU Level of Service A Analysis Period (min) 15 Page 29
178 Queues Future Background PM 1: Biscayne Boulevard & NE 213th Street 1/6/216 Lane Group WBL WBR NBT NBR SBL SBT Lane Group Flow (vph) v/c Ratio Control Delay Queue Delay Total Delay Queue Length 5th (ft) Queue Length 95th (ft) # Internal Link Dist (ft) Turn Bay Length (ft) Base Capacity (vph) Starvation Cap Reductn Spillback Cap Reductn Storage Cap Reductn Reduced v/c Ratio # 95th percentile volume exceeds capacity, queue may be longer. Queue shown is maximum after two cycles. Page 1
179 HCM Signalized Intersection Capacity Analysis Future Background PM 1: Biscayne Boulevard & NE 213th Street 1/6/216 Movement WBL WBR NBT NBR SBL SBT Lane Configurations Traffic Volume (vph) Future Volume (vph) Ideal Flow (vphpl) Total Lost time (s) Lane Util. Factor Frt Flt Protected Satd. Flow (prot) Flt Permitted Satd. Flow (perm) Peak-hour factor, PHF Adj. Flow (vph) RTOR Reduction (vph) Lane Group Flow (vph) Turn Type Prot Perm NA Perm Prot NA Protected Phases Permitted Phases 8 2 Actuated Green, G (s) Effective Green, g (s) Actuated g/c Ratio Clearance Time (s) Vehicle Extension (s) Lane Grp Cap (vph) v/s Ratio Prot c.8 c.51 c v/s Ratio Perm.2.8 v/c Ratio Uniform Delay, d Progression Factor Incremental Delay, d Delay (s) Level of Service E E D B E A Approach Delay (s) Approach LOS E D B HCM 2 Control Delay 33.2 HCM 2 Level of Service C HCM 2 Volume to Capacity ratio.89 Actuated Cycle Length (s) 16. Sum of lost time (s) 13.5 Intersection Capacity Utilization 84.5% ICU Level of Service E Analysis Period (min) 15 c Critical Lane Group Page 2
180 Queues Future Background PM 2: US 1 & SE 9th Street 1/6/216 Lane Group EBT WBL WBT WBR NBL NBT NBR SBL SBT Lane Group Flow (vph) v/c Ratio Control Delay Queue Delay Total Delay Queue Length 5th (ft) Queue Length 95th (ft) Internal Link Dist (ft) Turn Bay Length (ft) Base Capacity (vph) Starvation Cap Reductn Spillback Cap Reductn Storage Cap Reductn Reduced v/c Ratio Page 3
181 HCM Signalized Intersection Capacity Analysis Future Background PM 2: US 1 & SE 9th Street 1/6/216 Movement EBL EBT EBR WBL WBT WBR NBL NBT NBR SBL SBT SBR Lane Configurations Traffic Volume (vph) Future Volume (vph) Ideal Flow (vphpl) Total Lost time (s) Lane Util. Factor Frt Flt Protected Satd. Flow (prot) Flt Permitted Satd. Flow (perm) Peak-hour factor, PHF Adj. Flow (vph) RTOR Reduction (vph) Lane Group Flow (vph) Turn Type Split NA Split NA Prot Prot NA Perm Prot NA Protected Phases Permitted Phases 2 Actuated Green, G (s) Effective Green, g (s) Actuated g/c Ratio Clearance Time (s) Vehicle Extension (s) Lane Grp Cap (vph) v/s Ratio Prot c.1.5 c.5. c.7 c v/s Ratio Perm.2 v/c Ratio Uniform Delay, d Progression Factor Incremental Delay, d Delay (s) Level of Service E F F E F B A E C Approach Delay (s) Approach LOS E E C C HCM 2 Control Delay 24.4 HCM 2 Level of Service C HCM 2 Volume to Capacity ratio.73 Actuated Cycle Length (s) Sum of lost time (s) 27. Intersection Capacity Utilization 77.6% ICU Level of Service D Analysis Period (min) 15 c Critical Lane Group Page 4
182 Queues Future Background PM 3: US 1 & 3 rd Street 1/6/216 Lane Group EBL EBT WBL WBT WBR NBL NBT NBR SBL SBT Lane Group Flow (vph) v/c Ratio Control Delay Queue Delay Total Delay Queue Length 5th (ft) ~ Queue Length 95th (ft) #1451 m62 m#957 Internal Link Dist (ft) Turn Bay Length (ft) Base Capacity (vph) Starvation Cap Reductn Spillback Cap Reductn Storage Cap Reductn Reduced v/c Ratio ~ Volume exceeds capacity, queue is theoretically infinite. Queue shown is maximum after two cycles. # 95th percentile volume exceeds capacity, queue may be longer. Queue shown is maximum after two cycles. m Volume for 95th percentile queue is metered by upstream signal. Page 5
183 HCM Signalized Intersection Capacity Analysis Future Background PM 3: US 1 & 3 rd Street 1/6/216 Movement EBL EBT EBR WBL WBT WBR NBL NBT NBR SBL SBT SBR Lane Configurations Traffic Volume (vph) Future Volume (vph) Ideal Flow (vphpl) Total Lost time (s) Lane Util. Factor Frt Flt Protected Satd. Flow (prot) Flt Permitted Satd. Flow (perm) Peak-hour factor, PHF Adj. Flow (vph) RTOR Reduction (vph) Lane Group Flow (vph) Turn Type Split NA Split NA Prot Prot NA Perm Prot NA Protected Phases Permitted Phases 2 Actuated Green, G (s) Effective Green, g (s) Actuated g/c Ratio Clearance Time (s) Vehicle Extension (s) Lane Grp Cap (vph) v/s Ratio Prot c.1.1 c c.8 c v/s Ratio Perm.1 v/c Ratio Uniform Delay, d Progression Factor Incremental Delay, d Delay (s) Level of Service E E E D D F F C E E Approach Delay (s) Approach LOS E E F E HCM 2 Control Delay 81.1 HCM 2 Level of Service F HCM 2 Volume to Capacity ratio.98 Actuated Cycle Length (s) 16. Sum of lost time (s) 26. Intersection Capacity Utilization 98.% ICU Level of Service F Analysis Period (min) 15 c Critical Lane Group Page 6
184 Queues Future Background PM 4: Dixie Highway & 3rd Street 1/6/216 Lane Group EBT WBT SBL SBT Lane Group Flow (vph) v/c Ratio Control Delay Queue Delay Total Delay Queue Length 5th (ft) Queue Length 95th (ft) 189 m Internal Link Dist (ft) Turn Bay Length (ft) Base Capacity (vph) Starvation Cap Reductn 228 Spillback Cap Reductn 16 Storage Cap Reductn Reduced v/c Ratio m Volume for 95th percentile queue is metered by upstream signal. Page 7
185 HCM Signalized Intersection Capacity Analysis Future Background PM 4: Dixie Highway & 3rd Street 1/6/216 Movement EBL EBT EBR WBL WBT WBR NBL NBT NBR SBL SBT SBR Lane Configurations Traffic Volume (vph) Future Volume (vph) Ideal Flow (vphpl) Total Lost time (s) Lane Util. Factor Frt Flt Protected Satd. Flow (prot) Flt Permitted Satd. Flow (perm) Peak-hour factor, PHF Adj. Flow (vph) RTOR Reduction (vph) 5 7 Lane Group Flow (vph) Turn Type NA Prot NA Split NA Protected Phases Permitted Phases Actuated Green, G (s) Effective Green, g (s) Actuated g/c Ratio Clearance Time (s) 4.5 Vehicle Extension (s) 3. Lane Grp Cap (vph) v/s Ratio Prot c.9 c.16 c.13.1 v/s Ratio Perm.9 v/c Ratio Uniform Delay, d Progression Factor Incremental Delay, d Delay (s) Level of Service D A D D Approach Delay (s) Approach LOS D A A D HCM 2 Control Delay 31.2 HCM 2 Level of Service C HCM 2 Volume to Capacity ratio.44 Actuated Cycle Length (s) Sum of lost time (s) 16.5 Intersection Capacity Utilization 53.% ICU Level of Service A Analysis Period (min) 15 c Critical Lane Group Page 8
186 Queues Future Background PM 5: 1st Avenue & 3rd Street 1/6/216 Lane Group EBT WBT WBR NBT Lane Group Flow (vph) v/c Ratio Control Delay Queue Delay Total Delay Queue Length 5th (ft) Queue Length 95th (ft) #464 Internal Link Dist (ft) Turn Bay Length (ft) Base Capacity (vph) Starvation Cap Reductn 223 Spillback Cap Reductn Storage Cap Reductn Reduced v/c Ratio # 95th percentile volume exceeds capacity, queue may be longer. Queue shown is maximum after two cycles. Page 9
187 HCM Signalized Intersection Capacity Analysis Future Background PM 5: 1st Avenue & 3rd Street 1/6/216 Movement EBL EBT EBR WBL WBT WBR NBL NBT NBR SBL SBT SBR Lane Configurations Traffic Volume (vph) Future Volume (vph) Ideal Flow (vphpl) Total Lost time (s) Lane Util. Factor Frt Flt Protected Satd. Flow (prot) Flt Permitted Satd. Flow (perm) Peak-hour factor, PHF Adj. Flow (vph) RTOR Reduction (vph) 13 1 Lane Group Flow (vph) Turn Type Prot NA NA Perm Split NA Protected Phases Permitted Phases 7 Actuated Green, G (s) Effective Green, g (s) Actuated g/c Ratio Clearance Time (s) Vehicle Extension (s) Lane Grp Cap (vph) v/s Ratio Prot c.12 c.12 c.24 v/s Ratio Perm.8.2 v/c Ratio Uniform Delay, d Progression Factor Incremental Delay, d Delay (s) Level of Service A D D D Approach Delay (s) Approach LOS A D D A HCM 2 Control Delay 34.5 HCM 2 Level of Service C HCM 2 Volume to Capacity ratio.55 Actuated Cycle Length (s) Sum of lost time (s) 16.5 Intersection Capacity Utilization 6.7% ICU Level of Service B Analysis Period (min) 15 c Critical Lane Group Page 1
188 Queues Future Background PM 6: US 1 & Hallandale Beach Boulevard 1/6/216 Lane Group EBL EBT WBL WBT NBL NBT NBR SBL SBT Lane Group Flow (vph) v/c Ratio Control Delay Queue Delay Total Delay Queue Length 5th (ft) ~467 ~629 ~ ~ Queue Length 95th (ft) #315 #576 m#529 m#63 m#416 m287 m31 # Internal Link Dist (ft) Turn Bay Length (ft) Base Capacity (vph) Starvation Cap Reductn Spillback Cap Reductn Storage Cap Reductn Reduced v/c Ratio ~ Volume exceeds capacity, queue is theoretically infinite. Queue shown is maximum after two cycles. # 95th percentile volume exceeds capacity, queue may be longer. Queue shown is maximum after two cycles. m Volume for 95th percentile queue is metered by upstream signal. Page 11
189 HCM Signalized Intersection Capacity Analysis Future Background PM 6: US 1 & Hallandale Beach Boulevard 1/6/216 Movement EBL EBT EBR WBL WBT WBR NBL NBT NBR SBL SBT SBR Lane Configurations Traffic Volume (vph) Future Volume (vph) Ideal Flow (vphpl) Total Lost time (s) Lane Util. Factor Frt Flt Protected Satd. Flow (prot) Flt Permitted Satd. Flow (perm) Peak-hour factor, PHF Adj. Flow (vph) RTOR Reduction (vph) Lane Group Flow (vph) Turn Type Prot NA Prot NA Prot NA pm+ov Prot NA Protected Phases Permitted Phases 2 Actuated Green, G (s) Effective Green, g (s) Actuated g/c Ratio Clearance Time (s) Vehicle Extension (s) Lane Grp Cap (vph) v/s Ratio Prot c.19 c.3 c.18 c v/s Ratio Perm.15 v/c Ratio Uniform Delay, d Progression Factor Incremental Delay, d Delay (s) Level of Service F D F E F E A F E Approach Delay (s) Approach LOS D F F E HCM 2 Control Delay 91.7 HCM 2 Level of Service F HCM 2 Volume to Capacity ratio 1.1 Actuated Cycle Length (s) 16. Sum of lost time (s) 28. Intersection Capacity Utilization 98.2% ICU Level of Service F Analysis Period (min) 15 c Critical Lane Group Page 12
190 Queues Future Background PM 7: Hallandale Beach Boulevard & Dixie Highway 1/6/216 Lane Group EBT WBL WBT SBT Lane Group Flow (vph) v/c Ratio Control Delay Queue Delay Total Delay Queue Length 5th (ft) Queue Length 95th (ft) 471 m97 m Internal Link Dist (ft) Turn Bay Length (ft) Base Capacity (vph) Starvation Cap Reductn Spillback Cap Reductn Storage Cap Reductn Reduced v/c Ratio m Volume for 95th percentile queue is metered by upstream signal. Page 13
191 HCM Signalized Intersection Capacity Analysis Future Background PM 7: Hallandale Beach Boulevard & Dixie Highway 1/6/216 Movement EBL EBT EBR WBL WBT WBR NBL NBT NBR SBL SBT SBR Lane Configurations Traffic Volume (vph) Future Volume (vph) Ideal Flow (vphpl) Total Lost time (s) Lane Util. Factor Frt Flt Protected Satd. Flow (prot) Flt Permitted Satd. Flow (perm) Peak-hour factor, PHF Adj. Flow (vph) RTOR Reduction (vph) 5 2 Lane Group Flow (vph) Turn Type NA Prot NA Perm NA Protected Phases Permitted Phases 4 Actuated Green, G (s) Effective Green, g (s) Actuated g/c Ratio Clearance Time (s) Vehicle Extension (s) Lane Grp Cap (vph) v/s Ratio Prot.27.6 c.44 v/s Ratio Perm.1 v/c Ratio Uniform Delay, d Progression Factor Incremental Delay, d Delay (s) Level of Service D F B E Approach Delay (s) Approach LOS D B A E HCM 2 Control Delay 31.4 HCM 2 Level of Service C HCM 2 Volume to Capacity ratio.63 Actuated Cycle Length (s) 16. Sum of lost time (s) 22.5 Intersection Capacity Utilization 1.2% ICU Level of Service G Analysis Period (min) 15 c Critical Lane Group Page 14
192 Queues Future Background PM 8: 1st Avenue & Hallandale Beach Boulevard 1/6/216 Lane Group EBL EBT WBT NBL NBT NBR Lane Group Flow (vph) v/c Ratio Control Delay Queue Delay Total Delay Queue Length 5th (ft) 45 2 ~ Queue Length 95th (ft) m71 2 m76 #611 # Internal Link Dist (ft) Turn Bay Length (ft) Base Capacity (vph) Starvation Cap Reductn Spillback Cap Reductn Storage Cap Reductn Reduced v/c Ratio ~ Volume exceeds capacity, queue is theoretically infinite. Queue shown is maximum after two cycles. # 95th percentile volume exceeds capacity, queue may be longer. Queue shown is maximum after two cycles. m Volume for 95th percentile queue is metered by upstream signal. Page 15
193 HCM Signalized Intersection Capacity Analysis Future Background PM 8: 1st Avenue & Hallandale Beach Boulevard 1/6/216 Movement EBL EBT EBR WBL WBT WBR NBL NBT NBR SBL SBT SBR Lane Configurations Traffic Volume (vph) Future Volume (vph) Ideal Flow (vphpl) Total Lost time (s) Lane Util. Factor Frt Flt Protected Satd. Flow (prot) Flt Permitted Satd. Flow (perm) Peak-hour factor, PHF Adj. Flow (vph) RTOR Reduction (vph) 1 74 Lane Group Flow (vph) Turn Type Prot NA NA Perm NA Perm Protected Phases Permitted Phases 1 1 Actuated Green, G (s) Effective Green, g (s) Actuated g/c Ratio Clearance Time (s) Vehicle Extension (s) Lane Grp Cap (vph) v/s Ratio Prot.3 c.27 c.4 c.23 v/s Ratio Perm.23.2 v/c Ratio Uniform Delay, d Progression Factor Incremental Delay, d Delay (s) Level of Service C A E E E D Approach Delay (s) Approach LOS A E E A HCM 2 Control Delay 39.3 HCM 2 Level of Service D HCM 2 Volume to Capacity ratio.87 Actuated Cycle Length (s) 16. Sum of lost time (s) 22.5 Intersection Capacity Utilization 1.2% ICU Level of Service G Analysis Period (min) 15 c Critical Lane Group Page 16
194 Queues Future Background PM 9: Hallandale Beach Boulevard & E 8th Avenue 1/6/216 Lane Group EBT EBR WBL WBT NBT SBL SBT SBR Lane Group Flow (vph) v/c Ratio Control Delay Queue Delay Total Delay Queue Length 5th (ft) ~ Queue Length 95th (ft) m358 m47 m # Internal Link Dist (ft) Turn Bay Length (ft) Base Capacity (vph) Starvation Cap Reductn Spillback Cap Reductn Storage Cap Reductn Reduced v/c Ratio ~ Volume exceeds capacity, queue is theoretically infinite. Queue shown is maximum after two cycles. # 95th percentile volume exceeds capacity, queue may be longer. Queue shown is maximum after two cycles. m Volume for 95th percentile queue is metered by upstream signal. Page 17
195 HCM Signalized Intersection Capacity Analysis Future Background PM 9: Hallandale Beach Boulevard & E 8th Avenue 1/6/216 Movement EBL EBT EBR WBL WBT WBR NBL NBT NBR SBL SBT SBR Lane Configurations Traffic Volume (vph) Future Volume (vph) Ideal Flow (vphpl) Total Lost time (s) Lane Util. Factor Frt Flt Protected Satd. Flow (prot) Flt Permitted Satd. Flow (perm) Peak-hour factor, PHF Adj. Flow (vph) RTOR Reduction (vph) Lane Group Flow (vph) Turn Type NA Perm pm+pt NA Split NA Split NA Perm Protected Phases Permitted Phases Actuated Green, G (s) Effective Green, g (s) Actuated g/c Ratio Clearance Time (s) Vehicle Extension (s) Lane Grp Cap (vph) v/s Ratio Prot.33.2 c.39 c.28 c.7.1 v/s Ratio Perm v/c Ratio Uniform Delay, d Progression Factor Incremental Delay, d Delay (s) Level of Service D D E C F D D D Approach Delay (s) Approach LOS D C F D HCM 2 Control Delay 67.7 HCM 2 Level of Service E HCM 2 Volume to Capacity ratio.83 Actuated Cycle Length (s) 16. Sum of lost time (s) 17. Intersection Capacity Utilization 79.6% ICU Level of Service D Analysis Period (min) 15 c Critical Lane Group Page 18
196 Queues Future Background PM 1: Hallandale Beach Boulevard & E 1th Avenue 1/6/216 Lane Group EBL EBT EBR WBL WBT WBR NBL NBT NBR SBT Lane Group Flow (vph) v/c Ratio Control Delay Queue Delay Total Delay Queue Length 5th (ft) Queue Length 95th (ft) m22 m68 m Internal Link Dist (ft) Turn Bay Length (ft) Base Capacity (vph) Starvation Cap Reductn 284 Spillback Cap Reductn Storage Cap Reductn Reduced v/c Ratio m Volume for 95th percentile queue is metered by upstream signal. Page 19
197 HCM Signalized Intersection Capacity Analysis Future Background PM 1: Hallandale Beach Boulevard & E 1th Avenue 1/6/216 Movement EBL EBT EBR WBL WBT WBR NBL NBT NBR SBL SBT SBR Lane Configurations Traffic Volume (vph) Future Volume (vph) Ideal Flow (vphpl) Total Lost time (s) Lane Util. Factor Frt Flt Protected Satd. Flow (prot) Flt Permitted Satd. Flow (perm) Peak-hour factor, PHF Adj. Flow (vph) RTOR Reduction (vph) Lane Group Flow (vph) Turn Type Prot NA Perm Prot NA Perm Prot NA Perm Protected Phases Permitted Phases Actuated Green, G (s) Effective Green, g (s) Actuated g/c Ratio Clearance Time (s) Vehicle Extension (s) Lane Grp Cap (vph) v/s Ratio Prot c c v/s Ratio Perm.2.5 c.16 v/c Ratio Uniform Delay, d Progression Factor Incremental Delay, d Delay (s) Level of Service F A A E D C D D D E Approach Delay (s) Approach LOS B D D E HCM 2 Control Delay 31.5 HCM 2 Level of Service C HCM 2 Volume to Capacity ratio.66 Actuated Cycle Length (s) 16. Sum of lost time (s) 13.5 Intersection Capacity Utilization Err% ICU Level of Service H Analysis Period (min) 15 c Critical Lane Group Page 2
198 Queues Future Background PM 11: Dixie Highway & County Line Road 1/6/216 Lane Group EBT WBT NBL NBR SBL SBT SBR Lane Group Flow (vph) v/c Ratio Control Delay Queue Delay Total Delay Queue Length 5th (ft) Queue Length 95th (ft) 12 m# Internal Link Dist (ft) Turn Bay Length (ft) Base Capacity (vph) Starvation Cap Reductn Spillback Cap Reductn 15 6 Storage Cap Reductn Reduced v/c Ratio # 95th percentile volume exceeds capacity, queue may be longer. Queue shown is maximum after two cycles. m Volume for 95th percentile queue is metered by upstream signal. Page 21
199 HCM Signalized Intersection Capacity Analysis Future Background PM 11: Dixie Highway & County Line Road 1/6/216 Movement EBL EBT EBR WBL WBT WBR NBL NBT NBR SBL SBT SBR Lane Configurations Traffic Volume (vph) Future Volume (vph) Ideal Flow (vphpl) Total Lost time (s) Lane Util. Factor Frt Flt Protected Satd. Flow (prot) Flt Permitted Satd. Flow (perm) Peak-hour factor, PHF Adj. Flow (vph) RTOR Reduction (vph) Lane Group Flow (vph) Turn Type NA Split NA D.Pm Prot custom NA Perm Protected Phases Permitted Phases Actuated Green, G (s) Effective Green, g (s) Actuated g/c Ratio Clearance Time (s) Vehicle Extension (s) Lane Grp Cap (vph) v/s Ratio Prot c.6 c c.19 v/s Ratio Perm v/c Ratio Uniform Delay, d Progression Factor Incremental Delay, d Delay (s) Level of Service D D C C B B B Approach Delay (s) Approach LOS D D C B HCM 2 Control Delay 28.4 HCM 2 Level of Service C HCM 2 Volume to Capacity ratio.68 Actuated Cycle Length (s) 88.4 Sum of lost time (s) 18. Intersection Capacity Utilization 66.7% ICU Level of Service C Analysis Period (min) 15 c Critical Lane Group Page 22
200 Queues Future Background PM 12: County Line Road & 1st Avenue 1/6/216 Lane Group EBL EBR NBL NBT SBT SBR Lane Group Flow (vph) v/c Ratio Control Delay Queue Delay Total Delay Queue Length 5th (ft) Queue Length 95th (ft) 45 # Internal Link Dist (ft) Turn Bay Length (ft) Base Capacity (vph) Starvation Cap Reductn Spillback Cap Reductn 1 85 Storage Cap Reductn Reduced v/c Ratio # 95th percentile volume exceeds capacity, queue may be longer. Queue shown is maximum after two cycles. Page 23
201 HCM Signalized Intersection Capacity Analysis Future Background PM 12: County Line Road & 1st Avenue 1/6/216 Movement EBL EBR NBL NBT SBT SBR Lane Configurations Traffic Volume (vph) Future Volume (vph) Ideal Flow (vphpl) Total Lost time (s) Lane Util. Factor Frt Flt Protected Satd. Flow (prot) Flt Permitted Satd. Flow (perm) Peak-hour factor, PHF Adj. Flow (vph) RTOR Reduction (vph) Lane Group Flow (vph) Turn Type Prot Prot Perm NA NA Prot Protected Phases Permitted Phases 8 Actuated Green, G (s) Effective Green, g (s) Actuated g/c Ratio Clearance Time (s) Vehicle Extension (s) Lane Grp Cap (vph) v/s Ratio Prot c v/s Ratio Perm c.26 v/c Ratio Uniform Delay, d Progression Factor Incremental Delay, d Delay (s) Level of Service A A E C C C Approach Delay (s) Approach LOS A D C HCM 2 Control Delay 22.5 HCM 2 Level of Service C HCM 2 Volume to Capacity ratio.66 Actuated Cycle Length (s) 88.4 Sum of lost time (s) 18. Intersection Capacity Utilization 56.4% ICU Level of Service B Analysis Period (min) 15 c Critical Lane Group Page 24
202 HCM Unsignalized Intersection Capacity Analysis Future Background PM 13: E 1st Avenue & NE 214th Terr 1/6/216 Movement WBL WBR NBT NBR SBL SBT Lane Configurations Traffic Volume (veh/h) Future Volume (Veh/h) Sign Control Stop Free Free Grade % % % Peak Hour Factor Hourly flow rate (vph) Pedestrians Lane Width (ft) Walking Speed (ft/s) Percent Blockage Right turn flare (veh) Median type None None Median storage veh) Upstream signal (ft) 144 px, platoon unblocked vc, conflicting volume vc1, stage 1 conf vol vc2, stage 2 conf vol vcu, unblocked vol tc, single (s) tc, 2 stage (s) tf (s) p queue free % cm capacity (veh/h) Direction, Lane # WB 1 NB 1 SB 1 Volume Total Volume Left Volume Right csh Volume to Capacity... Queue Length 95th (ft) Control Delay (s)... Lane LOS A Approach Delay (s)... Approach LOS A Average Delay. Intersection Capacity Utilization.% ICU Level of Service A Analysis Period (min) 15 Page 25
203 HCM Unsignalized Intersection Capacity Analysis Future Background PM 14: SE 3rd Ave & SE 1th Ct 1/6/216 Movement EBL EBT EBR WBL WBT WBR NBL NBT NBR SBL SBT SBR Lane Configurations Traffic Volume (veh/h) Future Volume (Veh/h) Sign Control Free Free Stop Stop Grade % % % % Peak Hour Factor Hourly flow rate (vph) Pedestrians Lane Width (ft) Walking Speed (ft/s) Percent Blockage Right turn flare (veh) Median type None None Median storage veh) Upstream signal (ft) px, platoon unblocked vc, conflicting volume vc1, stage 1 conf vol vc2, stage 2 conf vol vcu, unblocked vol tc, single (s) tc, 2 stage (s) tf (s) p queue free % cm capacity (veh/h) Direction, Lane # EB 1 WB 1 NB 1 SB 1 Volume Total Volume Left Volume Right csh Volume to Capacity Queue Length 95th (ft) Control Delay (s) Lane LOS A A A A Approach Delay (s) Approach LOS A A Average Delay 5.5 Intersection Capacity Utilization 23.3% ICU Level of Service A Analysis Period (min) 15 Page 26
204 HCM Unsignalized Intersection Capacity Analysis Future Background PM 37: NE 214th Terr & SE 3rd Ave 1/6/216 Movement EBL EBT WBT WBR SBL SBR Lane Configurations Traffic Volume (veh/h) Future Volume (Veh/h) Sign Control Free Free Stop Grade % % % Peak Hour Factor Hourly flow rate (vph) Pedestrians Lane Width (ft) Walking Speed (ft/s) Percent Blockage Right turn flare (veh) Median type None None Median storage veh) Upstream signal (ft) px, platoon unblocked vc, conflicting volume vc1, stage 1 conf vol vc2, stage 2 conf vol vcu, unblocked vol tc, single (s) tc, 2 stage (s) tf (s) p queue free % cm capacity (veh/h) Direction, Lane # EB 1 WB 1 SB 1 Volume Total Volume Left 1 Volume Right csh Volume to Capacity Queue Length 95th (ft) 22 Control Delay (s) Lane LOS A Approach Delay (s) Approach LOS A Average Delay 8.7 Intersection Capacity Utilization 23.8% ICU Level of Service A Analysis Period (min) 15 Page 27
205 HCM Unsignalized Intersection Capacity Analysis Future Background PM 41: Optima Office Drive 1/6/216 Movement EBL EBR NBL NBT SBT SBR Lane Configurations Traffic Volume (veh/h) Future Volume (Veh/h) Sign Control Stop Free Free Grade % % % Peak Hour Factor Hourly flow rate (vph) Pedestrians Lane Width (ft) Walking Speed (ft/s) Percent Blockage Right turn flare (veh) Median type None None Median storage veh) Upstream signal (ft) px, platoon unblocked vc, conflicting volume vc1, stage 1 conf vol vc2, stage 2 conf vol vcu, unblocked vol 1542 tc, single (s) tc, 2 stage (s) tf (s) p queue free % cm capacity (veh/h) Direction, Lane # EB 1 NB 1 NB 2 NB 3 NB 4 SB 1 SB 2 SB 3 Volume Total Volume Left Volume Right csh Volume to Capacity Queue Length 95th (ft) 26 1 Control Delay (s) Lane LOS B C Approach Delay (s) Approach LOS B Average Delay.6 Intersection Capacity Utilization Err% ICU Level of Service H Analysis Period (min) 15 Page 28
206 HCM Unsignalized Intersection Capacity Analysis Future Background PM 46: Optima Drive 1/6/216 Movement EBL EBT WBT WBR SBL SBR Lane Configurations Traffic Volume (veh/h) Future Volume (Veh/h) Sign Control Free Free Stop Grade % % % Peak Hour Factor Hourly flow rate (vph) Pedestrians Lane Width (ft) Walking Speed (ft/s) Percent Blockage Right turn flare (veh) Median type None None Median storage veh) Upstream signal (ft) px, platoon unblocked vc, conflicting volume vc1, stage 1 conf vol vc2, stage 2 conf vol vcu, unblocked vol tc, single (s) tc, 2 stage (s) tf (s) p queue free % cm capacity (veh/h) Direction, Lane # EB 1 WB 1 SB 1 Volume Total Volume Left Volume Right csh Volume to Capacity... Queue Length 95th (ft) Control Delay (s)... Lane LOS A Approach Delay (s)... Approach LOS A Average Delay. Intersection Capacity Utilization.% ICU Level of Service A Analysis Period (min) 15 Page 29
207 Queues Existing PM 1: Biscayne Boulevard & NE 213th Street 1/5/216 Lane Group WBL WBR NBT NBR SBL SBT Lane Group Flow (vph) v/c Ratio Control Delay Queue Delay Total Delay Queue Length 5th (ft) Queue Length 95th (ft) Internal Link Dist (ft) Turn Bay Length (ft) Base Capacity (vph) Starvation Cap Reductn Spillback Cap Reductn Storage Cap Reductn Reduced v/c Ratio Page 1
208 HCM Signalized Intersection Capacity Analysis Existing PM 1: Biscayne Boulevard & NE 213th Street 1/5/216 Movement WBL WBR NBT NBR SBL SBT Lane Configurations Traffic Volume (vph) Future Volume (vph) Ideal Flow (vphpl) Total Lost time (s) Lane Util. Factor Frt Flt Protected Satd. Flow (prot) Flt Permitted Satd. Flow (perm) Peak-hour factor, PHF Adj. Flow (vph) RTOR Reduction (vph) Lane Group Flow (vph) Turn Type Prot Perm NA Perm Prot NA Protected Phases Permitted Phases 8 2 Actuated Green, G (s) Effective Green, g (s) Actuated g/c Ratio Clearance Time (s) Vehicle Extension (s) Lane Grp Cap (vph) v/s Ratio Prot c.8 c.45 c.2.36 v/s Ratio Perm.2.8 v/c Ratio Uniform Delay, d Progression Factor Incremental Delay, d Delay (s) Level of Service E E C B E A Approach Delay (s) Approach LOS E C B HCM 2 Control Delay 27.8 HCM 2 Level of Service C HCM 2 Volume to Capacity ratio.79 Actuated Cycle Length (s) 16. Sum of lost time (s) 13.5 Intersection Capacity Utilization 76.3% ICU Level of Service D Analysis Period (min) 15 c Critical Lane Group Page 2
209 Queues Existing PM 2: US 1 & SE 9th Street 1/5/216 Lane Group EBT WBL WBT WBR NBL NBT NBR SBL SBT Lane Group Flow (vph) v/c Ratio Control Delay Queue Delay Total Delay Queue Length 5th (ft) Queue Length 95th (ft) Internal Link Dist (ft) Turn Bay Length (ft) Base Capacity (vph) Starvation Cap Reductn Spillback Cap Reductn Storage Cap Reductn Reduced v/c Ratio Page 3
210 HCM Signalized Intersection Capacity Analysis Existing PM 2: US 1 & SE 9th Street 1/5/216 Movement EBL EBT EBR WBL WBT WBR NBL NBT NBR SBL SBT SBR Lane Configurations Traffic Volume (vph) Future Volume (vph) Ideal Flow (vphpl) Total Lost time (s) Lane Util. Factor Frt Flt Protected Satd. Flow (prot) Flt Permitted Satd. Flow (perm) Peak-hour factor, PHF Adj. Flow (vph) RTOR Reduction (vph) Lane Group Flow (vph) Turn Type Split NA Split NA Prot Prot NA Perm Prot NA Protected Phases Permitted Phases 2 Actuated Green, G (s) Effective Green, g (s) Actuated g/c Ratio Clearance Time (s) Vehicle Extension (s) Lane Grp Cap (vph) v/s Ratio Prot c.1.5 c.5. c.3 c v/s Ratio Perm.2 v/c Ratio Uniform Delay, d Progression Factor Incremental Delay, d Delay (s) Level of Service E F F E F B A E B Approach Delay (s) Approach LOS E E B B HCM 2 Control Delay 19.1 HCM 2 Level of Service B HCM 2 Volume to Capacity ratio.63 Actuated Cycle Length (s) Sum of lost time (s) 27. Intersection Capacity Utilization 66.4% ICU Level of Service C Analysis Period (min) 15 c Critical Lane Group Page 4
211 Queues Existing PM 3: US 1 & 3 rd Street 1/5/216 Lane Group EBL EBT WBL WBT WBR NBL NBT NBR SBL SBT Lane Group Flow (vph) v/c Ratio Control Delay Queue Delay Total Delay Queue Length 5th (ft) Queue Length 95th (ft) m49 m63 Internal Link Dist (ft) Turn Bay Length (ft) Base Capacity (vph) Starvation Cap Reductn Spillback Cap Reductn Storage Cap Reductn Reduced v/c Ratio m Volume for 95th percentile queue is metered by upstream signal. Page 5
212 HCM Signalized Intersection Capacity Analysis Existing PM 3: US 1 & 3 rd Street 1/5/216 Movement EBL EBT EBR WBL WBT WBR NBL NBT NBR SBL SBT SBR Lane Configurations Traffic Volume (vph) Future Volume (vph) Ideal Flow (vphpl) Total Lost time (s) Lane Util. Factor Frt Flt Protected Satd. Flow (prot) Flt Permitted Satd. Flow (perm) Peak-hour factor, PHF Adj. Flow (vph) RTOR Reduction (vph) Lane Group Flow (vph) Turn Type Split NA Split NA Prot Prot NA Perm Prot NA Protected Phases Permitted Phases 2 Actuated Green, G (s) Effective Green, g (s) Actuated g/c Ratio Clearance Time (s) Vehicle Extension (s) Lane Grp Cap (vph) v/s Ratio Prot c.1.9 c.7.4. c.8 c v/s Ratio Perm.1 v/c Ratio Uniform Delay, d Progression Factor Incremental Delay, d Delay (s) Level of Service F E F E E F C B D D Approach Delay (s) Approach LOS E E C D HCM 2 Control Delay 48.2 HCM 2 Level of Service D HCM 2 Volume to Capacity ratio.75 Actuated Cycle Length (s) 16. Sum of lost time (s) 26. Intersection Capacity Utilization 81.1% ICU Level of Service D Analysis Period (min) 15 c Critical Lane Group Page 6
213 Queues Existing PM 4: Dixie Highway & 3rd Street 1/5/216 Lane Group EBT WBT SBL SBT Lane Group Flow (vph) v/c Ratio Control Delay Queue Delay Total Delay Queue Length 5th (ft) Queue Length 95th (ft) Internal Link Dist (ft) Turn Bay Length (ft) Base Capacity (vph) Starvation Cap Reductn 213 Spillback Cap Reductn 11 Storage Cap Reductn Reduced v/c Ratio Page 7
214 HCM Signalized Intersection Capacity Analysis Existing PM 4: Dixie Highway & 3rd Street 1/5/216 Movement EBL EBT EBR WBL WBT WBR NBL NBT NBR SBL SBT SBR Lane Configurations Traffic Volume (vph) Future Volume (vph) Ideal Flow (vphpl) Total Lost time (s) Lane Util. Factor Frt Flt Protected Satd. Flow (prot) Flt Permitted Satd. Flow (perm) Peak-hour factor, PHF Adj. Flow (vph) RTOR Reduction (vph) 5 2 Lane Group Flow (vph) Turn Type NA Prot NA Split NA Protected Phases Permitted Phases Actuated Green, G (s) Effective Green, g (s) Actuated g/c Ratio Clearance Time (s) 4.5 Vehicle Extension (s) 3. Lane Grp Cap (vph) v/s Ratio Prot c.9 c.15 c.13.1 v/s Ratio Perm.9 v/c Ratio Uniform Delay, d Progression Factor Incremental Delay, d Delay (s) Level of Service D A D D Approach Delay (s) Approach LOS D A A D HCM 2 Control Delay 3.6 HCM 2 Level of Service C HCM 2 Volume to Capacity ratio.43 Actuated Cycle Length (s) 124. Sum of lost time (s) 16.5 Intersection Capacity Utilization 52.% ICU Level of Service A Analysis Period (min) 15 c Critical Lane Group Page 8
215 Queues Existing PM 5: 1st Avenue & 3rd Street 1/5/216 Lane Group EBT WBT WBR NBT Lane Group Flow (vph) v/c Ratio Control Delay Queue Delay Total Delay Queue Length 5th (ft) Queue Length 95th (ft) Internal Link Dist (ft) Turn Bay Length (ft) Base Capacity (vph) Starvation Cap Reductn 233 Spillback Cap Reductn Storage Cap Reductn Reduced v/c Ratio Page 9
216 HCM Signalized Intersection Capacity Analysis Existing PM 5: 1st Avenue & 3rd Street 1/5/216 Movement EBL EBT EBR WBL WBT WBR NBL NBT NBR SBL SBT SBR Lane Configurations Traffic Volume (vph) Future Volume (vph) Ideal Flow (vphpl) Total Lost time (s) Lane Util. Factor Frt Flt Protected Satd. Flow (prot) Flt Permitted Satd. Flow (perm) Peak-hour factor, PHF Adj. Flow (vph) RTOR Reduction (vph) 1 1 Lane Group Flow (vph) Turn Type Prot NA NA Perm Split NA Protected Phases Permitted Phases 7 Actuated Green, G (s) Effective Green, g (s) Actuated g/c Ratio Clearance Time (s) Vehicle Extension (s) Lane Grp Cap (vph) v/s Ratio Prot c.12 c.12 c.21 v/s Ratio Perm.8.2 v/c Ratio Uniform Delay, d Progression Factor Incremental Delay, d Delay (s) Level of Service A D D D Approach Delay (s) Approach LOS A D D A HCM 2 Control Delay 31.1 HCM 2 Level of Service C HCM 2 Volume to Capacity ratio.51 Actuated Cycle Length (s) 124. Sum of lost time (s) 16.5 Intersection Capacity Utilization 56.8% ICU Level of Service B Analysis Period (min) 15 c Critical Lane Group Page 1
217 Queues Existing PM 6: US 1 & Hallandale Beach Boulevard 1/5/216 Lane Group EBL EBT WBL WBT NBL NBT NBR SBL SBT Lane Group Flow (vph) v/c Ratio Control Delay Queue Delay Total Delay Queue Length 5th (ft) ~ ~ Queue Length 95th (ft) # #565 #48 # # Internal Link Dist (ft) Turn Bay Length (ft) Base Capacity (vph) Starvation Cap Reductn Spillback Cap Reductn Storage Cap Reductn Reduced v/c Ratio ~ Volume exceeds capacity, queue is theoretically infinite. Queue shown is maximum after two cycles. # 95th percentile volume exceeds capacity, queue may be longer. Queue shown is maximum after two cycles. Page 11
218 HCM Signalized Intersection Capacity Analysis Existing PM 6: US 1 & Hallandale Beach Boulevard 1/5/216 Movement EBL EBT EBR WBL WBT WBR NBL NBT NBR SBL SBT SBR Lane Configurations Traffic Volume (vph) Future Volume (vph) Ideal Flow (vphpl) Total Lost time (s) Lane Util. Factor Frt Flt Protected Satd. Flow (prot) Flt Permitted Satd. Flow (perm) Peak-hour factor, PHF Adj. Flow (vph) RTOR Reduction (vph) Lane Group Flow (vph) Turn Type Prot NA Prot NA Prot NA pm+ov Prot NA Protected Phases Permitted Phases 2 Actuated Green, G (s) Effective Green, g (s) Actuated g/c Ratio Clearance Time (s) Vehicle Extension (s) Lane Grp Cap (vph) v/s Ratio Prot.11.2 c.18 c.26 c.17 c v/s Ratio Perm.14 v/c Ratio Uniform Delay, d Progression Factor Incremental Delay, d Delay (s) Level of Service F D F D F D B F E Approach Delay (s) Approach LOS D F E E HCM 2 Control Delay 74.7 HCM 2 Level of Service E HCM 2 Volume to Capacity ratio.99 Actuated Cycle Length (s) 16. Sum of lost time (s) 28. Intersection Capacity Utilization 89.2% ICU Level of Service E Analysis Period (min) 15 c Critical Lane Group Page 12
219 Queues Existing PM 7: Hallandale Beach Boulevard & Dixie Highway 1/5/216 Lane Group EBT WBL WBT SBT Lane Group Flow (vph) v/c Ratio Control Delay Queue Delay Total Delay Queue Length 5th (ft) Queue Length 95th (ft) 389 m# Internal Link Dist (ft) Turn Bay Length (ft) Base Capacity (vph) Starvation Cap Reductn Spillback Cap Reductn Storage Cap Reductn Reduced v/c Ratio # 95th percentile volume exceeds capacity, queue may be longer. Queue shown is maximum after two cycles. m Volume for 95th percentile queue is metered by upstream signal. Page 13
220 HCM Signalized Intersection Capacity Analysis Existing PM 7: Hallandale Beach Boulevard & Dixie Highway 1/5/216 Movement EBL EBT EBR WBL WBT WBR NBL NBT NBR SBL SBT SBR Lane Configurations Traffic Volume (vph) Future Volume (vph) Ideal Flow (vphpl) Total Lost time (s) Lane Util. Factor Frt Flt Protected Satd. Flow (prot) Flt Permitted Satd. Flow (perm) Peak-hour factor, PHF Adj. Flow (vph) RTOR Reduction (vph) 3 2 Lane Group Flow (vph) Turn Type NA Prot NA Perm NA Protected Phases Permitted Phases 4 Actuated Green, G (s) Effective Green, g (s) Actuated g/c Ratio Clearance Time (s) Vehicle Extension (s) Lane Grp Cap (vph) v/s Ratio Prot.23.5 c.39 v/s Ratio Perm.9 v/c Ratio Uniform Delay, d Progression Factor Incremental Delay, d Delay (s) Level of Service D F A E Approach Delay (s) Approach LOS D B A E HCM 2 Control Delay 28.7 HCM 2 Level of Service C HCM 2 Volume to Capacity ratio.56 Actuated Cycle Length (s) 16. Sum of lost time (s) 22.5 Intersection Capacity Utilization 88.% ICU Level of Service E Analysis Period (min) 15 c Critical Lane Group Page 14
221 Queues Existing PM 8: 1st Avenue & Hallandale Beach Boulevard 1/5/216 Lane Group EBL EBT WBT NBL NBT NBR Lane Group Flow (vph) v/c Ratio Control Delay Queue Delay Total Delay Queue Length 5th (ft) Queue Length 95th (ft) m77 2 m Internal Link Dist (ft) Turn Bay Length (ft) Base Capacity (vph) Starvation Cap Reductn Spillback Cap Reductn Storage Cap Reductn Reduced v/c Ratio m Volume for 95th percentile queue is metered by upstream signal. Page 15
222 HCM Signalized Intersection Capacity Analysis Existing PM 8: 1st Avenue & Hallandale Beach Boulevard 1/5/216 Movement EBL EBT EBR WBL WBT WBR NBL NBT NBR SBL SBT SBR Lane Configurations Traffic Volume (vph) Future Volume (vph) Ideal Flow (vphpl) Total Lost time (s) Lane Util. Factor Frt Flt Protected Satd. Flow (prot) Flt Permitted Satd. Flow (perm) Peak-hour factor, PHF Adj. Flow (vph) RTOR Reduction (vph) 1 76 Lane Group Flow (vph) Turn Type Prot NA NA Perm NA Perm Protected Phases Permitted Phases 1 1 Actuated Green, G (s) Effective Green, g (s) Actuated g/c Ratio Clearance Time (s) Vehicle Extension (s) Lane Grp Cap (vph) v/s Ratio Prot.3 c.24 c.35 c.19 v/s Ratio Perm.19.2 v/c Ratio Uniform Delay, d Progression Factor Incremental Delay, d Delay (s) Level of Service C A B E E D Approach Delay (s) Approach LOS A B E A HCM 2 Control Delay 22.2 HCM 2 Level of Service C HCM 2 Volume to Capacity ratio.74 Actuated Cycle Length (s) 16. Sum of lost time (s) 22.5 Intersection Capacity Utilization 88.% ICU Level of Service E Analysis Period (min) 15 c Critical Lane Group Page 16
223 Queues Existing PM 9: Hallandale Beach Boulevard & E 8th Avenue 1/5/216 Lane Group EBT EBR WBL WBT NBT SBL SBT SBR Lane Group Flow (vph) v/c Ratio Control Delay Queue Delay Total Delay Queue Length 5th (ft) Queue Length 95th (ft) 37 m m Internal Link Dist (ft) Turn Bay Length (ft) Base Capacity (vph) Starvation Cap Reductn 86 2 Spillback Cap Reductn Storage Cap Reductn Reduced v/c Ratio m Volume for 95th percentile queue is metered by upstream signal. Page 17
224 HCM Signalized Intersection Capacity Analysis Existing PM 9: Hallandale Beach Boulevard & E 8th Avenue 1/5/216 Movement EBL EBT EBR WBL WBT WBR NBL NBT NBR SBL SBT SBR Lane Configurations Traffic Volume (vph) Future Volume (vph) Ideal Flow (vphpl) Total Lost time (s) Lane Util. Factor Frt Flt Protected Satd. Flow (prot) Flt Permitted Satd. Flow (perm) Peak-hour factor, PHF Adj. Flow (vph) RTOR Reduction (vph) Lane Group Flow (vph) Turn Type NA Perm pm+pt NA Split NA Split NA Perm Protected Phases Permitted Phases Actuated Green, G (s) Effective Green, g (s) Actuated g/c Ratio Clearance Time (s) Vehicle Extension (s) Lane Grp Cap (vph) v/s Ratio Prot.32. c.38 c.1 c.7. v/s Ratio Perm v/c Ratio Uniform Delay, d Progression Factor Incremental Delay, d Delay (s) Level of Service C C C C E D C D Approach Delay (s) Approach LOS C C E D HCM 2 Control Delay 26.1 HCM 2 Level of Service C HCM 2 Volume to Capacity ratio.51 Actuated Cycle Length (s) 16. Sum of lost time (s) 17. Intersection Capacity Utilization 57.4% ICU Level of Service B Analysis Period (min) 15 c Critical Lane Group Page 18
225 Queues Existing PM 1: Hallandale Beach Boulevard & E 1th Avenue 1/5/216 Lane Group EBL EBT EBR WBL WBT WBR NBL NBT NBR Lane Group Flow (vph) v/c Ratio Control Delay Queue Delay Total Delay Queue Length 5th (ft) Queue Length 95th (ft) m22 59 m Internal Link Dist (ft) Turn Bay Length (ft) Base Capacity (vph) Starvation Cap Reductn 23 Spillback Cap Reductn Storage Cap Reductn Reduced v/c Ratio m Volume for 95th percentile queue is metered by upstream signal. Page 19
226 HCM Signalized Intersection Capacity Analysis Existing PM 1: Hallandale Beach Boulevard & E 1th Avenue 1/5/216 Movement EBL EBT EBR WBL WBT WBR NBL NBT NBR SBL SBT SBR Lane Configurations Traffic Volume (vph) Future Volume (vph) Ideal Flow (vphpl) Total Lost time (s) Lane Util. Factor Frt Flt Protected Satd. Flow (prot) Flt Permitted Satd. Flow (perm) Peak-hour factor, PHF Adj. Flow (vph) RTOR Reduction (vph) Lane Group Flow (vph) Turn Type Prot NA Perm Prot NA Perm Prot NA Perm Protected Phases Permitted Phases Actuated Green, G (s) Effective Green, g (s) Actuated g/c Ratio Clearance Time (s) Vehicle Extension (s) Lane Grp Cap (vph) v/s Ratio Prot c c.36.4 c.12 v/s Ratio Perm v/c Ratio Uniform Delay, d Progression Factor Incremental Delay, d Delay (s) Level of Service F B A E D C D D D Approach Delay (s) Approach LOS B D D A HCM 2 Control Delay 31.8 HCM 2 Level of Service C HCM 2 Volume to Capacity ratio.61 Actuated Cycle Length (s) 16. Sum of lost time (s) 13.5 Intersection Capacity Utilization 6.7% ICU Level of Service B Analysis Period (min) 15 c Critical Lane Group Page 2
227 Queues Existing PM 11: Dixie Highway & County Line Road 1/5/216 Lane Group EBT WBT NBL NBR SBL SBT SBR Lane Group Flow (vph) v/c Ratio Control Delay Queue Delay Total Delay Queue Length 5th (ft) Queue Length 95th (ft) 97 m# Internal Link Dist (ft) Turn Bay Length (ft) Base Capacity (vph) Starvation Cap Reductn Spillback Cap Reductn 17 5 Storage Cap Reductn Reduced v/c Ratio # 95th percentile volume exceeds capacity, queue may be longer. Queue shown is maximum after two cycles. m Volume for 95th percentile queue is metered by upstream signal. Page 21
228 HCM Signalized Intersection Capacity Analysis Existing PM 11: Dixie Highway & County Line Road 1/5/216 Movement EBL EBT EBR WBL WBT WBR NBL NBT NBR SBL SBT SBR Lane Configurations Traffic Volume (vph) Future Volume (vph) Ideal Flow (vphpl) Total Lost time (s) Lane Util. Factor Frt Flt Protected Satd. Flow (prot) Flt Permitted Satd. Flow (perm) Peak-hour factor, PHF Adj. Flow (vph) RTOR Reduction (vph) Lane Group Flow (vph) Turn Type NA Split NA D.Pm Prot custom NA Perm Protected Phases Permitted Phases Actuated Green, G (s) Effective Green, g (s) Actuated g/c Ratio Clearance Time (s) Vehicle Extension (s) Lane Grp Cap (vph) v/s Ratio Prot c.6 c c.14 v/s Ratio Perm v/c Ratio Uniform Delay, d Progression Factor Incremental Delay, d Delay (s) Level of Service D C C C B B B Approach Delay (s) Approach LOS D C C B HCM 2 Control Delay 25.9 HCM 2 Level of Service C HCM 2 Volume to Capacity ratio.6 Actuated Cycle Length (s) 87. Sum of lost time (s) 18. Intersection Capacity Utilization 61.1% ICU Level of Service B Analysis Period (min) 15 c Critical Lane Group Page 22
229 Queues Existing PM 12: County Line Road & 1st Avenue 1/5/216 Lane Group EBL EBR NBL NBT SBT SBR Lane Group Flow (vph) v/c Ratio Control Delay Queue Delay Total Delay Queue Length 5th (ft) Queue Length 95th (ft) 44 # Internal Link Dist (ft) Turn Bay Length (ft) Base Capacity (vph) Starvation Cap Reductn Spillback Cap Reductn 1 79 Storage Cap Reductn Reduced v/c Ratio # 95th percentile volume exceeds capacity, queue may be longer. Queue shown is maximum after two cycles. Page 23
230 HCM Signalized Intersection Capacity Analysis Existing PM 12: County Line Road & 1st Avenue 1/5/216 Movement EBL EBR NBL NBT SBT SBR Lane Configurations Traffic Volume (vph) Future Volume (vph) Ideal Flow (vphpl) Total Lost time (s) Lane Util. Factor Frt Flt Protected Satd. Flow (prot) Flt Permitted Satd. Flow (perm) Peak-hour factor, PHF Adj. Flow (vph) RTOR Reduction (vph) Lane Group Flow (vph) Turn Type Prot Prot Perm NA NA Prot Protected Phases Permitted Phases 8 Actuated Green, G (s) Effective Green, g (s) Actuated g/c Ratio Clearance Time (s) Vehicle Extension (s) Lane Grp Cap (vph) v/s Ratio Prot c v/s Ratio Perm c.25 v/c Ratio Uniform Delay, d Progression Factor Incremental Delay, d Delay (s) Level of Service A A D C C C Approach Delay (s) Approach LOS A D C HCM 2 Control Delay 2.1 HCM 2 Level of Service C HCM 2 Volume to Capacity ratio.64 Actuated Cycle Length (s) 87. Sum of lost time (s) 18. Intersection Capacity Utilization 55.4% ICU Level of Service B Analysis Period (min) 15 c Critical Lane Group Page 24
231 HCM Unsignalized Intersection Capacity Analysis Existing PM 13: E 1st Avenue & NE 214th Terr 1/5/216 Movement WBL WBR NBT NBR SBL SBT Lane Configurations Traffic Volume (veh/h) Future Volume (Veh/h) Sign Control Stop Free Free Grade % % % Peak Hour Factor Hourly flow rate (vph) Pedestrians Lane Width (ft) Walking Speed (ft/s) Percent Blockage Right turn flare (veh) Median type None None Median storage veh) Upstream signal (ft) 144 px, platoon unblocked vc, conflicting volume vc1, stage 1 conf vol vc2, stage 2 conf vol vcu, unblocked vol tc, single (s) tc, 2 stage (s) tf (s) p queue free % cm capacity (veh/h) Direction, Lane # WB 1 NB 1 SB 1 Volume Total Volume Left Volume Right csh Volume to Capacity... Queue Length 95th (ft) Control Delay (s)... Lane LOS A Approach Delay (s)... Approach LOS A Average Delay. Intersection Capacity Utilization.% ICU Level of Service A Analysis Period (min) 15 Page 25
232 HCM Unsignalized Intersection Capacity Analysis Existing PM 14: SE 3rd Ave & SE 1th Ct 1/5/216 Movement EBL EBT EBR WBL WBT WBR NBL NBT NBR SBL SBT SBR Lane Configurations Traffic Volume (veh/h) Future Volume (Veh/h) Sign Control Free Free Stop Stop Grade % % % % Peak Hour Factor Hourly flow rate (vph) Pedestrians Lane Width (ft) Walking Speed (ft/s) Percent Blockage Right turn flare (veh) Median type None None Median storage veh) Upstream signal (ft) px, platoon unblocked vc, conflicting volume vc1, stage 1 conf vol vc2, stage 2 conf vol vcu, unblocked vol tc, single (s) tc, 2 stage (s) tf (s) p queue free % cm capacity (veh/h) Direction, Lane # EB 1 WB 1 NB 1 SB 1 Volume Total Volume Left 4 3 Volume Right 71 3 csh Volume to Capacity....1 Queue Length 95th (ft) Control Delay (s) Lane LOS A A A Approach Delay (s) Approach LOS A A Average Delay.7 Intersection Capacity Utilization 15.2% ICU Level of Service A Analysis Period (min) 15 Page 26
233 HCM Unsignalized Intersection Capacity Analysis Existing PM 37: NE 214th Terr & SE 3rd Ave 1/5/216 Movement EBL EBT WBT WBR SBL SBR Lane Configurations Traffic Volume (veh/h) Future Volume (Veh/h) Sign Control Free Free Stop Grade % % % Peak Hour Factor Hourly flow rate (vph) Pedestrians Lane Width (ft) Walking Speed (ft/s) Percent Blockage Right turn flare (veh) Median type None None Median storage veh) Upstream signal (ft) px, platoon unblocked vc, conflicting volume vc1, stage 1 conf vol vc2, stage 2 conf vol vcu, unblocked vol tc, single (s) tc, 2 stage (s) tf (s) p queue free % cm capacity (veh/h) Direction, Lane # EB 1 WB 1 SB 1 Volume Total Volume Left 1 Volume Right 1 85 csh Volume to Capacity..1.8 Queue Length 95th (ft) 7 Control Delay (s) Lane LOS A Approach Delay (s) Approach LOS A Average Delay 7.2 Intersection Capacity Utilization 14.9% ICU Level of Service A Analysis Period (min) 15 Page 27
234 HCM Unsignalized Intersection Capacity Analysis Existing PM 41: Optima Office Drive 1/5/216 Movement EBL EBR NBL NBT SBT SBR Lane Configurations Traffic Volume (veh/h) Future Volume (Veh/h) Sign Control Stop Free Free Grade % % % Peak Hour Factor Hourly flow rate (vph) Pedestrians Lane Width (ft) Walking Speed (ft/s) Percent Blockage Right turn flare (veh) Median type None None Median storage veh) Upstream signal (ft) px, platoon unblocked vc, conflicting volume vc1, stage 1 conf vol vc2, stage 2 conf vol vcu, unblocked vol tc, single (s) tc, 2 stage (s) tf (s) p queue free % cm capacity (veh/h) Direction, Lane # EB 1 NB 1 NB 2 NB 3 NB 4 SB 1 SB 2 SB 3 Volume Total Volume Left Volume Right csh Volume to Capacity Queue Length 95th (ft) 4 Control Delay (s) Lane LOS A Approach Delay (s) Approach LOS A Average Delay.1 Intersection Capacity Utilization 47.9% ICU Level of Service A Analysis Period (min) 15 Page 28
235 HCM Unsignalized Intersection Capacity Analysis Existing PM 46: Optima Drive 1/5/216 Movement EBL EBT WBT WBR SBL SBR Lane Configurations Traffic Volume (veh/h) Future Volume (Veh/h) Sign Control Free Free Stop Grade % % % Peak Hour Factor Hourly flow rate (vph) Pedestrians Lane Width (ft) Walking Speed (ft/s) Percent Blockage Right turn flare (veh) Median type None None Median storage veh) Upstream signal (ft) px, platoon unblocked vc, conflicting volume vc1, stage 1 conf vol vc2, stage 2 conf vol vcu, unblocked vol tc, single (s) tc, 2 stage (s) tf (s) p queue free % cm capacity (veh/h) Direction, Lane # EB 1 WB 1 SB 1 Volume Total Volume Left Volume Right csh Volume to Capacity... Queue Length 95th (ft) Control Delay (s)... Lane LOS A Approach Delay (s)... Approach LOS A Average Delay. Intersection Capacity Utilization.% ICU Level of Service A Analysis Period (min) 15 Page 29
236 Queues Future Total AM 1: Biscayne Boulevard & NE 213th Street 1/6/216 Lane Group WBL WBR NBT NBR SBL SBT Lane Group Flow (vph) v/c Ratio Control Delay Queue Delay Total Delay Queue Length 5th (ft) Queue Length 95th (ft) Internal Link Dist (ft) Turn Bay Length (ft) Base Capacity (vph) Starvation Cap Reductn Spillback Cap Reductn Storage Cap Reductn Reduced v/c Ratio Page 1
237 HCM Signalized Intersection Capacity Analysis Future Total AM 1: Biscayne Boulevard & NE 213th Street 1/6/216 Movement WBL WBR NBT NBR SBL SBT Lane Configurations Traffic Volume (vph) Future Volume (vph) Ideal Flow (vphpl) Total Lost time (s) Lane Util. Factor Frt Flt Protected Satd. Flow (prot) Flt Permitted Satd. Flow (perm) Peak-hour factor, PHF Adj. Flow (vph) RTOR Reduction (vph) Lane Group Flow (vph) Turn Type Prot Perm NA Perm Prot NA Protected Phases Permitted Phases 8 2 Actuated Green, G (s) Effective Green, g (s) Actuated g/c Ratio Clearance Time (s) Vehicle Extension (s) Lane Grp Cap (vph) v/s Ratio Prot c.7 c.32 c v/s Ratio Perm.2.6 v/c Ratio Uniform Delay, d Progression Factor Incremental Delay, d Delay (s) Level of Service E E C B E A Approach Delay (s) Approach LOS E C B HCM 2 Control Delay 26.3 HCM 2 Level of Service C HCM 2 Volume to Capacity ratio.69 Actuated Cycle Length (s) 16. Sum of lost time (s) 13.5 Intersection Capacity Utilization 68.3% ICU Level of Service C Analysis Period (min) 15 c Critical Lane Group Page 2
238 Queues Future Total AM 2: US 1 & SE 9th Street 1/6/216 Lane Group EBT WBL WBT WBR NBL NBT NBR SBL SBT Lane Group Flow (vph) v/c Ratio Control Delay Queue Delay Total Delay Queue Length 5th (ft) Queue Length 95th (ft) #15 Internal Link Dist (ft) Turn Bay Length (ft) Base Capacity (vph) Starvation Cap Reductn Spillback Cap Reductn Storage Cap Reductn Reduced v/c Ratio # 95th percentile volume exceeds capacity, queue may be longer. Queue shown is maximum after two cycles. Page 3
239 HCM Signalized Intersection Capacity Analysis Future Total AM 2: US 1 & SE 9th Street 1/6/216 Movement EBL EBT EBR WBL WBT WBR NBL NBT NBR SBL SBT SBR Lane Configurations Traffic Volume (vph) Future Volume (vph) Ideal Flow (vphpl) Total Lost time (s) Lane Util. Factor Frt Flt Protected Satd. Flow (prot) Flt Permitted Satd. Flow (perm) Peak-hour factor, PHF Adj. Flow (vph) RTOR Reduction (vph) Lane Group Flow (vph) Turn Type Split NA Split NA Prot Prot NA Perm Prot NA Protected Phases Permitted Phases 2 Actuated Green, G (s) Effective Green, g (s) Actuated g/c Ratio Clearance Time (s) Vehicle Extension (s) Lane Grp Cap (vph) v/s Ratio Prot c.4 c.1.1. c.6 c.42.1 c.64 v/s Ratio Perm.1 v/c Ratio Uniform Delay, d Progression Factor Incremental Delay, d Delay (s) Level of Service E F E E F B A E C Approach Delay (s) Approach LOS E E B C HCM 2 Control Delay 26. HCM 2 Level of Service C HCM 2 Volume to Capacity ratio.89 Actuated Cycle Length (s) Sum of lost time (s) 27. Intersection Capacity Utilization 91.7% ICU Level of Service F Analysis Period (min) 15 c Critical Lane Group Page 4
240 Queues Future Total AM 3: US 1 & 3 rd Street 1/6/216 Lane Group EBL EBT WBL WBT WBR NBL NBT NBR SBL SBT Lane Group Flow (vph) v/c Ratio Control Delay Queue Delay Total Delay Queue Length 5th (ft) 142 ~ Queue Length 95th (ft) 217 # m32 m715 Internal Link Dist (ft) Turn Bay Length (ft) Base Capacity (vph) Starvation Cap Reductn Spillback Cap Reductn Storage Cap Reductn Reduced v/c Ratio ~ Volume exceeds capacity, queue is theoretically infinite. Queue shown is maximum after two cycles. # 95th percentile volume exceeds capacity, queue may be longer. Queue shown is maximum after two cycles. m Volume for 95th percentile queue is metered by upstream signal. Page 5
241 HCM Signalized Intersection Capacity Analysis Future Total AM 3: US 1 & 3 rd Street 1/6/216 Movement EBL EBT EBR WBL WBT WBR NBL NBT NBR SBL SBT SBR Lane Configurations Traffic Volume (vph) Future Volume (vph) Ideal Flow (vphpl) Total Lost time (s) Lane Util. Factor Frt Flt Protected Satd. Flow (prot) Flt Permitted Satd. Flow (perm) Peak-hour factor, PHF Adj. Flow (vph) RTOR Reduction (vph) Lane Group Flow (vph) Turn Type Split NA Split NA Prot Prot NA Perm Prot NA Protected Phases Permitted Phases 2 Actuated Green, G (s) Effective Green, g (s) Actuated g/c Ratio Clearance Time (s) Vehicle Extension (s) Lane Grp Cap (vph) v/s Ratio Prot.9 c.3 c.3.. c.4 c.39.1 c.42 v/s Ratio Perm.1 v/c Ratio Uniform Delay, d Progression Factor Incremental Delay, d Delay (s) Level of Service D F F E E F D C E E Approach Delay (s) Approach LOS F F D E HCM 2 Control Delay 66.1 HCM 2 Level of Service E HCM 2 Volume to Capacity ratio.96 Actuated Cycle Length (s) 16. Sum of lost time (s) 26. Intersection Capacity Utilization 1.1% ICU Level of Service G Analysis Period (min) 15 c Critical Lane Group Page 6
242 Queues Future Total AM 4: Dixie Highway & 3rd Street 1/6/216 Lane Group EBT WBT SBL SBT Lane Group Flow (vph) v/c Ratio Control Delay Queue Delay Total Delay Queue Length 5th (ft) Queue Length 95th (ft) # Internal Link Dist (ft) Turn Bay Length (ft) Base Capacity (vph) Starvation Cap Reductn 516 Spillback Cap Reductn Storage Cap Reductn Reduced v/c Ratio # 95th percentile volume exceeds capacity, queue may be longer. Queue shown is maximum after two cycles. Page 7
243 HCM Signalized Intersection Capacity Analysis Future Total AM 4: Dixie Highway & 3rd Street 1/6/216 Movement EBL EBT EBR WBL WBT WBR NBL NBT NBR SBL SBT SBR Lane Configurations Traffic Volume (vph) Future Volume (vph) Ideal Flow (vphpl) Total Lost time (s) Lane Util. Factor Frt Flt Protected Satd. Flow (prot) Flt Permitted Satd. Flow (perm) Peak-hour factor, PHF Adj. Flow (vph) RTOR Reduction (vph) 1 36 Lane Group Flow (vph) Turn Type NA Split NA Split NA Protected Phases Permitted Phases Actuated Green, G (s) Effective Green, g (s) Actuated g/c Ratio Clearance Time (s) Vehicle Extension (s) Lane Grp Cap (vph) v/s Ratio Prot c.16 c.9 c v/s Ratio Perm v/c Ratio Uniform Delay, d Progression Factor Incremental Delay, d Delay (s) Level of Service E A F D Approach Delay (s) Approach LOS E A A E HCM 2 Control Delay 63.2 HCM 2 Level of Service E HCM 2 Volume to Capacity ratio.62 Actuated Cycle Length (s) Sum of lost time (s) 16.5 Intersection Capacity Utilization 59.6% ICU Level of Service B Analysis Period (min) 15 c Critical Lane Group Page 8
244 Queues Future Total AM 5: 1st Avenue & 3rd Street 1/6/216 Lane Group EBT WBT WBR NBT Lane Group Flow (vph) v/c Ratio Control Delay Queue Delay Total Delay Queue Length 5th (ft) Queue Length 95th (ft) m# Internal Link Dist (ft) Turn Bay Length (ft) Base Capacity (vph) Starvation Cap Reductn 167 Spillback Cap Reductn 71 Storage Cap Reductn Reduced v/c Ratio # 95th percentile volume exceeds capacity, queue may be longer. Queue shown is maximum after two cycles. m Volume for 95th percentile queue is metered by upstream signal. Page 9
245 HCM Signalized Intersection Capacity Analysis Future Total AM 5: 1st Avenue & 3rd Street 1/6/216 Movement EBL EBT EBR WBL WBT WBR NBL NBT NBR SBL SBT SBR Lane Configurations Traffic Volume (vph) Future Volume (vph) Ideal Flow (vphpl) Total Lost time (s) Lane Util. Factor Frt Flt Protected Satd. Flow (prot) Flt Permitted Satd. Flow (perm) Peak-hour factor, PHF Adj. Flow (vph) RTOR Reduction (vph) 73 1 Lane Group Flow (vph) Turn Type Split NA NA Perm Split NA Protected Phases Permitted Phases 7 Actuated Green, G (s) Effective Green, g (s) Actuated g/c Ratio Clearance Time (s) Vehicle Extension (s) Lane Grp Cap (vph) v/s Ratio Prot c.39 c.5 c.1 v/s Ratio Perm. v/c Ratio Uniform Delay, d Progression Factor Incremental Delay, d Delay (s) Level of Service C E D C Approach Delay (s) Approach LOS C E C A HCM 2 Control Delay 32.1 HCM 2 Level of Service C HCM 2 Volume to Capacity ratio.62 Actuated Cycle Length (s) Sum of lost time (s) 16.5 Intersection Capacity Utilization 59.5% ICU Level of Service B Analysis Period (min) 15 c Critical Lane Group Page 1
246 Queues Future Total AM 6: US 1 & Hallandale Beach Boulevard 1/6/216 Lane Group EBL EBT WBL WBT NBL NBT NBR SBL SBT Lane Group Flow (vph) v/c Ratio Control Delay Queue Delay Total Delay Queue Length 5th (ft) ~ ~ Queue Length 95th (ft) # # # Internal Link Dist (ft) Turn Bay Length (ft) Base Capacity (vph) Starvation Cap Reductn Spillback Cap Reductn Storage Cap Reductn Reduced v/c Ratio ~ Volume exceeds capacity, queue is theoretically infinite. Queue shown is maximum after two cycles. # 95th percentile volume exceeds capacity, queue may be longer. Queue shown is maximum after two cycles. Page 11
247 HCM Signalized Intersection Capacity Analysis Future Total AM 6: US 1 & Hallandale Beach Boulevard 1/6/216 Movement EBL EBT EBR WBL WBT WBR NBL NBT NBR SBL SBT SBR Lane Configurations Traffic Volume (vph) Future Volume (vph) Ideal Flow (vphpl) Total Lost time (s) Lane Util. Factor Frt Flt Protected Satd. Flow (prot) Flt Permitted Satd. Flow (perm) Peak-hour factor, PHF Adj. Flow (vph) RTOR Reduction (vph) Lane Group Flow (vph) Turn Type Prot NA Prot NA Prot NA pm+ov Prot NA Protected Phases Permitted Phases 2 Actuated Green, G (s) Effective Green, g (s) Actuated g/c Ratio Clearance Time (s) Vehicle Extension (s) Lane Grp Cap (vph) v/s Ratio Prot c.2 c c.15 c.2 v/s Ratio Perm.14 v/c Ratio Uniform Delay, d Progression Factor Incremental Delay, d Delay (s) Level of Service F E F D F D A F D Approach Delay (s) Approach LOS E F D E HCM 2 Control Delay 79.7 HCM 2 Level of Service E HCM 2 Volume to Capacity ratio.96 Actuated Cycle Length (s) 16. Sum of lost time (s) 28. Intersection Capacity Utilization 88.4% ICU Level of Service E Analysis Period (min) 15 c Critical Lane Group Page 12
248 Queues Future Total AM 7: Hallandale Beach Boulevard & Dixie Highway 1/6/216 Lane Group EBT WBL WBT SBT Lane Group Flow (vph) v/c Ratio Control Delay Queue Delay Total Delay Queue Length 5th (ft) Queue Length 95th (ft) 44 m#24 m Internal Link Dist (ft) Turn Bay Length (ft) Base Capacity (vph) Starvation Cap Reductn Spillback Cap Reductn 155 Storage Cap Reductn Reduced v/c Ratio # 95th percentile volume exceeds capacity, queue may be longer. Queue shown is maximum after two cycles. m Volume for 95th percentile queue is metered by upstream signal. Page 13
249 HCM Signalized Intersection Capacity Analysis Future Total AM 7: Hallandale Beach Boulevard & Dixie Highway 1/6/216 Movement EBL EBT EBR WBL WBT WBR NBL NBT NBR SBL SBT SBR Lane Configurations Traffic Volume (vph) Future Volume (vph) Ideal Flow (vphpl) Total Lost time (s) Lane Util. Factor Frt Flt Protected Satd. Flow (prot) Flt Permitted Satd. Flow (perm) Peak-hour factor, PHF Adj. Flow (vph) RTOR Reduction (vph) 12 4 Lane Group Flow (vph) Turn Type NA Prot NA Perm NA Protected Phases Permitted Phases 4 Actuated Green, G (s) Effective Green, g (s) Actuated g/c Ratio Clearance Time (s) Vehicle Extension (s) Lane Grp Cap (vph) v/s Ratio Prot c.32 c.7.3 v/s Ratio Perm.16 v/c Ratio Uniform Delay, d Progression Factor Incremental Delay, d Delay (s) Level of Service C F A E Approach Delay (s) Approach LOS C B A E HCM 2 Control Delay 3.1 HCM 2 Level of Service C HCM 2 Volume to Capacity ratio.64 Actuated Cycle Length (s) 149. Sum of lost time (s) 22.5 Intersection Capacity Utilization 9.6% ICU Level of Service E Analysis Period (min) 15 c Critical Lane Group Page 14
250 Queues Future Total AM 8: 1st Avenue & Hallandale Beach Boulevard 1/6/216 Lane Group EBL EBT WBT NBL NBT NBR Lane Group Flow (vph) v/c Ratio Control Delay Queue Delay Total Delay Queue Length 5th (ft) ~ Queue Length 95th (ft) m #423 #31 18 Internal Link Dist (ft) Turn Bay Length (ft) Base Capacity (vph) Starvation Cap Reductn Spillback Cap Reductn Storage Cap Reductn Reduced v/c Ratio ~ Volume exceeds capacity, queue is theoretically infinite. Queue shown is maximum after two cycles. # 95th percentile volume exceeds capacity, queue may be longer. Queue shown is maximum after two cycles. m Volume for 95th percentile queue is metered by upstream signal. Page 15
251 HCM Signalized Intersection Capacity Analysis Future Total AM 8: 1st Avenue & Hallandale Beach Boulevard 1/6/216 Movement EBL EBT EBR WBL WBT WBR NBL NBT NBR SBL SBT SBR Lane Configurations Traffic Volume (vph) Future Volume (vph) Ideal Flow (vphpl) Total Lost time (s) Lane Util. Factor Frt Flt Protected Satd. Flow (prot) Flt Permitted Satd. Flow (perm) Peak-hour factor, PHF Adj. Flow (vph) RTOR Reduction (vph) 1 66 Lane Group Flow (vph) Turn Type Prot NA NA Perm NA Perm Protected Phases Permitted Phases 1 1 Actuated Green, G (s) Effective Green, g (s) Actuated g/c Ratio Clearance Time (s) Vehicle Extension (s) Lane Grp Cap (vph) v/s Ratio Prot.2 c.31 c.29.9 v/s Ratio Perm c.12. v/c Ratio Uniform Delay, d Progression Factor Incremental Delay, d Delay (s) Level of Service C A C F F E Approach Delay (s) Approach LOS A C F A HCM 2 Control Delay 29.8 HCM 2 Level of Service C HCM 2 Volume to Capacity ratio.64 Actuated Cycle Length (s) 149. Sum of lost time (s) 22.5 Intersection Capacity Utilization 9.6% ICU Level of Service E Analysis Period (min) 15 c Critical Lane Group Page 16
252 Queues Future Total AM 9: Hallandale Beach Boulevard & E 8th Avenue 1/6/216 Lane Group EBT EBR WBL WBT NBT SBL SBT SBR Lane Group Flow (vph) v/c Ratio Control Delay Queue Delay Total Delay Queue Length 5th (ft) Queue Length 95th (ft) m41 m8 m Internal Link Dist (ft) Turn Bay Length (ft) Base Capacity (vph) Starvation Cap Reductn Spillback Cap Reductn Storage Cap Reductn Reduced v/c Ratio m Volume for 95th percentile queue is metered by upstream signal. Page 17
253 HCM Signalized Intersection Capacity Analysis Future Total AM 9: Hallandale Beach Boulevard & E 8th Avenue 1/6/216 Movement EBL EBT EBR WBL WBT WBR NBL NBT NBR SBL SBT SBR Lane Configurations Traffic Volume (vph) Future Volume (vph) Ideal Flow (vphpl) Total Lost time (s) Lane Util. Factor Frt Flt Protected Satd. Flow (prot) Flt Permitted Satd. Flow (perm) Peak-hour factor, PHF Adj. Flow (vph) RTOR Reduction (vph) Lane Group Flow (vph) Turn Type NA Perm pm+pt NA Split NA Split NA Perm Protected Phases Permitted Phases Actuated Green, G (s) Effective Green, g (s) Actuated g/c Ratio Clearance Time (s) Vehicle Extension (s) Lane Grp Cap (vph) v/s Ratio Prot c.36.1 c.31 c.6 c.1. v/s Ratio Perm v/c Ratio Uniform Delay, d Progression Factor Incremental Delay, d Delay (s) Level of Service D D D B E D D D Approach Delay (s) Approach LOS D B E D HCM 2 Control Delay 3.4 HCM 2 Level of Service C HCM 2 Volume to Capacity ratio.61 Actuated Cycle Length (s) 16. Sum of lost time (s) 17. Intersection Capacity Utilization 55.5% ICU Level of Service B Analysis Period (min) 15 c Critical Lane Group Page 18
254 Queues Future Total AM 1: Hallandale Beach Boulevard & E 1th Avenue 1/6/216 Lane Group EBL EBT EBR WBL WBT WBR NBL NBT NBR SBT Lane Group Flow (vph) v/c Ratio Control Delay Queue Delay Total Delay Queue Length 5th (ft) Queue Length 95th (ft) m m Internal Link Dist (ft) Turn Bay Length (ft) Base Capacity (vph) Starvation Cap Reductn 26 Spillback Cap Reductn Storage Cap Reductn Reduced v/c Ratio m Volume for 95th percentile queue is metered by upstream signal. Page 19
255 HCM Signalized Intersection Capacity Analysis Future Total AM 1: Hallandale Beach Boulevard & E 1th Avenue 1/6/216 Movement EBL EBT EBR WBL WBT WBR NBL NBT NBR SBL SBT SBR Lane Configurations Traffic Volume (vph) Future Volume (vph) Ideal Flow (vphpl) Total Lost time (s) Lane Util. Factor Frt Flt Protected Satd. Flow (prot) Flt Permitted Satd. Flow (perm) Peak-hour factor, PHF Adj. Flow (vph) RTOR Reduction (vph) Lane Group Flow (vph) Turn Type Prot NA Perm Prot NA Perm Prot NA Perm Protected Phases Permitted Phases Actuated Green, G (s) Effective Green, g (s) Actuated g/c Ratio Clearance Time (s) Vehicle Extension (s) Lane Grp Cap (vph) v/s Ratio Prot c.5 c v/s Ratio Perm.2.2 c.3 v/c Ratio Uniform Delay, d Progression Factor Incremental Delay, d Delay (s) Level of Service F A A E C C C C D E Approach Delay (s) Approach LOS B C D E HCM 2 Control Delay 22.9 HCM 2 Level of Service C HCM 2 Volume to Capacity ratio.48 Actuated Cycle Length (s) 16. Sum of lost time (s) 13.5 Intersection Capacity Utilization Err% ICU Level of Service H Analysis Period (min) 15 c Critical Lane Group Page 2
256 Queues Future Total AM 11: Dixie Highway & County Line Road 1/6/216 Lane Group EBT WBT NBL NBR SBL SBT SBR Lane Group Flow (vph) v/c Ratio Control Delay Queue Delay Total Delay Queue Length 5th (ft) Queue Length 95th (ft) Internal Link Dist (ft) Turn Bay Length (ft) Base Capacity (vph) Starvation Cap Reductn Spillback Cap Reductn 12 1 Storage Cap Reductn Reduced v/c Ratio Page 21
257 HCM Signalized Intersection Capacity Analysis Future Total AM 11: Dixie Highway & County Line Road 1/6/216 Movement EBL EBT EBR WBL WBT WBR NBL NBT NBR SBL SBT SBR Lane Configurations Traffic Volume (vph) Future Volume (vph) Ideal Flow (vphpl) Total Lost time (s) Lane Util. Factor Frt Flt Protected Satd. Flow (prot) Flt Permitted Satd. Flow (perm) Peak-hour factor, PHF Adj. Flow (vph) RTOR Reduction (vph) Lane Group Flow (vph) Turn Type NA Split NA D.Pm Prot custom NA Perm Protected Phases Permitted Phases Actuated Green, G (s) Effective Green, g (s) Actuated g/c Ratio Clearance Time (s) Vehicle Extension (s) Lane Grp Cap (vph) v/s Ratio Prot c.13 c.16.6 c.7.14 v/s Ratio Perm v/c Ratio Uniform Delay, d Progression Factor Incremental Delay, d Delay (s) Level of Service D B C C C B B Approach Delay (s) Approach LOS D B C C HCM 2 Control Delay 27.7 HCM 2 Level of Service C HCM 2 Volume to Capacity ratio.67 Actuated Cycle Length (s) 97.9 Sum of lost time (s) 18. Intersection Capacity Utilization 65.5% ICU Level of Service C Analysis Period (min) 15 c Critical Lane Group Page 22
258 Queues Future Total AM 12: County Line Road & 1st Avenue 1/6/216 Lane Group EBL EBR NBL NBT SBT SBR Lane Group Flow (vph) v/c Ratio Control Delay Queue Delay Total Delay Queue Length 5th (ft) Queue Length 95th (ft) # Internal Link Dist (ft) Turn Bay Length (ft) Base Capacity (vph) Starvation Cap Reductn Spillback Cap Reductn 1 52 Storage Cap Reductn Reduced v/c Ratio # 95th percentile volume exceeds capacity, queue may be longer. Queue shown is maximum after two cycles. Page 23
259 HCM Signalized Intersection Capacity Analysis Future Total AM 12: County Line Road & 1st Avenue 1/6/216 Movement EBL EBR NBL NBT SBT SBR Lane Configurations Traffic Volume (vph) Future Volume (vph) Ideal Flow (vphpl) Total Lost time (s) Lane Util. Factor Frt Flt Protected Satd. Flow (prot) Flt Permitted Satd. Flow (perm) Peak-hour factor, PHF Adj. Flow (vph) RTOR Reduction (vph) Lane Group Flow (vph) Turn Type Prot Prot Perm NA NA Prot Protected Phases Permitted Phases 8 Actuated Green, G (s) Effective Green, g (s) Actuated g/c Ratio Clearance Time (s) Vehicle Extension (s) Lane Grp Cap (vph) v/s Ratio Prot.22 c.36 c v/s Ratio Perm.11 v/c Ratio Uniform Delay, d Progression Factor Incremental Delay, d Delay (s) Level of Service A C C D C C Approach Delay (s) Approach LOS B D C HCM 2 Control Delay 24.4 HCM 2 Level of Service C HCM 2 Volume to Capacity ratio.66 Actuated Cycle Length (s) 97.9 Sum of lost time (s) 18. Intersection Capacity Utilization 59.8% ICU Level of Service B Analysis Period (min) 15 c Critical Lane Group Page 24
260 HCM Unsignalized Intersection Capacity Analysis Future Total AM 13: E 1st Avenue & NE 214th Terr 1/6/216 Movement WBL WBR NBT NBR SBL SBT Lane Configurations Traffic Volume (veh/h) Future Volume (Veh/h) Sign Control Stop Free Free Grade % % % Peak Hour Factor Hourly flow rate (vph) Pedestrians Lane Width (ft) Walking Speed (ft/s) Percent Blockage Right turn flare (veh) Median type None None Median storage veh) Upstream signal (ft) 144 px, platoon unblocked vc, conflicting volume vc1, stage 1 conf vol vc2, stage 2 conf vol vcu, unblocked vol tc, single (s) tc, 2 stage (s) tf (s) p queue free % cm capacity (veh/h) Direction, Lane # WB 1 NB 1 SB 1 Volume Total Volume Left Volume Right csh Volume to Capacity... Queue Length 95th (ft) Control Delay (s)... Lane LOS A Approach Delay (s)... Approach LOS A Average Delay. Intersection Capacity Utilization.% ICU Level of Service A Analysis Period (min) 15 Page 25
261 HCM Unsignalized Intersection Capacity Analysis Future Total AM 14: SE 3rd Ave & SE 1th Ct 1/6/216 Movement EBL EBT EBR WBL WBT WBR NBL NBT NBR SBL SBT SBR Lane Configurations Traffic Volume (veh/h) Future Volume (Veh/h) Sign Control Free Free Stop Stop Grade % % % % Peak Hour Factor Hourly flow rate (vph) Pedestrians Lane Width (ft) Walking Speed (ft/s) Percent Blockage Right turn flare (veh) Median type None None Median storage veh) Upstream signal (ft) px, platoon unblocked vc, conflicting volume vc1, stage 1 conf vol vc2, stage 2 conf vol vcu, unblocked vol tc, single (s) tc, 2 stage (s) tf (s) p queue free % cm capacity (veh/h) Direction, Lane # EB 1 WB 1 NB 1 SB 1 Volume Total Volume Left Volume Right csh Volume to Capacity Queue Length 95th (ft) Control Delay (s) Lane LOS A A B B Approach Delay (s) Approach LOS B B Average Delay 8. Intersection Capacity Utilization 28.3% ICU Level of Service A Analysis Period (min) 15 Page 26
262 HCM Unsignalized Intersection Capacity Analysis Future Total AM 37: NE 214th Terr & SE 3rd Ave 1/6/216 Movement EBL EBT WBT WBR SBL SBR Lane Configurations Traffic Volume (veh/h) Future Volume (Veh/h) Sign Control Free Free Stop Grade % % % Peak Hour Factor Hourly flow rate (vph) Pedestrians Lane Width (ft) Walking Speed (ft/s) Percent Blockage Right turn flare (veh) Median type None None Median storage veh) Upstream signal (ft) px, platoon unblocked vc, conflicting volume vc1, stage 1 conf vol vc2, stage 2 conf vol vcu, unblocked vol tc, single (s) tc, 2 stage (s) tf (s) p queue free % cm capacity (veh/h) Direction, Lane # EB 1 WB 1 SB 1 Volume Total Volume Left 42 Volume Right 2 67 csh Volume to Capacity.3..6 Queue Length 95th (ft) 2 5 Control Delay (s) Lane LOS A A Approach Delay (s) Approach LOS A Average Delay 6.9 Intersection Capacity Utilization 19.9% ICU Level of Service A Analysis Period (min) 15 Page 27
263 HCM Unsignalized Intersection Capacity Analysis Future Total AM 41: Optima Office Drive 1/6/216 Movement EBL EBR NBL NBT SBT SBR Lane Configurations Traffic Volume (veh/h) Future Volume (Veh/h) Sign Control Stop Free Free Grade % % % Peak Hour Factor Hourly flow rate (vph) Pedestrians Lane Width (ft) Walking Speed (ft/s) Percent Blockage Right turn flare (veh) Median type None None Median storage veh) Upstream signal (ft) px, platoon unblocked vc, conflicting volume vc1, stage 1 conf vol vc2, stage 2 conf vol vcu, unblocked vol tc, single (s) tc, 2 stage (s) tf (s) p queue free % 64 cm capacity (veh/h) Direction, Lane # EB 1 NB 1 NB 2 NB 3 NB 4 SB 1 SB 2 SB 3 Volume Total Volume Left 222 Volume Right csh Volume to Capacity Queue Length 95th (ft) Control Delay (s) Lane LOS C F Approach Delay (s) Approach LOS C Average Delay 11.3 Intersection Capacity Utilization 8.8% ICU Level of Service D Analysis Period (min) 15 Page 28
264 HCM Unsignalized Intersection Capacity Analysis Future Total AM 46: Optima Drive 1/6/216 Movement EBL EBT WBT WBR SBL SBR Lane Configurations Traffic Volume (veh/h) Future Volume (Veh/h) Sign Control Free Free Stop Grade % % % Peak Hour Factor Hourly flow rate (vph) Pedestrians Lane Width (ft) Walking Speed (ft/s) Percent Blockage Right turn flare (veh) Median type None None Median storage veh) Upstream signal (ft) px, platoon unblocked vc, conflicting volume vc1, stage 1 conf vol vc2, stage 2 conf vol vcu, unblocked vol tc, single (s) tc, 2 stage (s) tf (s) p queue free % cm capacity (veh/h) Direction, Lane # EB 1 WB 1 SB 1 Volume Total Volume Left Volume Right csh Volume to Capacity... Queue Length 95th (ft) Control Delay (s)... Lane LOS A Approach Delay (s)... Approach LOS A Average Delay. Intersection Capacity Utilization.% ICU Level of Service A Analysis Period (min) 15 Page 29
265 Queues Future Background AM 1: Biscayne Boulevard & NE 213th Street 1/6/216 Lane Group WBL WBR NBT NBR SBL SBT Lane Group Flow (vph) v/c Ratio Control Delay Queue Delay Total Delay Queue Length 5th (ft) Queue Length 95th (ft) Internal Link Dist (ft) Turn Bay Length (ft) Base Capacity (vph) Starvation Cap Reductn Spillback Cap Reductn Storage Cap Reductn Reduced v/c Ratio Page 1
266 HCM Signalized Intersection Capacity Analysis Future Background AM 1: Biscayne Boulevard & NE 213th Street 1/6/216 Movement WBL WBR NBT NBR SBL SBT Lane Configurations Traffic Volume (vph) Future Volume (vph) Ideal Flow (vphpl) Total Lost time (s) Lane Util. Factor Frt Flt Protected Satd. Flow (prot) Flt Permitted Satd. Flow (perm) Peak-hour factor, PHF Adj. Flow (vph) RTOR Reduction (vph) Lane Group Flow (vph) Turn Type Prot Perm NA Perm Prot NA Protected Phases Permitted Phases 8 2 Actuated Green, G (s) Effective Green, g (s) Actuated g/c Ratio Clearance Time (s) Vehicle Extension (s) Lane Grp Cap (vph) v/s Ratio Prot c.7.3 c.24 c.47 v/s Ratio Perm.2.6 v/c Ratio Uniform Delay, d Progression Factor Incremental Delay, d Delay (s) Level of Service E E C B E A Approach Delay (s) Approach LOS E C B HCM 2 Control Delay 25.5 HCM 2 Level of Service C HCM 2 Volume to Capacity ratio.68 Actuated Cycle Length (s) 16. Sum of lost time (s) 13.5 Intersection Capacity Utilization 66.4% ICU Level of Service C Analysis Period (min) 15 c Critical Lane Group Page 2
267 Queues Future Background AM 2: US 1 & SE 9th Street 1/6/216 Lane Group EBT WBL WBT WBR NBL NBT NBR SBL SBT Lane Group Flow (vph) v/c Ratio Control Delay Queue Delay Total Delay Queue Length 5th (ft) Queue Length 95th (ft) #126 Internal Link Dist (ft) Turn Bay Length (ft) Base Capacity (vph) Starvation Cap Reductn Spillback Cap Reductn Storage Cap Reductn Reduced v/c Ratio # 95th percentile volume exceeds capacity, queue may be longer. Queue shown is maximum after two cycles. Page 3
268 HCM Signalized Intersection Capacity Analysis Future Background AM 2: US 1 & SE 9th Street 1/6/216 Movement EBL EBT EBR WBL WBT WBR NBL NBT NBR SBL SBT SBR Lane Configurations Traffic Volume (vph) Future Volume (vph) Ideal Flow (vphpl) Total Lost time (s) Lane Util. Factor Frt Flt Protected Satd. Flow (prot) Flt Permitted Satd. Flow (perm) Peak-hour factor, PHF Adj. Flow (vph) RTOR Reduction (vph) Lane Group Flow (vph) Turn Type Split NA Split NA Prot Prot NA Perm Prot NA Protected Phases Permitted Phases 2 Actuated Green, G (s) Effective Green, g (s) Actuated g/c Ratio Clearance Time (s) Vehicle Extension (s) Lane Grp Cap (vph) v/s Ratio Prot c.4 c.1.1. c c.58 v/s Ratio Perm.1 v/c Ratio Uniform Delay, d Progression Factor Incremental Delay, d Delay (s) Level of Service E F E E F B A E C Approach Delay (s) Approach LOS E E B C HCM 2 Control Delay 21.8 HCM 2 Level of Service C HCM 2 Volume to Capacity ratio.82 Actuated Cycle Length (s) Sum of lost time (s) 27. Intersection Capacity Utilization 86.2% ICU Level of Service E Analysis Period (min) 15 c Critical Lane Group Page 4
269 Queues Future Background AM 3: US 1 & 3 rd Street 1/6/216 Lane Group EBL EBT WBL WBT WBR NBL NBT NBR SBL SBT Lane Group Flow (vph) v/c Ratio Control Delay Queue Delay Total Delay Queue Length 5th (ft) 142 ~ Queue Length 95th (ft) 217 # m35 m694 Internal Link Dist (ft) Turn Bay Length (ft) Base Capacity (vph) Starvation Cap Reductn Spillback Cap Reductn Storage Cap Reductn Reduced v/c Ratio ~ Volume exceeds capacity, queue is theoretically infinite. Queue shown is maximum after two cycles. # 95th percentile volume exceeds capacity, queue may be longer. Queue shown is maximum after two cycles. m Volume for 95th percentile queue is metered by upstream signal. Page 5
270 HCM Signalized Intersection Capacity Analysis Future Background AM 3: US 1 & 3 rd Street 1/6/216 Movement EBL EBT EBR WBL WBT WBR NBL NBT NBR SBL SBT SBR Lane Configurations Traffic Volume (vph) Future Volume (vph) Ideal Flow (vphpl) Total Lost time (s) Lane Util. Factor Frt Flt Protected Satd. Flow (prot) Flt Permitted Satd. Flow (perm) Peak-hour factor, PHF Adj. Flow (vph) RTOR Reduction (vph) Lane Group Flow (vph) Turn Type Split NA Split NA Prot Prot NA Perm Prot NA Protected Phases Permitted Phases 2 Actuated Green, G (s) Effective Green, g (s) Actuated g/c Ratio Clearance Time (s) Vehicle Extension (s) Lane Grp Cap (vph) v/s Ratio Prot.9 c.3 c.3.. c.4 c.39.1 c.4 v/s Ratio Perm.1 v/c Ratio Uniform Delay, d Progression Factor Incremental Delay, d Delay (s) Level of Service D F F E E F D C E E Approach Delay (s) Approach LOS F F D E HCM 2 Control Delay 65. HCM 2 Level of Service E HCM 2 Volume to Capacity ratio.94 Actuated Cycle Length (s) 16. Sum of lost time (s) 26. Intersection Capacity Utilization 98.8% ICU Level of Service F Analysis Period (min) 15 c Critical Lane Group Page 6
271 Queues Future Background AM 4: Dixie Highway & 3rd Street 1/6/216 Lane Group EBT WBT SBL SBT Lane Group Flow (vph) v/c Ratio Control Delay Queue Delay Total Delay Queue Length 5th (ft) Queue Length 95th (ft) # Internal Link Dist (ft) Turn Bay Length (ft) Base Capacity (vph) Starvation Cap Reductn 514 Spillback Cap Reductn Storage Cap Reductn Reduced v/c Ratio # 95th percentile volume exceeds capacity, queue may be longer. Queue shown is maximum after two cycles. Page 7
272 HCM Signalized Intersection Capacity Analysis Future Background AM 4: Dixie Highway & 3rd Street 1/6/216 Movement EBL EBT EBR WBL WBT WBR NBL NBT NBR SBL SBT SBR Lane Configurations Traffic Volume (vph) Future Volume (vph) Ideal Flow (vphpl) Total Lost time (s) Lane Util. Factor Frt Flt Protected Satd. Flow (prot) Flt Permitted Satd. Flow (perm) Peak-hour factor, PHF Adj. Flow (vph) RTOR Reduction (vph) 1 11 Lane Group Flow (vph) Turn Type NA Split NA Split NA Protected Phases Permitted Phases Actuated Green, G (s) Effective Green, g (s) Actuated g/c Ratio Clearance Time (s) Vehicle Extension (s) Lane Grp Cap (vph) v/s Ratio Prot c.16 c.9 c v/s Ratio Perm v/c Ratio Uniform Delay, d Progression Factor Incremental Delay, d Delay (s) Level of Service E A F D Approach Delay (s) Approach LOS E A A E HCM 2 Control Delay 6.1 HCM 2 Level of Service E HCM 2 Volume to Capacity ratio.62 Actuated Cycle Length (s) Sum of lost time (s) 16.5 Intersection Capacity Utilization 59.6% ICU Level of Service B Analysis Period (min) 15 c Critical Lane Group Page 8
273 Queues Future Background AM 5: 1st Avenue & 3rd Street 1/6/216 Lane Group EBT WBT WBR NBT Lane Group Flow (vph) v/c Ratio Control Delay Queue Delay Total Delay Queue Length 5th (ft) Queue Length 95th (ft) m# Internal Link Dist (ft) Turn Bay Length (ft) Base Capacity (vph) Starvation Cap Reductn 167 Spillback Cap Reductn 85 Storage Cap Reductn Reduced v/c Ratio # 95th percentile volume exceeds capacity, queue may be longer. Queue shown is maximum after two cycles. m Volume for 95th percentile queue is metered by upstream signal. Page 9
274 HCM Signalized Intersection Capacity Analysis Future Background AM 5: 1st Avenue & 3rd Street 1/6/216 Movement EBL EBT EBR WBL WBT WBR NBL NBT NBR SBL SBT SBR Lane Configurations Traffic Volume (vph) Future Volume (vph) Ideal Flow (vphpl) Total Lost time (s) Lane Util. Factor Frt Flt Protected Satd. Flow (prot) Flt Permitted Satd. Flow (perm) Peak-hour factor, PHF Adj. Flow (vph) RTOR Reduction (vph) 73 1 Lane Group Flow (vph) Turn Type Split NA NA Perm Split NA Protected Phases Permitted Phases 7 Actuated Green, G (s) Effective Green, g (s) Actuated g/c Ratio Clearance Time (s) Vehicle Extension (s) Lane Grp Cap (vph) v/s Ratio Prot c.39 c.5 c.1 v/s Ratio Perm. v/c Ratio Uniform Delay, d Progression Factor Incremental Delay, d Delay (s) Level of Service C E D C Approach Delay (s) Approach LOS C E C A HCM 2 Control Delay 32.9 HCM 2 Level of Service C HCM 2 Volume to Capacity ratio.61 Actuated Cycle Length (s) Sum of lost time (s) 16.5 Intersection Capacity Utilization 58.9% ICU Level of Service B Analysis Period (min) 15 c Critical Lane Group Page 1
275 Queues Future Background AM 6: US 1 & Hallandale Beach Boulevard 1/6/216 Lane Group EBL EBT WBL WBT NBL NBT NBR SBL SBT Lane Group Flow (vph) v/c Ratio Control Delay Queue Delay Total Delay Queue Length 5th (ft) ~ ~ Queue Length 95th (ft) # # # Internal Link Dist (ft) Turn Bay Length (ft) Base Capacity (vph) Starvation Cap Reductn Spillback Cap Reductn Storage Cap Reductn Reduced v/c Ratio ~ Volume exceeds capacity, queue is theoretically infinite. Queue shown is maximum after two cycles. # 95th percentile volume exceeds capacity, queue may be longer. Queue shown is maximum after two cycles. Page 11
276 HCM Signalized Intersection Capacity Analysis Future Background AM 6: US 1 & Hallandale Beach Boulevard 1/6/216 Movement EBL EBT EBR WBL WBT WBR NBL NBT NBR SBL SBT SBR Lane Configurations Traffic Volume (vph) Future Volume (vph) Ideal Flow (vphpl) Total Lost time (s) Lane Util. Factor Frt Flt Protected Satd. Flow (prot) Flt Permitted Satd. Flow (perm) Peak-hour factor, PHF Adj. Flow (vph) RTOR Reduction (vph) Lane Group Flow (vph) Turn Type Prot NA Prot NA Prot NA pm+ov Prot NA Protected Phases Permitted Phases 2 Actuated Green, G (s) Effective Green, g (s) Actuated g/c Ratio Clearance Time (s) Vehicle Extension (s) Lane Grp Cap (vph) v/s Ratio Prot c.19 c c.15 c.2 v/s Ratio Perm.14 v/c Ratio Uniform Delay, d Progression Factor Incremental Delay, d Delay (s) Level of Service F E F D F D A F D Approach Delay (s) Approach LOS E F D E HCM 2 Control Delay 76.8 HCM 2 Level of Service E HCM 2 Volume to Capacity ratio.94 Actuated Cycle Length (s) 16. Sum of lost time (s) 28. Intersection Capacity Utilization 87.5% ICU Level of Service E Analysis Period (min) 15 c Critical Lane Group Page 12
277 Queues Future Background AM 7: Hallandale Beach Boulevard & Dixie Highway 1/6/216 Lane Group EBT WBL WBT SBT Lane Group Flow (vph) v/c Ratio Control Delay Queue Delay Total Delay Queue Length 5th (ft) Queue Length 95th (ft) 43 m#29 m76 31 Internal Link Dist (ft) Turn Bay Length (ft) Base Capacity (vph) Starvation Cap Reductn Spillback Cap Reductn 161 Storage Cap Reductn Reduced v/c Ratio # 95th percentile volume exceeds capacity, queue may be longer. Queue shown is maximum after two cycles. m Volume for 95th percentile queue is metered by upstream signal. Page 13
278 HCM Signalized Intersection Capacity Analysis Future Background AM 7: Hallandale Beach Boulevard & Dixie Highway 1/6/216 Movement EBL EBT EBR WBL WBT WBR NBL NBT NBR SBL SBT SBR Lane Configurations Traffic Volume (vph) Future Volume (vph) Ideal Flow (vphpl) Total Lost time (s) Lane Util. Factor Frt Flt Protected Satd. Flow (prot) Flt Permitted Satd. Flow (perm) Peak-hour factor, PHF Adj. Flow (vph) RTOR Reduction (vph) 5 4 Lane Group Flow (vph) Turn Type NA Prot NA Perm NA Protected Phases Permitted Phases 4 Actuated Green, G (s) Effective Green, g (s) Actuated g/c Ratio Clearance Time (s) Vehicle Extension (s) Lane Grp Cap (vph) v/s Ratio Prot c.3 c.7.3 v/s Ratio Perm.15 v/c Ratio Uniform Delay, d Progression Factor Incremental Delay, d Delay (s) Level of Service C F A E Approach Delay (s) Approach LOS C B A E HCM 2 Control Delay 28.7 HCM 2 Level of Service C HCM 2 Volume to Capacity ratio.61 Actuated Cycle Length (s) 149. Sum of lost time (s) 22.5 Intersection Capacity Utilization 87.1% ICU Level of Service E Analysis Period (min) 15 c Critical Lane Group Page 14
279 Queues Future Background AM 8: 1st Avenue & Hallandale Beach Boulevard 1/6/216 Lane Group EBL EBT WBT NBL NBT NBR Lane Group Flow (vph) v/c Ratio Control Delay Queue Delay Total Delay Queue Length 5th (ft) ~ Queue Length 95th (ft) m #391 #29 18 Internal Link Dist (ft) Turn Bay Length (ft) Base Capacity (vph) Starvation Cap Reductn Spillback Cap Reductn Storage Cap Reductn Reduced v/c Ratio ~ Volume exceeds capacity, queue is theoretically infinite. Queue shown is maximum after two cycles. # 95th percentile volume exceeds capacity, queue may be longer. Queue shown is maximum after two cycles. m Volume for 95th percentile queue is metered by upstream signal. Page 15
280 HCM Signalized Intersection Capacity Analysis Future Background AM 8: 1st Avenue & Hallandale Beach Boulevard 1/6/216 Movement EBL EBT EBR WBL WBT WBR NBL NBT NBR SBL SBT SBR Lane Configurations Traffic Volume (vph) Future Volume (vph) Ideal Flow (vphpl) Total Lost time (s) Lane Util. Factor Frt Flt Protected Satd. Flow (prot) Flt Permitted Satd. Flow (perm) Peak-hour factor, PHF Adj. Flow (vph) RTOR Reduction (vph) 1 66 Lane Group Flow (vph) Turn Type Prot NA NA Perm NA Perm Protected Phases Permitted Phases 1 1 Actuated Green, G (s) Effective Green, g (s) Actuated g/c Ratio Clearance Time (s) Vehicle Extension (s) Lane Grp Cap (vph) v/s Ratio Prot.2 c.31 c.29.9 v/s Ratio Perm c.11. v/c Ratio Uniform Delay, d Progression Factor Incremental Delay, d Delay (s) Level of Service C A C F F E Approach Delay (s) Approach LOS A C F A HCM 2 Control Delay 26.6 HCM 2 Level of Service C HCM 2 Volume to Capacity ratio.63 Actuated Cycle Length (s) 149. Sum of lost time (s) 22.5 Intersection Capacity Utilization 87.1% ICU Level of Service E Analysis Period (min) 15 c Critical Lane Group Page 16
281 Queues Future Background AM 9: Hallandale Beach Boulevard & E 8th Avenue 1/6/216 Lane Group EBT EBR WBL WBT NBT SBL SBT SBR Lane Group Flow (vph) v/c Ratio Control Delay Queue Delay Total Delay Queue Length 5th (ft) Queue Length 95th (ft) m397 m8 m Internal Link Dist (ft) Turn Bay Length (ft) Base Capacity (vph) Starvation Cap Reductn Spillback Cap Reductn Storage Cap Reductn Reduced v/c Ratio m Volume for 95th percentile queue is metered by upstream signal. Page 17
282 HCM Signalized Intersection Capacity Analysis Future Background AM 9: Hallandale Beach Boulevard & E 8th Avenue 1/6/216 Movement EBL EBT EBR WBL WBT WBR NBL NBT NBR SBL SBT SBR Lane Configurations Traffic Volume (vph) Future Volume (vph) Ideal Flow (vphpl) Total Lost time (s) Lane Util. Factor Frt Flt Protected Satd. Flow (prot) Flt Permitted Satd. Flow (perm) Peak-hour factor, PHF Adj. Flow (vph) RTOR Reduction (vph) Lane Group Flow (vph) Turn Type NA Perm pm+pt NA Split NA Split NA Perm Protected Phases Permitted Phases Actuated Green, G (s) Effective Green, g (s) Actuated g/c Ratio Clearance Time (s) Vehicle Extension (s) Lane Grp Cap (vph) v/s Ratio Prot c.36.1 c.3 c.6 c.1. v/s Ratio Perm v/c Ratio Uniform Delay, d Progression Factor Incremental Delay, d Delay (s) Level of Service D D D B E D D D Approach Delay (s) Approach LOS D B E D HCM 2 Control Delay 3.4 HCM 2 Level of Service C HCM 2 Volume to Capacity ratio.61 Actuated Cycle Length (s) 16. Sum of lost time (s) 17. Intersection Capacity Utilization 55.1% ICU Level of Service B Analysis Period (min) 15 c Critical Lane Group Page 18
283 Queues Future Background AM 1: Hallandale Beach Boulevard & E 1th Avenue 1/6/216 Lane Group EBL EBT EBR WBL WBT WBR NBL NBT NBR SBT Lane Group Flow (vph) v/c Ratio Control Delay Queue Delay Total Delay Queue Length 5th (ft) Queue Length 95th (ft) m m Internal Link Dist (ft) Turn Bay Length (ft) Base Capacity (vph) Starvation Cap Reductn 26 Spillback Cap Reductn Storage Cap Reductn Reduced v/c Ratio m Volume for 95th percentile queue is metered by upstream signal. Page 19
284 HCM Signalized Intersection Capacity Analysis Future Background AM 1: Hallandale Beach Boulevard & E 1th Avenue 1/6/216 Movement EBL EBT EBR WBL WBT WBR NBL NBT NBR SBL SBT SBR Lane Configurations Traffic Volume (vph) Future Volume (vph) Ideal Flow (vphpl) Total Lost time (s) Lane Util. Factor Frt Flt Protected Satd. Flow (prot) Flt Permitted Satd. Flow (perm) Peak-hour factor, PHF Adj. Flow (vph) RTOR Reduction (vph) Lane Group Flow (vph) Turn Type Prot NA Perm Prot NA Perm Prot NA Perm Protected Phases Permitted Phases Actuated Green, G (s) Effective Green, g (s) Actuated g/c Ratio Clearance Time (s) Vehicle Extension (s) Lane Grp Cap (vph) v/s Ratio Prot c.5 c v/s Ratio Perm.2.2 c.3 v/c Ratio Uniform Delay, d Progression Factor Incremental Delay, d Delay (s) Level of Service F A A E C C C C D E Approach Delay (s) Approach LOS B C C E HCM 2 Control Delay 22.8 HCM 2 Level of Service C HCM 2 Volume to Capacity ratio.48 Actuated Cycle Length (s) 16. Sum of lost time (s) 13.5 Intersection Capacity Utilization Err% ICU Level of Service H Analysis Period (min) 15 c Critical Lane Group Page 2
285 Queues Future Background AM 11: Dixie Highway & County Line Road 1/6/216 Lane Group EBT WBT NBL NBR SBL SBT SBR Lane Group Flow (vph) v/c Ratio Control Delay Queue Delay Total Delay Queue Length 5th (ft) Queue Length 95th (ft) Internal Link Dist (ft) Turn Bay Length (ft) Base Capacity (vph) Starvation Cap Reductn Spillback Cap Reductn 12 1 Storage Cap Reductn Reduced v/c Ratio Page 21
286 HCM Signalized Intersection Capacity Analysis Future Background AM 11: Dixie Highway & County Line Road 1/6/216 Movement EBL EBT EBR WBL WBT WBR NBL NBT NBR SBL SBT SBR Lane Configurations Traffic Volume (vph) Future Volume (vph) Ideal Flow (vphpl) Total Lost time (s) Lane Util. Factor Frt Flt Protected Satd. Flow (prot) Flt Permitted Satd. Flow (perm) Peak-hour factor, PHF Adj. Flow (vph) RTOR Reduction (vph) Lane Group Flow (vph) Turn Type NA Split NA D.Pm Prot custom NA Perm Protected Phases Permitted Phases Actuated Green, G (s) Effective Green, g (s) Actuated g/c Ratio Clearance Time (s) Vehicle Extension (s) Lane Grp Cap (vph) v/s Ratio Prot c.13 c.16.6 c.7.13 v/s Ratio Perm v/c Ratio Uniform Delay, d Progression Factor Incremental Delay, d Delay (s) Level of Service D B C C C B B Approach Delay (s) Approach LOS D B C C HCM 2 Control Delay 27.8 HCM 2 Level of Service C HCM 2 Volume to Capacity ratio.67 Actuated Cycle Length (s) 97.8 Sum of lost time (s) 18. Intersection Capacity Utilization 65.5% ICU Level of Service C Analysis Period (min) 15 c Critical Lane Group Page 22
287 Queues Future Background AM 12: County Line Road & 1st Avenue 1/6/216 Lane Group EBL EBR NBL NBT SBT SBR Lane Group Flow (vph) v/c Ratio Control Delay Queue Delay Total Delay Queue Length 5th (ft) Queue Length 95th (ft) Internal Link Dist (ft) Turn Bay Length (ft) Base Capacity (vph) Starvation Cap Reductn Spillback Cap Reductn 1 52 Storage Cap Reductn Reduced v/c Ratio Page 23
288 HCM Signalized Intersection Capacity Analysis Future Background AM 12: County Line Road & 1st Avenue 1/6/216 Movement EBL EBR NBL NBT SBT SBR Lane Configurations Traffic Volume (vph) Future Volume (vph) Ideal Flow (vphpl) Total Lost time (s) Lane Util. Factor Frt Flt Protected Satd. Flow (prot) Flt Permitted Satd. Flow (perm) Peak-hour factor, PHF Adj. Flow (vph) RTOR Reduction (vph) Lane Group Flow (vph) Turn Type Prot Prot Perm NA NA Prot Protected Phases Permitted Phases 8 Actuated Green, G (s) Effective Green, g (s) Actuated g/c Ratio Clearance Time (s) Vehicle Extension (s) Lane Grp Cap (vph) v/s Ratio Prot.22 c v/s Ratio Perm c.11 v/c Ratio Uniform Delay, d Progression Factor Incremental Delay, d Delay (s) Level of Service A C C C C C Approach Delay (s) Approach LOS B C C HCM 2 Control Delay 22.3 HCM 2 Level of Service C HCM 2 Volume to Capacity ratio.58 Actuated Cycle Length (s) 97.8 Sum of lost time (s) 18. Intersection Capacity Utilization 59.8% ICU Level of Service B Analysis Period (min) 15 c Critical Lane Group Page 24
289 HCM Unsignalized Intersection Capacity Analysis Future Background AM 13: E 1st Avenue & NE 214th Terr 1/6/216 Movement WBL WBR NBT NBR SBL SBT Lane Configurations Traffic Volume (veh/h) Future Volume (Veh/h) Sign Control Stop Free Free Grade % % % Peak Hour Factor Hourly flow rate (vph) Pedestrians Lane Width (ft) Walking Speed (ft/s) Percent Blockage Right turn flare (veh) Median type None None Median storage veh) Upstream signal (ft) 144 px, platoon unblocked vc, conflicting volume vc1, stage 1 conf vol vc2, stage 2 conf vol vcu, unblocked vol tc, single (s) tc, 2 stage (s) tf (s) p queue free % cm capacity (veh/h) Direction, Lane # WB 1 NB 1 SB 1 Volume Total Volume Left Volume Right csh Volume to Capacity... Queue Length 95th (ft) Control Delay (s)... Lane LOS A Approach Delay (s)... Approach LOS A Average Delay. Intersection Capacity Utilization.% ICU Level of Service A Analysis Period (min) 15 Page 25
290 HCM Unsignalized Intersection Capacity Analysis Future Background AM 14: SE 3rd Ave & SE 1th Ct 1/6/216 Movement EBL EBT EBR WBL WBT WBR NBL NBT NBR SBL SBT SBR Lane Configurations Traffic Volume (veh/h) Future Volume (Veh/h) Sign Control Free Free Stop Stop Grade % % % % Peak Hour Factor Hourly flow rate (vph) Pedestrians Lane Width (ft) Walking Speed (ft/s) Percent Blockage Right turn flare (veh) Median type None None Median storage veh) Upstream signal (ft) px, platoon unblocked vc, conflicting volume vc1, stage 1 conf vol vc2, stage 2 conf vol vcu, unblocked vol tc, single (s) tc, 2 stage (s) tf (s) p queue free % cm capacity (veh/h) Direction, Lane # EB 1 WB 1 NB 1 SB 1 Volume Total Volume Left Volume Right csh Volume to Capacity Queue Length 95th (ft) Control Delay (s) Lane LOS A A A B Approach Delay (s) Approach LOS A B Average Delay 6.3 Intersection Capacity Utilization 22.1% ICU Level of Service A Analysis Period (min) 15 Page 26
291 HCM Unsignalized Intersection Capacity Analysis Future Background AM 37: NE 214th Terr & SE 3rd Ave 1/6/216 Movement EBL EBT WBT WBR SBL SBR Lane Configurations Traffic Volume (veh/h) Future Volume (Veh/h) Sign Control Free Free Stop Grade % % % Peak Hour Factor Hourly flow rate (vph) Pedestrians Lane Width (ft) Walking Speed (ft/s) Percent Blockage Right turn flare (veh) Median type None None Median storage veh) Upstream signal (ft) px, platoon unblocked vc, conflicting volume vc1, stage 1 conf vol vc2, stage 2 conf vol vcu, unblocked vol tc, single (s) tc, 2 stage (s) tf (s) p queue free % cm capacity (veh/h) Direction, Lane # EB 1 WB 1 SB 1 Volume Total Volume Left 42 Volume Right 2 29 csh Volume to Capacity.3..3 Queue Length 95th (ft) 2 2 Control Delay (s) Lane LOS A A Approach Delay (s) Approach LOS A Average Delay 6.2 Intersection Capacity Utilization 19.4% ICU Level of Service A Analysis Period (min) 15 Page 27
292 HCM Unsignalized Intersection Capacity Analysis Future Background AM 41: Optima Office Drive 1/6/216 Movement EBL EBR NBL NBT SBT SBR Lane Configurations Traffic Volume (veh/h) Future Volume (Veh/h) Sign Control Stop Free Free Grade % % % Peak Hour Factor Hourly flow rate (vph) Pedestrians Lane Width (ft) Walking Speed (ft/s) Percent Blockage Right turn flare (veh) Median type None None Median storage veh) Upstream signal (ft) px, platoon unblocked vc, conflicting volume vc1, stage 1 conf vol vc2, stage 2 conf vol vcu, unblocked vol tc, single (s) tc, 2 stage (s) tf (s) p queue free % cm capacity (veh/h) Direction, Lane # EB 1 NB 1 NB 2 NB 3 NB 4 SB 1 SB 2 SB 3 Volume Total Volume Left 1 9 Volume Right csh Volume to Capacity Queue Length 95th (ft) 17 6 Control Delay (s) Lane LOS D E Approach Delay (s) Approach LOS D Average Delay 1. Intersection Capacity Utilization Err% ICU Level of Service H Analysis Period (min) 15 Page 28
293 HCM Unsignalized Intersection Capacity Analysis Future Background AM 46: Optima Drive 1/6/216 Movement EBL EBT WBT WBR SBL SBR Lane Configurations Traffic Volume (veh/h) Future Volume (Veh/h) Sign Control Free Free Stop Grade % % % Peak Hour Factor Hourly flow rate (vph) Pedestrians Lane Width (ft) Walking Speed (ft/s) Percent Blockage Right turn flare (veh) Median type None None Median storage veh) Upstream signal (ft) px, platoon unblocked vc, conflicting volume vc1, stage 1 conf vol vc2, stage 2 conf vol vcu, unblocked vol tc, single (s) tc, 2 stage (s) tf (s) p queue free % cm capacity (veh/h) Direction, Lane # EB 1 WB 1 SB 1 Volume Total Volume Left Volume Right csh Volume to Capacity... Queue Length 95th (ft) Control Delay (s)... Lane LOS A Approach Delay (s)... Approach LOS A Average Delay. Intersection Capacity Utilization.% ICU Level of Service A Analysis Period (min) 15 Page 29
294 Queues AM Existing 1: Biscayne Boulevard & NE 213th Street 1/5/216 Lane Group WBL WBR NBT NBR SBL SBT Lane Group Flow (vph) v/c Ratio Control Delay Queue Delay Total Delay Queue Length 5th (ft) Queue Length 95th (ft) Internal Link Dist (ft) Turn Bay Length (ft) Base Capacity (vph) Starvation Cap Reductn Spillback Cap Reductn Storage Cap Reductn Reduced v/c Ratio Page 1
295 HCM Signalized Intersection Capacity Analysis AM Existing 1: Biscayne Boulevard & NE 213th Street 1/5/216 Movement WBL WBR NBT NBR SBL SBT Lane Configurations Traffic Volume (vph) Future Volume (vph) Ideal Flow (vphpl) Total Lost time (s) Lane Util. Factor Frt Flt Protected Satd. Flow (prot) Flt Permitted Satd. Flow (perm) Peak-hour factor, PHF Adj. Flow (vph) RTOR Reduction (vph) Lane Group Flow (vph) Turn Type Prot Perm NA Perm Prot NA Protected Phases Permitted Phases 8 2 Actuated Green, G (s) Effective Green, g (s) Actuated g/c Ratio Clearance Time (s) Vehicle Extension (s) Lane Grp Cap (vph) v/s Ratio Prot c.7.27 c.23 c.44 v/s Ratio Perm.2.5 v/c Ratio Uniform Delay, d Progression Factor Incremental Delay, d Delay (s) Level of Service E E C B E A Approach Delay (s) Approach LOS E C B HCM 2 Control Delay 24.7 HCM 2 Level of Service C HCM 2 Volume to Capacity ratio.64 Actuated Cycle Length (s) 16. Sum of lost time (s) 13.5 Intersection Capacity Utilization 62.2% ICU Level of Service B Analysis Period (min) 15 c Critical Lane Group Page 2
296 Queues AM Existing 2: US 1 & SE 9th Street 1/5/216 Lane Group EBT WBL WBT WBR NBL NBT NBR SBL SBT Lane Group Flow (vph) v/c Ratio Control Delay Queue Delay Total Delay Queue Length 5th (ft) Queue Length 95th (ft) Internal Link Dist (ft) Turn Bay Length (ft) Base Capacity (vph) Starvation Cap Reductn Spillback Cap Reductn Storage Cap Reductn Reduced v/c Ratio Page 3
297 HCM Signalized Intersection Capacity Analysis AM Existing 2: US 1 & SE 9th Street 1/5/216 Movement EBL EBT EBR WBL WBT WBR NBL NBT NBR SBL SBT SBR Lane Configurations Traffic Volume (vph) Future Volume (vph) Ideal Flow (vphpl) Total Lost time (s) Lane Util. Factor Frt Flt Protected Satd. Flow (prot) Flt Permitted Satd. Flow (perm) Peak-hour factor, PHF Adj. Flow (vph) RTOR Reduction (vph) Lane Group Flow (vph) Turn Type Split NA Split NA Prot Prot NA Perm Prot NA Protected Phases Permitted Phases 2 Actuated Green, G (s) Effective Green, g (s) Actuated g/c Ratio Clearance Time (s) Vehicle Extension (s) Lane Grp Cap (vph) v/s Ratio Prot c.3.1 c.1. c.3 c.29.1 c.51 v/s Ratio Perm.1 v/c Ratio Uniform Delay, d Progression Factor Incremental Delay, d Delay (s) Level of Service E E E E F A A E B Approach Delay (s) Approach LOS E E B B HCM 2 Control Delay 16.7 HCM 2 Level of Service B HCM 2 Volume to Capacity ratio.71 Actuated Cycle Length (s) Sum of lost time (s) 27. Intersection Capacity Utilization 7.9% ICU Level of Service C Analysis Period (min) 15 c Critical Lane Group Page 4
298 Queues AM Existing 3: US 1 & 3 rd Street 1/5/216 Lane Group EBL EBT WBL WBT WBR NBL NBT NBR SBL SBT Lane Group Flow (vph) v/c Ratio Control Delay Queue Delay Total Delay Queue Length 5th (ft) 138 ~ Queue Length 95th (ft) 21 # m35 m65 Internal Link Dist (ft) Turn Bay Length (ft) Base Capacity (vph) Starvation Cap Reductn Spillback Cap Reductn Storage Cap Reductn Reduced v/c Ratio ~ Volume exceeds capacity, queue is theoretically infinite. Queue shown is maximum after two cycles. # 95th percentile volume exceeds capacity, queue may be longer. Queue shown is maximum after two cycles. m Volume for 95th percentile queue is metered by upstream signal. Page 5
299 HCM Signalized Intersection Capacity Analysis AM Existing 3: US 1 & 3 rd Street 1/5/216 Movement EBL EBT EBR WBL WBT WBR NBL NBT NBR SBL SBT SBR Lane Configurations Traffic Volume (vph) Future Volume (vph) Ideal Flow (vphpl) Total Lost time (s) Lane Util. Factor Frt Flt Protected Satd. Flow (prot) Flt Permitted Satd. Flow (perm) Peak-hour factor, PHF Adj. Flow (vph) RTOR Reduction (vph) Lane Group Flow (vph) Turn Type Split NA Split NA Prot Prot NA Perm Prot NA Protected Phases Permitted Phases 2 Actuated Green, G (s) Effective Green, g (s) Actuated g/c Ratio Clearance Time (s) Vehicle Extension (s) Lane Grp Cap (vph) v/s Ratio Prot.9 c.29 c.1.. c.4 c.36.1 c.38 v/s Ratio Perm.1 v/c Ratio Uniform Delay, d Progression Factor Incremental Delay, d Delay (s) Level of Service D F E E E F C B E D Approach Delay (s) Approach LOS F E C D HCM 2 Control Delay 58.1 HCM 2 Level of Service E HCM 2 Volume to Capacity ratio.87 Actuated Cycle Length (s) 16. Sum of lost time (s) 26. Intersection Capacity Utilization 85.4% ICU Level of Service E Analysis Period (min) 15 c Critical Lane Group Page 6
300 Queues AM Existing 4: Dixie Highway & 3rd Street 1/5/216 Lane Group EBT WBT SBL SBT Lane Group Flow (vph) v/c Ratio Control Delay Queue Delay Total Delay Queue Length 5th (ft) Queue Length 95th (ft) # Internal Link Dist (ft) Turn Bay Length (ft) Base Capacity (vph) Starvation Cap Reductn 48 Spillback Cap Reductn Storage Cap Reductn Reduced v/c Ratio # 95th percentile volume exceeds capacity, queue may be longer. Queue shown is maximum after two cycles. Page 7
301 HCM Signalized Intersection Capacity Analysis AM Existing 4: Dixie Highway & 3rd Street 1/5/216 Movement EBL EBT EBR WBL WBT WBR NBL NBT NBR SBL SBT SBR Lane Configurations Traffic Volume (vph) Future Volume (vph) Ideal Flow (vphpl) Total Lost time (s) Lane Util. Factor Frt Flt Protected Satd. Flow (prot) Flt Permitted Satd. Flow (perm) Peak-hour factor, PHF Adj. Flow (vph) RTOR Reduction (vph) 1 2 Lane Group Flow (vph) Turn Type NA Prot NA Split NA Protected Phases Permitted Phases Actuated Green, G (s) Effective Green, g (s) Actuated g/c Ratio Clearance Time (s) 4.5 Vehicle Extension (s) 3. Lane Grp Cap (vph) v/s Ratio Prot c.16 c.6 c v/s Ratio Perm.3 v/c Ratio Uniform Delay, d Progression Factor Incremental Delay, d Delay (s) Level of Service D A F D Approach Delay (s) Approach LOS D A A F HCM 2 Control Delay 68.8 HCM 2 Level of Service E HCM 2 Volume to Capacity ratio.58 Actuated Cycle Length (s) 13. Sum of lost time (s) 19.5 Intersection Capacity Utilization 58.4% ICU Level of Service B Analysis Period (min) 15 c Critical Lane Group Page 8
302 Queues AM Existing 5: 1st Avenue & 3rd Street 1/5/216 Lane Group EBT WBT WBR NBT Lane Group Flow (vph) v/c Ratio Control Delay Queue Delay Total Delay Queue Length 5th (ft) Queue Length 95th (ft) m# Internal Link Dist (ft) Turn Bay Length (ft) Base Capacity (vph) Starvation Cap Reductn 124 Spillback Cap Reductn 78 Storage Cap Reductn Reduced v/c Ratio # 95th percentile volume exceeds capacity, queue may be longer. Queue shown is maximum after two cycles. m Volume for 95th percentile queue is metered by upstream signal. Page 9
303 HCM Signalized Intersection Capacity Analysis AM Existing 5: 1st Avenue & 3rd Street 1/5/216 Movement EBL EBT EBR WBL WBT WBR NBL NBT NBR SBL SBT SBR Lane Configurations Traffic Volume (vph) Future Volume (vph) Ideal Flow (vphpl) Total Lost time (s) Lane Util. Factor Frt Flt Protected Satd. Flow (prot) Flt Permitted Satd. Flow (perm) Peak-hour factor, PHF Adj. Flow (vph) RTOR Reduction (vph) 61 1 Lane Group Flow (vph) Turn Type Prot NA NA Perm Split NA Protected Phases Permitted Phases 7 Actuated Green, G (s) Effective Green, g (s) Actuated g/c Ratio Clearance Time (s) Vehicle Extension (s) Lane Grp Cap (vph) v/s Ratio Prot c.24.5 c.9 v/s Ratio Perm c.13.1 v/c Ratio Uniform Delay, d Progression Factor Incremental Delay, d Delay (s) Level of Service A D D D Approach Delay (s) Approach LOS A D D A HCM 2 Control Delay 21.1 HCM 2 Level of Service C HCM 2 Volume to Capacity ratio.55 Actuated Cycle Length (s) 13. Sum of lost time (s) 19.5 Intersection Capacity Utilization 6.3% ICU Level of Service B Analysis Period (min) 15 c Critical Lane Group Page 1
304 Queues AM Existing 6: US 1 & Hallandale Beach Boulevard 1/5/216 Lane Group EBL EBT WBL WBT NBL NBT NBR SBL SBT Lane Group Flow (vph) v/c Ratio Control Delay Queue Delay Total Delay Queue Length 5th (ft) ~ Queue Length 95th (ft) # # # Internal Link Dist (ft) Turn Bay Length (ft) Base Capacity (vph) Starvation Cap Reductn Spillback Cap Reductn Storage Cap Reductn Reduced v/c Ratio ~ Volume exceeds capacity, queue is theoretically infinite. Queue shown is maximum after two cycles. # 95th percentile volume exceeds capacity, queue may be longer. Queue shown is maximum after two cycles. Page 11
305 HCM Signalized Intersection Capacity Analysis AM Existing 6: US 1 & Hallandale Beach Boulevard 1/5/216 Movement EBL EBT EBR WBL WBT WBR NBL NBT NBR SBL SBT SBR Lane Configurations Traffic Volume (vph) Future Volume (vph) Ideal Flow (vphpl) Total Lost time (s) Lane Util. Factor Frt Flt Protected Satd. Flow (prot) Flt Permitted Satd. Flow (perm) Peak-hour factor, PHF Adj. Flow (vph) RTOR Reduction (vph) Lane Group Flow (vph) Turn Type Prot NA Prot NA Prot NA pm+ov Prot NA Protected Phases Permitted Phases 2 Actuated Green, G (s) Effective Green, g (s) Actuated g/c Ratio Clearance Time (s) Vehicle Extension (s) Lane Grp Cap (vph) v/s Ratio Prot c.18 c c.14 c.18 v/s Ratio Perm.13 v/c Ratio Uniform Delay, d Progression Factor Incremental Delay, d Delay (s) Level of Service F E F D F C B F D Approach Delay (s) Approach LOS E F D E HCM 2 Control Delay 7.5 HCM 2 Level of Service E HCM 2 Volume to Capacity ratio.87 Actuated Cycle Length (s) 16. Sum of lost time (s) 28. Intersection Capacity Utilization 83.% ICU Level of Service E Analysis Period (min) 15 c Critical Lane Group Page 12
306 Queues AM Existing 7: Hallandale Beach Boulevard & Dixie Highway 1/5/216 Lane Group EBT WBL WBT SBT Lane Group Flow (vph) v/c Ratio Control Delay Queue Delay Total Delay Queue Length 5th (ft) Queue Length 95th (ft) 361 m#24 m Internal Link Dist (ft) Turn Bay Length (ft) Base Capacity (vph) Starvation Cap Reductn Spillback Cap Reductn 142 Storage Cap Reductn Reduced v/c Ratio # 95th percentile volume exceeds capacity, queue may be longer. Queue shown is maximum after two cycles. m Volume for 95th percentile queue is metered by upstream signal. Page 13
307 HCM Signalized Intersection Capacity Analysis AM Existing 7: Hallandale Beach Boulevard & Dixie Highway 1/5/216 Movement EBL EBT EBR WBL WBT WBR NBL NBT NBR SBL SBT SBR Lane Configurations Traffic Volume (vph) Future Volume (vph) Ideal Flow (vphpl) Total Lost time (s) Lane Util. Factor Frt Flt Protected Satd. Flow (prot) Flt Permitted Satd. Flow (perm) Peak-hour factor, PHF Adj. Flow (vph) RTOR Reduction (vph) 2 5 Lane Group Flow (vph) Turn Type NA Prot NA Perm NA Protected Phases Permitted Phases 4 Actuated Green, G (s) Effective Green, g (s) Actuated g/c Ratio Clearance Time (s) Vehicle Extension (s) Lane Grp Cap (vph) v/s Ratio Prot c.27 c.6.29 v/s Ratio Perm.14 v/c Ratio Uniform Delay, d Progression Factor Incremental Delay, d Delay (s) Level of Service C F A E Approach Delay (s) Approach LOS C B A E HCM 2 Control Delay 27.6 HCM 2 Level of Service C HCM 2 Volume to Capacity ratio.56 Actuated Cycle Length (s) 149. Sum of lost time (s) 22.5 Intersection Capacity Utilization 81.7% ICU Level of Service D Analysis Period (min) 15 c Critical Lane Group Page 14
308 Queues AM Existing 8: 1st Avenue & Hallandale Beach Boulevard 1/5/216 Lane Group EBL EBT WBT NBL NBT NBR Lane Group Flow (vph) v/c Ratio Control Delay Queue Delay Total Delay Queue Length 5th (ft) ~ Queue Length 95th (ft) m #359 #24 15 Internal Link Dist (ft) Turn Bay Length (ft) Base Capacity (vph) Starvation Cap Reductn Spillback Cap Reductn Storage Cap Reductn Reduced v/c Ratio ~ Volume exceeds capacity, queue is theoretically infinite. Queue shown is maximum after two cycles. # 95th percentile volume exceeds capacity, queue may be longer. Queue shown is maximum after two cycles. m Volume for 95th percentile queue is metered by upstream signal. Page 15
309 HCM Signalized Intersection Capacity Analysis AM Existing 8: 1st Avenue & Hallandale Beach Boulevard 1/5/216 Movement EBL EBT EBR WBL WBT WBR NBL NBT NBR SBL SBT SBR Lane Configurations Traffic Volume (vph) Future Volume (vph) Ideal Flow (vphpl) Total Lost time (s) Lane Util. Factor Frt Flt Protected Satd. Flow (prot) Flt Permitted Satd. Flow (perm) Peak-hour factor, PHF Adj. Flow (vph) RTOR Reduction (vph) 1 64 Lane Group Flow (vph) Turn Type Prot NA NA Perm NA Perm Protected Phases Permitted Phases 1 1 Actuated Green, G (s) Effective Green, g (s) Actuated g/c Ratio Clearance Time (s) Vehicle Extension (s) Lane Grp Cap (vph) v/s Ratio Prot.2 c.3 c.28.8 v/s Ratio Perm c.11.1 v/c Ratio Uniform Delay, d Progression Factor Incremental Delay, d Delay (s) Level of Service C A C F E E Approach Delay (s) Approach LOS A C F A HCM 2 Control Delay 23.2 HCM 2 Level of Service C HCM 2 Volume to Capacity ratio.59 Actuated Cycle Length (s) 149. Sum of lost time (s) 22.5 Intersection Capacity Utilization 81.7% ICU Level of Service D Analysis Period (min) 15 c Critical Lane Group Page 16
310 Queues AM Existing 9: Hallandale Beach Boulevard & E 8th Avenue 1/5/216 Lane Group EBT EBR WBL WBT NBT SBL SBR Lane Group Flow (vph) v/c Ratio Control Delay Queue Delay Total Delay Queue Length 5th (ft) Queue Length 95th (ft) 373 m m Internal Link Dist (ft) Turn Bay Length (ft) Base Capacity (vph) Starvation Cap Reductn 76 8 Spillback Cap Reductn Storage Cap Reductn Reduced v/c Ratio m Volume for 95th percentile queue is metered by upstream signal. Page 17
311 HCM Signalized Intersection Capacity Analysis AM Existing 9: Hallandale Beach Boulevard & E 8th Avenue 1/5/216 Movement EBL EBT EBR WBL WBT WBR NBL NBT NBR SBL SBT SBR Lane Configurations Traffic Volume (vph) Future Volume (vph) Ideal Flow (vphpl) Total Lost time (s) Lane Util. Factor Frt Flt Protected Satd. Flow (prot) Flt Permitted Satd. Flow (perm) Peak-hour factor, PHF Adj. Flow (vph) RTOR Reduction (vph) Lane Group Flow (vph) Turn Type NA Perm pm+pt NA Split NA Split Perm Protected Phases Permitted Phases Actuated Green, G (s) Effective Green, g (s) Actuated g/c Ratio Clearance Time (s) Vehicle Extension (s) Lane Grp Cap (vph) v/s Ratio Prot c.35.1 c.29 c. c.1 v/s Ratio Perm v/c Ratio Uniform Delay, d Progression Factor Incremental Delay, d Delay (s) Level of Service D C D B E C C Approach Delay (s) Approach LOS D B E C HCM 2 Control Delay 28.8 HCM 2 Level of Service C HCM 2 Volume to Capacity ratio.53 Actuated Cycle Length (s) 16. Sum of lost time (s) 17. Intersection Capacity Utilization 54.3% ICU Level of Service A Analysis Period (min) 15 c Critical Lane Group Page 18
312 Queues AM Existing 1: Hallandale Beach Boulevard & E 1th Avenue 1/5/216 Lane Group EBL EBT EBR WBL WBT WBR NBL NBT NBR Lane Group Flow (vph) v/c Ratio Control Delay Queue Delay Total Delay Queue Length 5th (ft) Queue Length 95th (ft) m m Internal Link Dist (ft) Turn Bay Length (ft) Base Capacity (vph) Starvation Cap Reductn 166 Spillback Cap Reductn Storage Cap Reductn Reduced v/c Ratio m Volume for 95th percentile queue is metered by upstream signal. Page 19
313 HCM Signalized Intersection Capacity Analysis AM Existing 1: Hallandale Beach Boulevard & E 1th Avenue 1/5/216 Movement EBL EBT EBR WBL WBT WBR NBL NBT NBR SBL SBT SBR Lane Configurations Traffic Volume (vph) Future Volume (vph) Ideal Flow (vphpl) Total Lost time (s) Lane Util. Factor Frt Flt Protected Satd. Flow (prot) Flt Permitted Satd. Flow (perm) Peak-hour factor, PHF Adj. Flow (vph) RTOR Reduction (vph) Lane Group Flow (vph) Turn Type Prot NA Perm Prot NA Perm Prot NA Perm Protected Phases Permitted Phases Actuated Green, G (s) Effective Green, g (s) Actuated g/c Ratio Clearance Time (s) Vehicle Extension (s) Lane Grp Cap (vph) v/s Ratio Prot c.5 c v/s Ratio Perm.2.2 c.3 v/c Ratio Uniform Delay, d Progression Factor Incremental Delay, d Delay (s) Level of Service F A A E C C C C C Approach Delay (s) Approach LOS B C C A HCM 2 Control Delay 23.1 HCM 2 Level of Service C HCM 2 Volume to Capacity ratio.46 Actuated Cycle Length (s) 16. Sum of lost time (s) 13.5 Intersection Capacity Utilization 51.2% ICU Level of Service A Analysis Period (min) 15 c Critical Lane Group Page 2
314 Queues AM Existing 11: Dixie Highway & County Line Road 1/5/216 Lane Group EBT WBT NBL NBR SBL SBT SBR Lane Group Flow (vph) v/c Ratio Control Delay Queue Delay Total Delay Queue Length 5th (ft) Queue Length 95th (ft) Internal Link Dist (ft) Turn Bay Length (ft) Base Capacity (vph) Starvation Cap Reductn Spillback Cap Reductn 14 1 Storage Cap Reductn Reduced v/c Ratio Page 21
315 HCM Signalized Intersection Capacity Analysis AM Existing 11: Dixie Highway & County Line Road 1/5/216 Movement EBL EBT EBR WBL WBT WBR NBL NBT NBR SBL SBT SBR Lane Configurations Traffic Volume (vph) Future Volume (vph) Ideal Flow (vphpl) Total Lost time (s) Lane Util. Factor Frt Flt Protected Satd. Flow (prot) Flt Permitted Satd. Flow (perm) Peak-hour factor, PHF Adj. Flow (vph) RTOR Reduction (vph) Lane Group Flow (vph) Turn Type NA Split NA D.Pm Prot custom NA Perm Protected Phases Permitted Phases Actuated Green, G (s) Effective Green, g (s) Actuated g/c Ratio Clearance Time (s) Vehicle Extension (s) Lane Grp Cap (vph) v/s Ratio Prot c.12 c.16.6 c.7.12 v/s Ratio Perm v/c Ratio Uniform Delay, d Progression Factor Incremental Delay, d Delay (s) Level of Service D B C C C B B Approach Delay (s) Approach LOS D B C C HCM 2 Control Delay 27.3 HCM 2 Level of Service C HCM 2 Volume to Capacity ratio.65 Actuated Cycle Length (s) 96.2 Sum of lost time (s) 18. Intersection Capacity Utilization 64.2% ICU Level of Service C Analysis Period (min) 15 c Critical Lane Group Page 22
316 Queues AM Existing 12: County Line Road & 1st Avenue 1/5/216 Lane Group EBL EBR NBL NBT SBT SBR Lane Group Flow (vph) v/c Ratio Control Delay Queue Delay Total Delay Queue Length 5th (ft) Queue Length 95th (ft) Internal Link Dist (ft) Turn Bay Length (ft) Base Capacity (vph) Starvation Cap Reductn Spillback Cap Reductn 1 48 Storage Cap Reductn Reduced v/c Ratio Page 23
317 HCM Signalized Intersection Capacity Analysis AM Existing 12: County Line Road & 1st Avenue 1/5/216 Movement EBL EBR NBL NBT SBT SBR Lane Configurations Traffic Volume (vph) Future Volume (vph) Ideal Flow (vphpl) Total Lost time (s) Lane Util. Factor Frt Flt Protected Satd. Flow (prot) Flt Permitted Satd. Flow (perm) Peak-hour factor, PHF Adj. Flow (vph) RTOR Reduction (vph) Lane Group Flow (vph) Turn Type Prot Prot Perm NA NA Prot Protected Phases Permitted Phases 8 Actuated Green, G (s) Effective Green, g (s) Actuated g/c Ratio Clearance Time (s) Vehicle Extension (s) Lane Grp Cap (vph) v/s Ratio Prot.22 c v/s Ratio Perm c.11 v/c Ratio Uniform Delay, d Progression Factor Incremental Delay, d Delay (s) Level of Service A C C C C C Approach Delay (s) Approach LOS C C C HCM 2 Control Delay 25.3 HCM 2 Level of Service C HCM 2 Volume to Capacity ratio.55 Actuated Cycle Length (s) 96.2 Sum of lost time (s) 18. Intersection Capacity Utilization 58.6% ICU Level of Service B Analysis Period (min) 15 c Critical Lane Group Page 24
318 HCM Unsignalized Intersection Capacity Analysis AM Existing 13: E 1st Avenue & NE 214th Terr 1/5/216 Movement WBL WBR NBT NBR SBL SBT Lane Configurations Traffic Volume (veh/h) Future Volume (Veh/h) Sign Control Stop Free Free Grade % % % Peak Hour Factor Hourly flow rate (vph) Pedestrians Lane Width (ft) Walking Speed (ft/s) Percent Blockage Right turn flare (veh) Median type None None Median storage veh) Upstream signal (ft) 144 px, platoon unblocked vc, conflicting volume vc1, stage 1 conf vol vc2, stage 2 conf vol vcu, unblocked vol tc, single (s) tc, 2 stage (s) tf (s) p queue free % cm capacity (veh/h) Direction, Lane # WB 1 NB 1 SB 1 Volume Total Volume Left Volume Right csh Volume to Capacity... Queue Length 95th (ft) Control Delay (s)... Lane LOS A Approach Delay (s)... Approach LOS A Average Delay. Intersection Capacity Utilization.% ICU Level of Service A Analysis Period (min) 15 Page 25
319 HCM Unsignalized Intersection Capacity Analysis AM Existing 14: SE 3rd Ave & SE 1th Ct 1/5/216 Movement EBL EBT EBR WBL WBT WBR NBL NBT NBR SBL SBT SBR Lane Configurations Traffic Volume (veh/h) Future Volume (Veh/h) Sign Control Free Free Stop Stop Grade % % % % Peak Hour Factor Hourly flow rate (vph) Pedestrians Lane Width (ft) Walking Speed (ft/s) Percent Blockage Right turn flare (veh) Median type None None Median storage veh) Upstream signal (ft) px, platoon unblocked vc, conflicting volume vc1, stage 1 conf vol vc2, stage 2 conf vol vcu, unblocked vol tc, single (s) tc, 2 stage (s) tf (s) p queue free % cm capacity (veh/h) Direction, Lane # EB 1 WB 1 NB 1 SB 1 Volume Total Volume Left 1 24 Volume Right 1 1 csh Volume to Capacity....3 Queue Length 95th (ft) 2 Control Delay (s) Lane LOS A A A Approach Delay (s) Approach LOS A A Average Delay 3.7 Intersection Capacity Utilization 13.3% ICU Level of Service A Analysis Period (min) 15 Page 26
320 HCM Unsignalized Intersection Capacity Analysis AM Existing 37: NE 214th Terr & SE 3rd Ave 1/5/216 Movement EBL EBT WBT WBR SBL SBR Lane Configurations Traffic Volume (veh/h) Future Volume (Veh/h) Sign Control Free Free Stop Grade % % % Peak Hour Factor Hourly flow rate (vph) Pedestrians Lane Width (ft) Walking Speed (ft/s) Percent Blockage Right turn flare (veh) Median type None None Median storage veh) Upstream signal (ft) px, platoon unblocked vc, conflicting volume vc1, stage 1 conf vol vc2, stage 2 conf vol vcu, unblocked vol tc, single (s) tc, 2 stage (s) tf (s) p queue free % cm capacity (veh/h) Direction, Lane # EB 1 WB 1 SB 1 Volume Total Volume Left 41 Volume Right 2 1 csh Volume to Capacity.3.. Queue Length 95th (ft) 2 Control Delay (s) Lane LOS A A Approach Delay (s) Approach LOS A Average Delay 5.2 Intersection Capacity Utilization 19.3% ICU Level of Service A Analysis Period (min) 15 Page 27
321 HCM Unsignalized Intersection Capacity Analysis AM Existing 41: Optima Office Drive 1/5/216 Movement EBL EBR NBL NBT SBT SBR Lane Configurations Traffic Volume (veh/h) Future Volume (Veh/h) Sign Control Stop Free Free Grade % % % Peak Hour Factor Hourly flow rate (vph) Pedestrians Lane Width (ft) Walking Speed (ft/s) Percent Blockage Right turn flare (veh) Median type None None Median storage veh) Upstream signal (ft) px, platoon unblocked vc, conflicting volume vc1, stage 1 conf vol vc2, stage 2 conf vol vcu, unblocked vol tc, single (s) tc, 2 stage (s) tf (s) p queue free % cm capacity (veh/h) Direction, Lane # EB 1 NB 1 NB 2 NB 3 NB 4 SB 1 SB 2 SB 3 Volume Total Volume Left Volume Right 5 42 csh Volume to Capacity Queue Length 95th (ft) 1 Control Delay (s) Lane LOS B Approach Delay (s) 1... Approach LOS B Average Delay. Intersection Capacity Utilization 59.1% ICU Level of Service B Analysis Period (min) 15 Page 28
322 HCM Unsignalized Intersection Capacity Analysis AM Existing 46: Optima Drive 1/5/216 Movement EBL EBT WBT WBR SBL SBR Lane Configurations Traffic Volume (veh/h) Future Volume (Veh/h) Sign Control Free Free Stop Grade % % % Peak Hour Factor Hourly flow rate (vph) Pedestrians Lane Width (ft) Walking Speed (ft/s) Percent Blockage Right turn flare (veh) Median type None None Median storage veh) Upstream signal (ft) px, platoon unblocked vc, conflicting volume vc1, stage 1 conf vol vc2, stage 2 conf vol vcu, unblocked vol tc, single (s) tc, 2 stage (s) tf (s) p queue free % cm capacity (veh/h) Direction, Lane # EB 1 WB 1 SB 1 Volume Total Volume Left Volume Right csh Volume to Capacity... Queue Length 95th (ft) Control Delay (s)... Lane LOS A Approach Delay (s)... Approach LOS A Average Delay. Intersection Capacity Utilization.% ICU Level of Service A Analysis Period (min) 15 Page 29
323 Traffic Impact Analysis APPENDIX I: COMMITTED DEVELOPMENT DATA k:\wpb_tpto\141\14193 optima plaza north\tia\ tia resubmittal\ optima plaza north tia.doc
324
325


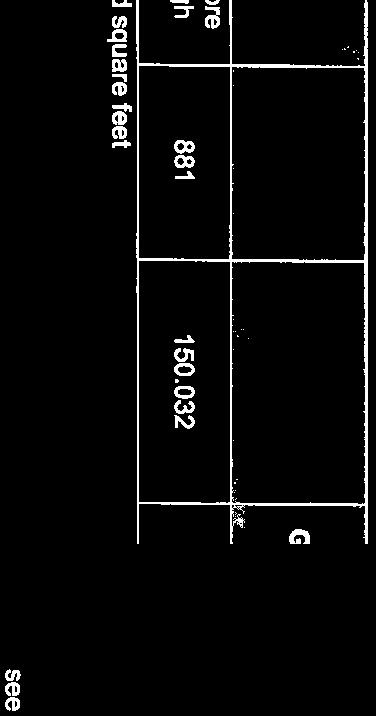

326


327
328 Traffic Impact Analysis Pass-By Capture Volumes Pass-by capture volumes were calculated for site using rates outlined in the ITE s Trip Generation Handbook, 2 nd Edition. The average pass-by capture rate of 43 percent (43%) was used for the restaurant. The applied pass-by percentage is presented in Table 1. Net New Project Trips Table 1 summarizes the project s trip generation potential for the daily weekday, weekday A.M. (7: to 9: A.M.), and P.M. (4: to 6: P.M.) peak hours. As shown in Table 1, this project is expected to generate 2,522 new daily trips, 191 new trips during the A.M. peak hour, and 215 new trips during the P.M. peak hour. Appendix C. Detailed trip generation information is included in Table 1: Trip Generation Proposed Land Use High-Rise Apartment ITE Code 222 Hotel 31 High- Turnover (Sit-Down) Restaurant 932 Scale 391 dwelling units 117 rooms 3,7 square feet TOTAL - - External Trips Internal Capture Pass-By Capture New Project Trips Enter Exit Total Percent 84 (28) [82] 314 (35) [34] 188 (18) [18] 1,342 (81) [134] IC Trips Daily(A.M. Peak Hour)[P.M. Peak Hour] 84 (86) [51] 314 (23) [32] 188 (14) [1] 1,342 (124) [93] 1,68 (114) [133] 628 (58) [66] 376 (32) [28] 2,684 (25) [227] 2.7% (3.4%) [2.9%] 7.% (6.5%) [5.7%] 2.% (2.%) [22.2%] 6.5% (7.3%) [6.6%] 46 (4) [4] 46 (4) [4] 94 (8) [8] 186 (16) [16] Percent.%.% 43.% - PB Trips () [] () [] 162 (14) [12] 162 (14) [12] Enter Exit Total (82) 314 (35) [34] 17 (11) [12] 1,261 (74) [128] (51) 314 (23) [32] 17 (7) [4] 1,261 (117) [87] 1,68 (114) [133] 628 (58) [66] 214 (18) [16] 2,522 (191) [215] K:\FTL_TPTO\ Gulfstream Point\Report\Gulfstream Point TIA.docx Page - 4 September 213
329 Traffic Impact Analysis Trip Distribution and Assignment Trip distribution for project traffic was determined based on the percentage of turning movement entering and exiting the study area at each study intersection approach. These calculations were performed for the weekday A.M. and P.M. peak hours. The calculated trip distribution was compared to the Florida Standard Urban Transportation Model Structure (FSUTMS). The FSUTMS South East Florida Regional Planning Model (SERPM) was used. Figures 2 and 3 present the project s net new traffic distribution for the A.M. peak hour and P.M. peak hour. Figure 4 presents the project s pass-by capture distribution for the A.M. and P.M. peak hours. Figures 5 and 6 present the project s traffic and pass-by assignment for the A.M. peak hour and P.M. peak hour. K:\FTL_TPTO\ Gulfstream Point\Report\Gulfstream Point TIA.docx Page - 5 September 213
330 N NOT TO SCALE Legend Study Roadway Study Intersection 2.% Entering Distribution (2.%) Exiting Distribution 1 'Int_1'! SE 3rd Street 48.% 1.% 7.% 2 'Int_2'! 56.% 5 'Int_5'! 3 'Int_3'! 3.% (2.%) (32.%) (2.%) (3.%) 6.% 1.% (1.%) (1.%) (3.%) (1.%) SE 5th Street S Federal Highway SE 1st Avenue SE 9th Street (3.%) (2.%) 59.% 1.% 34.% (2.%) (35.%) (1.%) North Driveway SITE South Driveway (1.%) 34.% (38.%) 34.% (38.%) 4 (3.%) (78.%) (19.%) 'Int_4'! SE 1th Street 213 Aventura Hospital Driveway (59.%) (19.%) 34.% (19.%) 34.% Figure 2 Project Trip Distribution A.M. Peak Hour Gulfstream Point Hallandale Beach, Florida
331 N NOT TO SCALE Legend Study Roadway Study Intersection 2.% Entering Distribution (2.%) Exiting Distribution 1 'Int_1'! SE 3rd Street 35.% 2.% 4.% 2 'Int_2'! 5 'Int_5'! 3 'Int_3'! (3.%) (4.%) 43.% 41.% 2.% 7.% 48.% (3.%) 2.% 1.% (2.%) (39.%) (2.%) (1.%) SE 1st Avenue SE 5th Street SE 9th Street (5.%) (2.%) S Federal Highway (42.%) (47.%) (2.%) (1.%) North Driveway SITE South Driveway (1.%) 48.% (5.%) 48.% (5.%) 4 (5.%) (69.%) (1.%) (25.%) 'Int_4'! SE 1th Street 213 Aventura Hospital Driveway (44.%) (25.%) 48.% (25.%) 48.% Figure 3 Project Trip Distribution P.M. Peak Hour Gulfstream Point Hallandale Beach, Florida
332 Traffic lmpacl AnalYSIS Net New External Trips The resulting net new external trips are presented in Table 2. The~ trips were then adjusted for the existing land use (57,579 sq. ft. of retail space) to account for traffic being produced by the existing land uses. Table 3 presents the external trips after the existing land use adjustments. Table 3 External Trip Adjustment Enemal Tri s In A.M. Peak. Hour Out Total Project External Vehicular Trips t9 7 t79 Existing Retail External Vehicular Trips 42 IS 6 Net New External Vehicular Trips I9 P.M. Peak Hour Project Ex.ternal Vehicular Trips Existing Retail External Vehicular Trips Net New External Vebicnlar Trips Trip Distribution and Assignment An infonnational Traffic Review and Impact Plann.ing System (TRIPS) model run was performed to determine the project trip distribution and assignment for the Hallandale Square project in accordance with City Code. This informational TRlPS model run was used as a basis for developing the trip distribution and assignment for the subject project. It should be noted that the TRIPS analysis does n.ot include locat roadways in lhe study area As a result, the model did not assign trips to the residential streets located arow1d the project site. Furthermore, the analysis does not take into account internalization or pass-by reductions. Therefore, only the cardinal distribution from the TRJPS analysis was utili zed. It was also noted that the TRIPS analysis does not accurately estimate the attraction of project trips to/from "Miami-Dade County as. However, the project site is adjacent to Miami-Dade County and to the City of Aventura (approximately.75 miles). Therefore, a significant percentage of project trips \\>;ll originate to/from Miami-Dade County. Therefore, the project trip assignment was adjusted to accow1t for the expected attraction jnto/from Miami-Dade County. The TRIPS analysis output for the current project is included in Appendix C. G:\ Hal1ar.dale'.Rrpr\.5\TlA.DOC Janu3ry 28
333 Traffic Impact Analys is As previously mentioned, the traffic impact analysis assumes interconnectivity to adjacent property to the south via the extension of SE 8 th Avenue and Hibiscus Str.~)et consistent v.rith the Citywide Masterplan. As a result, project traffic is expected to have access to both Federal Highway (via SE 3" Street) and Hallandale Beach Boulevard (via NE IO~ Avenue) to exit the site. This alternative routing is also expected to occur for project traffic entering the site. Thus, project traffic was distributed to both SE 3rd Street and NE 1 th Avenue. CODversely, a portion of the traffic generated by the Village at Gulfstream Park is expected to utilize the proposed public roadway coonections to both Federal Highway (via Hibiscus Street) and Hallandale Beach Boulevard (via SE gl1l Avenue) adjacent to the project site. For purposes of this analysis, ten percent (1%) of comm.it1ed development traffic volumes from the driveway connections (NE 1 th Avenue and SE 3'd Street) at the Vi1lage of Gu1fstream Park to major routes were diverted to the Hibiscus Street and SE gth Avenue connections to the area's major conidors. The appropriate diversion volumes from the eastbound right-turn., westbound left-tum., northbound left-tum, and northbound right-turn movements at NE 1 th Avenue and Hallandale Beach Boulevard were diverted to the intersection of SE 8 th Avenue and Hallandale Beach Boulevard. Similar adjustments were made at the Federal Highway intersections at SE 3 rd Street and Hibiscus Street. Figure 2 presents the project's distribution. Figures 3 and 4 present the project's assignment in the A.M. and P.M. peak hours. Volume development worksheets for the study intersections thai include these diversions and adjustments are included in Appendix D. G:\144151ooo 6 Hallacdale\Reports' Tl>\.DOC Pllgt.9 J.muary 28
334 t N NOT TO SCAlE..- -! --~>----IE 'b<i _.t J 'III'.. - '11.1 r. ~ ~ z.. ~! r, ~",. JII,,, CO JII, -r JII,,, 2!.%!.o.. "".:. ~"I' J In. $,."", -.. eo. J l co "1'.:. H! ~ "< ~ ~ _.n '" ~"I' -J ~ H ;;.!l-'!!.. ~ " ~ II, r, I'! ~ &,.. ". II2_Mo) n r, 'I', I\Iblscus.SIIIW. KinIey-Hom and Associates, tnc. Figure 2 Project Trip DiSlribution Haflandale Square City of Hallandale Beach, Florjda Page. 1
335 ITE Land Use #912 Drive-in Bank Weekday: T = (X) where T = number of trips and X = 1, square feet of gross floor area AM Peak: T = 12.8 (X) (57% in / 43% out) PM Peak: T = 24.3 (X) (5% in / 5% out) ITE Land Use #31 Hotel Weekday: T = 8.95 (X) where T = number of trips and X = number of rooms AM Peak: T =.53 (X) (59% in / 41% out) PM Peak: T =.6 (X) (51% in / 49% out) Table 1 below summarizes the vehicle trips associated with the proposed Hallandale Oasis project in the City of Hallandale Beach. (Internalization analyses in accordance with ITE procedures have also been included in this analysis. The details of the internalization are presented in Appendix B.) Table 1 Trip Generation Summary Hallandale Oasis - Hallandale Beach, Florida Daily AM Peak Hour Trips PM Peak Hour Trips Land Use Size Trips In Out Total In Out Total Existing Development Office 64,88 SF Fitness Center 6,25 SF Drive-in Bank 5, SF Total 1, Proposed Development Office 57,48 SF Retail 33,829 SF 1, Hotel 2 Rooms 1, Residential 5 DU 2, Sub-Total 5, Deductions Internalization (6%) Total 5, Difference (Proposed - Existing) 3, Source: KBP Consulting, Inc., June 215. Institute of Transportation Engineers (ITE) Trip Generation Manual (9th Edition). 6 Hallandale Oasis Traffic Statement

336 N 3% 8% 5% 6% STOP 4% 3% 55% Site 2% 7% KBP CONSULTING, INC. Trip Distribution FIGURE 2 Hallandale Oasis Hallandale Beach, Florida
Marina Loft (DRC 51-R-12)
") Marina Loft (DRC 51-R-12) traffic study prepared for: Cymbal Development OCtober 2012 Traf Tech October 1, 2012 Mr. Asi Cymbal - President Cymbal Development 3470 North Miami Avenue Upper Suite Miami,
Marina Loft (DRC 51-R-12) traffic study prepared for: Cymbal Development OCtober 2012 Traf Tech October 1, 2012 Mr. Asi Cymbal - President Cymbal Development 3470 North Miami Avenue Upper Suite Miami,
Walmart (Store # ) 60 th Street North and Marion Road Sioux Falls, South Dakota
 60 th Street North and Marion Road Sioux Falls, South Dakota") Walmart (Store #4865-00) 60 th Street North and Marion Road Sioux Falls, South Dakota Prepared for: Wal-Mart Stores, Inc. Bentonville, Arkansas Prepared by: Kimley-Horn and Associates, Inc. ã2013 Kimley-Horn
Walmart (Store #4865-00) 60 th Street North and Marion Road Sioux Falls, South Dakota Prepared for: Wal-Mart Stores, Inc. Bentonville, Arkansas Prepared by: Kimley-Horn and Associates, Inc. ã2013 Kimley-Horn
List of Exhibits...ii
 One Brickell Traffic Study TABLE OF CONTENTS List of Exhibits...ii EXECUTIVE SUMMARY...1 1. INTRODUCTION...2 1.1 Study Area...2 1.2 Study Objective...5 2. EXISTING TRAFFIC CONDITIONS...6 2.1 Data Collection...6
Transportation Impact Study for Abington Terrace
 Transportation Impact Study for Abington Terrace Abington Township, Montgomery County, PA Sandy A. Koza, P.E., PTOE PA PE License Number PE059911 Prepared by McMahon Associates, Inc. 425 Commerce Drive,
Traffic Impact Analysis Walton Acres at Riverwood Athletic Club Clayton, NC
 Traffic Impact Analysis Walton Acres at Riverwood Athletic Club Clayton, NC 1. TABLE OF CONTENTS INTRODUCTION...1 1.1. Site Location and Study Area...1 1.2. Proposed Land Use and Site Access...2 1.3.
6060 North Central Expressway Mixed-Use Site Dallas, Texas
 Volume 1 Traffic Impact Analysis 6060 North Central Expressway Mixed-Use Site Dallas, Texas April 30, 2018 Kimley-Horn and Associates, Inc. Dallas, Texas Project #063238300 Registered Firm F-928 Traffic
Traffic Impact Analysis Chatham County Grocery Chatham County, NC
 Chatham County Grocery Chatham County, NC TABLE OF CONTENTS 1. INTRODUCTION... 1 1.1. Location and Study Area... 1 1.2. Proposed Land Use and Access... 2 1.3. Adjacent Land Uses... 2 1.4. Existing ways...
REDEVELOPMENT TRAFFIC IMPACT STUDY
 REDEVELOPMENT TRAFFIC IMPACT STUDY For Wendy s Parker, Colorado January 215 Prepared for: Sterling Design Associates, LLC 29 W. Littleton Boulevard #3 Littleton, Colorado 812 Prepared by: 1233 Airport
EXECUTIVE SUMMARY. Page 1 of 6
 EXECUTIVE SUMMARY The purpose of this report is to identify conformance with the original traffic impact study for the proposed retail development on Lot 5 of Riverdale Retail Filing No. 1 located on the
Traffic Impact Statement
 Traffic Impact Statement Mixed Use Development, US 41 and Old Trail Drive aka Tide-Starbucks 4900 9 th Street North General Development Site Plan (GDSP) Collier County, FL 10/6/2015 Prepared for: Prepared
9 Leeming Drive Redevelopment Ottawa, ON Transportation Brief. Prepared By: Stantec Consulting Ltd.
 9 Leeming Drive Redevelopment Ottawa, ON Transportation Brief Prepared By: Stantec Consulting Ltd. TIA GUIDELINES CHECKLIST Report Context Municipal Address Comment: Section 1.1 Location relative to major
Traffic Impact Study WestBranch Residential Development Davidson, NC March 2016
 Traffic Impact Study WestBranch Residential Development Davidson, NC March 216 TRAFFIC IMPACT STUDY FOR THE WestBranch Residential Development LOCATED IN DAVIDSON, NC Prepared For: Lennar Carolinas, LLC
5858 N COLLEGE, LLC N College Avenue Traffic Impact Study
 5858 N COLLEGE, LLC nue Traffic Impact Study August 22, 2016 Contents Traffic Impact Study Page Preparer Qualifications... 1 Introduction... 2 Existing Roadway Conditions... 5 Existing Traffic Conditions...
James M. Moore, Director of Planning & Building Services, Town of Fairfax. Victory Village Senior Housing Development Traffic Study
 Traffic Study To: From: James M. Moore, Director of Planning & Building Services, Town of Fairfax David Parisi, PE, TE, Parisi Transportation Consulting Date: October 14, 216 Subject: Victory Village Senior
Place Vanier 250 Montreal Road Transportation Impact Study Addendum. Prepared for Broccolini Construction September 20 th, 2012
 Update for the May 31 st, 2012 Traffic Impact Study Prepared for Broccolini Construction 111-23596-00 September 20 th, 2012 2611 Queensview Drive, Suite 300, Ottawa, Ontario CANADA K2B 8K2 Telephone: 613-829-2800
FRONT RANGE CROSSINGS TRAFFIC IMPACT STUDY
 FRONT RANGE CROSSINGS TRAFFIC IMPACT STUDY Prepared for: City of Thornton And Colorado Department of Transportation Prepared by: 11 Blake Street, Suite 2 Denver, Colorado 822 Contact: Brian Bern, PE, PTOE
Henderson Avenue Mixed-Use Development
 Zoning Case: Z145-3 Traffic Impact Analysis Henderson Avenue Mixed-Use Development Dallas, TX October 26 th, 216 Kimley-Horn and Associates, Inc. Dallas, Texas Project #644827 Registered Firm F-928 Traffic
Traffic Impact Study. Crestline Piggly Wiggly Mountain Brook, Alabama. Goodwyn, Mills and Cawood, Inc. Birmingham, Alabama.
 Traffic Impact Study Crestline Piggly Wiggly Mountain Brook, Alabama Prepared for: Goodwyn, Mills and Cawood, Inc. Birmingham, Alabama September 214 Revision 1 October 214 Crestline Piggly Wiggly Mountain
Design Traffic Technical Memorandum
 State Road 7 Extension PD&E Study Design Traffic Technical Memorandum Palm Beach County, FL October 2010 State Road 7 Extension PD&E Study Design Traffic Technical Memorandum Palm Beach County, FL Prepared
The proposed development is located within 800m of an existing Transit Station where infill developments and intensification are encouraged.
 Stantec Consulting Ltd. 1331 Clyde Avenue, Suite 4 Ottawa ON K2C 3G4 Tel: (613) 722-442 Fax: (613) 722-2799 May 14, 213 File: 1638823 Robinson Park Development Corp. 5699 Power Road Ottawa, ON, K1G 3N4
IOTA CAROL COMPREHENSIVE PLAN AMENDMENT TRAFFIC ANALYSIS
 IOTA CAROL COMPREHENSIVE PLAN AMENDMENT TRAFFIC ANALYSIS December 28, 215 Revised January 29, 216 Revised February 23, 216 COMPREHENSIVE PLAN AMENDMENT TRAFFIC ANALYSIS Iota Carol PALM BEACH COUNTY, FL
TRANSPORTATION IMPACT STUDY
 Dundas MEP Developments Inc. City of Toronto 219 and 231 Dundas Street East, Proposed Mixed-Use Development TRANSPORTATION IMPACT STUDY 9782/2 April 216 LEA Consulting Ltd. Consulting Engineers & Planners
Appendices. Appendix J: Traffic Study
 Appendices Appendix J: Traffic Study The Platinum Triangle Subsequent EIR The Planning Center Appendices This page intentionally left blank. The Platinum Triangle Subsequent EIR The Planning Center TRAFFIC
Patuxent Green Golf Course
 Patuxent Green Golf Course Laurel, Maryland February 23, 2018 Traffic Impact Analysis Prepared for: ADC Builders Alan Cohen 2701 Tower Oaks Boulevard, Suite 200 Rockville, Maryland 20852 TABLE OF CONTENTS
TRAFFIC STUDY GUIDELINES Clarksville Street Department
 TRAFFIC STUDY GUIDELINES Clarksville Street Department 9/1/2009 Introduction Traffic studies are used to help the city determine potential impacts to the operation of the surrounding roadway network. Two
MEMORANDUM. Matt Folden, AICP, MNCPPC Rebecca Torma, MCDOT. Nancy Randall, AICP, PTP Barbara Mosier, P.E., PTOE Kevin Berger
 To: From: Matt Folden, AICP, MNCPPC Rebecca Torma, MCDOT Nancy Randall, AICP, PTP Barbara Mosier, P.E., PTOE Kevin Berger 1110 Bonifant Street Suite 210, Silver Spring, MD 20910 301-448-1333 WellsandAssociates.com
Traffic Impact Study. Roderick Place Columbia Pike Thompson s Station, TN. Transportation Group, LLC Traffic Engineering and Planning
 F i s c h b a c h Transportation Group, LLC Traffic Engineering and Planning Traffic Impact Study Roderick Place Columbia Pike Thompson s Station, TN Prepared March 2016 Ms. Gillian L. Fischbach, P.E.,
Harrah s Station Square Casino
 Transportation Analysis Harrah s Station Square Casino Pittsburgh, Pennsylvania Submitted To: City of Pittsburgh and Pennsylvania Gaming Control Board Prepared By: DKS Associates GAI Consultants December
FAIRFIELD - RYAN S CORNER TRAFFIC IMPACT ANALYSIS LOUDOUN COUNTY, VIRGINIA
 FAIRFIELD - RYAN S CORNER TRAFFIC IMPACT ANALYSIS LOUDOUN COUNTY, VIRGINIA Submitted on behalf of: Fairfield Residential Prepared by: Wells + Associates, Inc. 1420 Spring Hill Road, Suite 00 McLean, Virginia
THE LANDMARK AT TALBOT PARK
 TRAFFIC IMPACT STUDY FOR THE LANDMARK AT TALBOT PARK IN NORFOLK, VA INTERMODAL ENGINEERING, P.C. OCTOBER, 200 The Landmark at Talbot Park is a proposed redevelopment of the existing apartments along the
Student Housing Development
 Traffic Impact Study for the proposed Student Housing Development City of Oneonta Otsego County, New York Project No. 3259 December 212 Revised February 13, 212 Prepared For: Newman Development Group,
Volume 1 Traffic Impact Analysis. Texas Odyssey TIA Dallas, Texas. Kimley-Horn and Associates, Inc. Dallas, Texas. May 23, 2018
 Volume 1 Traffic Impact Analysis Texas Odyssey TIA Dallas, Texas May 23, 2018 Kimley-Horn and Associates, Inc. Dallas, Texas Project #064529800 Registered Firm F-928 Traffic Impact Analysis Texas Odyssey
Waterford Lakes Small Area Study
 Waterford Lakes Small Area Study Existing Traffic Conditions PREPARED FOR: ORANGE COUNTY PUBLIC WORKS DEPARTMENT TRAFFIC ENGINEERING DIVISION ORLANDO, FLORIDA PREPARED WITH: INWOOD CONSULTING ENGINEERS
Multnomah County Courthouse Relocation. Transportation Alternatives Analysis Technical Memorandum: FINAL
 Multnomah County Courthouse Relocation Portland, Oregon Transportation Alternatives Analysis Technical Memorandum: FIL Prepared for Multnomah County Facilities and Property Management Division 41 N Dixon
The current document is revised based on the comments received on:
 General Overview 1 Introduction Over the last several years, the Waterford Lakes area has experienced increased congestion due to a substantial increase in residential and commercial development. The current
THIS PAGE LEFT BLANK INTENTIONALLY
 GA SR 25 Spur at Canal Road Transportation Impact Analysis PREPARED FOR GLYNN COUNTY, GEORGIA 1725 Reynolds Street, Suite 300 Brunswick, Georgia 31520 PREPARED BY 217 Arrowhead Boulevard Suite 26 Jonesboro,
OFFICE/RETAIL DEVELOPMENT 1625 BANK STREET OTTAWA, ONTARIO TRANSPORTATION BRIEF. Prepared for: Canada Inc.
 OFFICE/RETAIL DEVELOPMENT 1625 BANK STREET OTTAWA, ONTARIO TRANSPORTATION BRIEF Prepared for: 9402209 Canada Inc. December 15, 2015 115-625 Report_2.doc D. J. Halpenny & Associates Ltd. Consulting Transportation
Waterford Lakes Small Area Study
 Over the last several years, the Waterford Lakes area has experienced increased congestion due to a substantial increase in residential and commercial development. The current Existing and Future Conditions
joint access drive. will be
 Date: To: From: Subject: June 22, 2015 Bradley Reiner, PE Bowman Consulting David R. Kline, PE, PTOE, Incline Associates Thornton Self-Storage Traffic Analysis (DRAFT) - Thornton, Colorado INTRODUCTION
Troutbeck Farm Development
 Troutbeck Farm Development Willistown Township, Chester County PA For Submission To: Willistown Township Last Revised: October, 4 TPD# INLM.A. 5 E. High Street Suite 65 Pottstown, PA 9464 6.36.3 TPD@TrafficPD.com
FINAL DESIGN TRAFFIC TECHNICAL MEMORANDUM
 FINAL DESIGN TRAFFIC TECHNICAL MEMORANDUM July 2014 FINAL (SR 43) Project Development and Environment Study From State Road 60 (Adamo Drive) to I-4 (SR 400) Hillsborough County, Florida Work Program Item
The preliminary study area was defined as the geographic area bounded by the following:
 QUESTION 21 TRANSPORTATION See State Comprehensive Plan (Chapter 187, F.S.) GOAL (11); POLICY (2) GOAL (12); POLICIES (3),(4) GOAL (16); POLICIES (1) GOAL (18); POLICIES (1),(3)(4),(6) GOAL (20); POLICIES
TRAFFIC IMPACT STUDY CRITERIA
 Chapter 6 - TRAFFIC IMPACT STUDY CRITERIA 6.1 GENERAL PROVISIONS 6.1.1. Purpose: The purpose of this document is to outline a standard format for preparing a traffic impact study in the City of Steamboat
Subject: Solberg Avenue / I-229 Grade Separation: Traffic Analysis
 MEMORANDUM Transportation Bill Troe, AICP Jason Carbee, AICP 12120 Shamrock Plaza Suite 300 Omaha, NE 68154 (402) 334-8181 (402) 334-1984 (Fax) To: Project File Date: Subject: Solberg Avenue / I-229 Grade
Traffic Impact Study Little Egypt Road Development Denver, North Carolina June 2017
 Traffic Impact Study Little Egypt Road Development Denver, North arolina June 2017 N. Little Egypt Road DQ\ QDQFLQJ VDOHV RU RWKHU SHUIRUPDQFH EDVHG FULWHULD Proposed Site Driveways Site Driveway 1 TRAFFI
INDUSTRIAL BUILDING 3009 HAWTHORNE ROAD CITY OF OTTAWA TRANSPORTATION OVERVIEW REVISED. Prepared for: Canada Inc.
 INDUSTRIAL BUILDING 3009 HAWTHORNE ROAD CITY OF OTTAWA TRANSPORTATION OVERVIEW REVISED Prepared for: 7849648 Canada Inc. Octiober 1, 2015 114-598 Overview_2.doc D. J. Halpenny & Associates Ltd. Consulting
Traffic Impact Analysis (TIA) Process and Procedures Manual. September 2017
 Process and Procedures Manual. September 2017") Traffic Impact Analysis (TIA) Process and Procedures Manual Post Office Box 664 101 Huntersville-Concord Road Huntersville, NC 28070 Phone 704-766-2220 Fax 704-992-5528 www.huntersville.org (c) 2017, Town
Traffic Impact Analysis (TIA) Process and Procedures Manual Post Office Box 664 101 Huntersville-Concord Road Huntersville, NC 28070 Phone 704-766-2220 Fax 704-992-5528 www.huntersville.org (c) 2017, Town
Transportation and General Civil Engineering Projects
 Continuing Engineering Services for Transportation and General Civil Engineering Projects Broward County, Florida Why Atkins 2 Existing and Past Clients 3 25+ years Experienced in Civil Engineering PM
Traffic Impact Study, Premier Gold Mines Limited, Hardrock Property
 Traffic Impact Study, Premier Gold Mines Limited, Hardrock Property Prepared for: Premier Gold Mines Limited Prepared by: Stantec Consulting Ltd. November 2014
Traffic Impact Study. Westlake Elementary School Westlake, Ohio. TMS Engineers, Inc. June 5, 2017
 TMS Engineers, Inc. Traffic Impact Study Westlake Elementary School Westlake, Ohio June 5, 2017 Prepared for: Westlake City Schools - Board of Education 27200 Hilliard Boulevard Westlake, OH 44145 TRAFFIC
PRELIMINARY DRAFT WADDLE ROAD / I-99 INTERCHANGE PROJECT ALTERNATIVE ANALYSIS FINAL TRAFFIC SUMMARY REPORT
 PRELIMINARY DRAFT WADDLE ROAD / I-99 INTERCHANGE PROJECT ALTERNATIVE ANALYSIS FINAL TRAFFIC SUMMARY REPORT Prepared by: In Association with: November 2013 EXECUTIVE SUMMARY Patton Township, in partnership
TRAFFIC OPERATIONS ANALYSIS REPORT. Pacheco Boulevard Alignment Study and Alternatives Analysis
 TRAFFIC OPERATIONS ANALYSIS REPORT Pacheco Boulevard Alignment Study and Alternatives Analysis PREPARED FOR: CITY OF MARTINEZ AND CONTRA COSTA COUNTY OCTOBER 2016 FINAL REPORT Prepared By: under contract
Shockoe Bottom Preliminary Traffic and Parking Analysis
 Shockoe Bottom Preliminary Traffic and Parking Analysis Richmond, Virginia August 14, 2013 Prepared For City of Richmond Department of Public Works Prepared By 1001 Boulders Pkwy Suite 300, Richmond, VA
Road Conversion Study Plumas Street
 Plumas Street Phase I Submitted to The Regional Transportation Commission of Washoe County Submitted by Zong Tian, Ph.D., P.E. Saeedeh Farivar Haiyuan Li, Ph.D. Center for Advanced Transportation Education
NO BUILD TRAFFIC OPERATIONS
 3. 23 NO BUILD TRAFFIC OPERATIONS This section addresses the operations of the transportation system and details how it would be expected to function under year 23 No Build conditions with the projected
Syracuse University University Place Road Closure
 Transportation Impact Study for the proposed Syracuse University University Place Road Closure City of Syracuse, Onondaga County, NY March 216 Project No. 3613 Prepared For: Syracuse University Office
OTTAWA TRAIN YARDS PHASE 3 DEVELOPMENT CITY OF OTTAWA TRANSPORTATION IMPACT STUDY. Prepared for:
 OTTAWA TRAIN YARDS PHASE 3 DEVELOPMENT CITY OF OTTAWA TRANSPORTATION IMPACT STUDY Prepared for: The Ottawa Train Yards Inc. 223 Colonnade Road South, Suite 212 Nepean, Ontario K2E 7K3 January 17, 2012
TRAFFIC IMPACT STUDY And A TRAFFIC SIGNAL WARRANT ANALYSIS FOR A SENIOR LIVING AND APARTMENT DEVELOPMENT
 TRAFFIC IMPACT STUDY And A TRAFFIC SIGNAL WARRANT ANALYSIS FOR A SENIOR LIVING AND APARTMENT DEVELOPMENT DEERFIELD TOWNSHIP, WARREN COUNTY, OHIO Nantucket Circle and Montgomery Road () Prepared for: ODLE
Bistro 6. City of Barrie. Traffic Impact Study for Pratt Hansen Group Inc. Type of Document: Final Report. Project Number: JDE 1748
 City of Barrie Traffic Impact Study for Pratt Hansen Group Inc. Type of Document: Final Report Project Number: JDE 1748 Date Submitted: June 12 th, 2017 06/12/17 John Northcote, P.Eng. Professional License
4. Include the associated years anticipated for the short term and long term analysis in the
 2nd DE Review SM ROCHA, LLC responses to City comments are provided within. 8. Trip distribution is displayed in Figure 6. Distribution assumes SFA and commercial traffic combined for most conservative
HUMC/Mountainside Hospital Redevelopment Plan
 Traffic and Parking Analysis HUMC/Mountainside Hospital Redevelopment Plan in Glen Ridge Borough and Montclair Township PREPARED FOR H2M 119 Cherry Hill Road, Suite 11 Parsippany, NJ 754 862.27.59 PREPARED
MEMO DRAFT VIA . Mr. Terry Bailey Foremost Development Company. To: Michael J. Labadie, PE Steven J. Russo, E.I.T. Fleis & VandenBrink.
 MEMO DRAFT VIA EMAIL To: From: Mr. Terry Bailey Foremost Development Company Michael J. Labadie, PE Steven J. Russo, E.I.T. Fleis & VandenBrink Date: August 29, 214 Re: Proposed Apartments City of Walled
LIBERTY TREE ACADEMY TRAFFIC IMPACT STUDY
 LIBERTY TREE ACADEMY TRAFFIC IMPACT STUDY Prepared for: Liberty Tree Academy Prepared by: 161 Blake Street, Suite 2 Denver, Colorado 822 Contact: David Kline, PE, PTOE (33)-572-2 On Behalf of: Liberty
List of Attachments. Location Map... Site Plan... City of Lake Elsinore Circulation Element... City of Lake Elsinore Roadway Cross-Sections...
 List of Attachments Exhibits Location Map... Site Plan... City of Lake Elsinore Circulation Element... City of Lake Elsinore Roadway Cross-Sections... Existing Lane Geometry and Traffic Controls... Existing
Highway 111 Corridor Study
 Highway 111 Corridor Study June, 2009 LINCOLN CO. HWY 111 CORRIDOR STUDY Draft Study Tea, South Dakota Prepared for City of Tea Sioux Falls Metropolitan Planning Organization Prepared by HDR Engineering,
TRAFFIC IMPACT STUDY
 675 Millcreek Drive, Unit 1 Mississauga, Ontario L5N 5M4 T: 416.213.7121 F: 95.89.8499 www.transtech.co TRAFFIC IMPACT STUDY PROPOSED MOSQUE DEVELOPMENT 4269 REGIONAL ROAD 25 TOWN OF OAKVILLE PREPARED
King Soopers #116 Thornton, Colorado
 Traffic Impact Study King Soopers #116 Thornton, Colorado Prepared for: Galloway & Company, Inc. 1.0 EXECUTIVE SUMMARY King Soopers #116, a grocery marketplace anchored commercial development, is proposed
TRAFFIC IMPACT STUDY
 TRAFFIC IMPACT STUDY for the GLEN ELLEN COUNTRY CLUB SENIOR RESIDENTIAL REDEVELOPMENT 84 Millis, Massachusetts Prepared by: McMahon Associates, Inc. Prepared for: Toll Brothers, Inc. August 216 DRAFT
TRAFFIC IMPACT STUDY. Creekside Thornton, Colorado. For. August 2015 November 2015 Revised: August Prepared for:
 TRAFFIC IMPACT STUDY For Creekside Thornton, Colorado August 215 November 215 Revised: August 216 Prepared for: Jansen Strawn Consulting Engineers 45 West 2 nd Avenue Denver, Colorado 8223 Prepared by:
MEDICAL/OFFICE BUILDING 1637 BANK STREET OTTAWA, ONTARIO TRANSPORTATION OVERVIEW. Prepared for:
 MEDICAL/OFFICE BUILDING 1637 BANK STREET OTTAWA, ONTARIO TRANSPORTATION OVERVIEW Prepared for: 2434984 Ontario Inc. 13-5510 Canotek Road Ottawa, Ontario K1J 9J5 June 4, 2015 115-613 Report_2.doc D. J.
TRANSPORTATION ANALYSIS REPORT US Route 6 Huron, Erie County, Ohio
 TRANSPORTATION ANALYSIS REPORT US Route 6 Huron, Erie County, Ohio December 12, 2012 Prepared for: The City of Huron 417 Main Huron, OH 44839 Providing Practical Experience Technical Excellence and Client
TRAFFIC IMPACT REPORT CASTLE PINES APARTMENTS CASTLE PINES, COLORADO
 TRAFFIC IMPACT REPORT CASTLE PINES APARTMENTS CASTLE PINES, COLORADO APRIL 12, 218 REV. JULY 16, 218 Prepared for: Davis Development 43 Corporate Center Dr Suite 21 Stockbridge, GA 3281 Prepared by: 112
TABLE OF CONTENTS TABLE OF CONTENTS... I APPENDICES... III LIST OF EXHIBITS... V LIST OF TABLES... VII LIST OF ABBREVIATED TERMS...
 TABLE OF CONTENTS TABLE OF CONTENTS... I APPENDICES... III LIST OF EXHIBITS... V LIST OF TABLES... VII LIST OF ABBREVIATED TERMS... IX 1 INTRODUCTION... 1 1.1 Project Overview... 1 1.2 Analysis Scenarios...
PINESTONE TRAFFIC IMPACT STUDY Travelers Rest, South Carolina
 PINESTONE TRAFFIC IMPACT STUDY Travelers Rest, South Carolina Prepared for Longbranch Development Prepared by January 13, 219 ii Table of Contents Subject Page Signature Page... i Table of Contents...
February 24, 2017 Project #: 20076
 February 24, 217 Project #: 276 Jinde Zhu Washington County Department of Land Use and Transportation 14 SW Walnut Street MS 17 Hillsboro, Oregon 97213 RE: Sunset Ridge Phase 2 Access Report and Zone Change
2136 And 2148 Trafalgar Road Townhouse Development Traffic Brief. Paradigm Transportation Solutions Limited
 2136 And 2148 Trafalgar Road Townhouse Development Traffic Brief Paradigm Transportation Solutions Limited March 217 March 217 Project: 1627 Diana Vlasic, M.C.I.P., R.P.P Metropolitan Consulting 445 Paletta
1609 E. FRANKLIN STREET HOTEL TRAFFIC IMPACT STUDY EXECUTIVE SUMMARY
 1609 E. FRANKLIN STREET HOTEL TRAFFIC IMPACT STUDY EXECUTIVE SUMMARY Prepared for: The Town of Chapel Hill Public Works Department Traffic Engineering Division Prepared by: HNTB North Carolina, PC 343
MEETING FACILITY 2901 GIBFORD DRIVE CITY OF OTTAWA TRANSPORTATION BRIEF. Prepared for: Holiday Inn Express 2881 Gibford Drive Ottawa, ON K1V 2L9
 MEETING FACILITY 2901 GIBFORD DRIVE CITY OF OTTAWA TRANSPORTATION BRIEF Prepared for: Holiday Inn Express 2881 Gibford Drive Ottawa, ON K1V 2L9 December 18, 2012 112-566 Brief_1.doc D. J. Halpenny & Associates
EAST AND SOUTH STREET CITY OF ANAHEIM, CALIFORNIA
 T R A F F I C I M P A C T A N A LY S I S EAST AND SOUTH STREET CITY OF ANAHEIM, CALIFORNIA April 217 T R A F F I C I M P A C T A N A LY S I S EAST AND SOUTH STREET CITY OF ANAHEIM, CALIFORNIA Submitted
TRAFFIC ASSESSMENT River Edge Colorado
 TRAFFIC ASSESSMENT River Edge Colorado Submitted by: Fehr & Peers 621 17th Street, Ste. 231 Denver, CO 8293 (33) 296-43 December, 21 App. M-2 Traffic Assessment River Edge Colorado December 21 TABLE OF
Fieldgate. Traffic Impact Study Proposed Retail Commercial and Residential Development Thompson Road and Louis St. Laurent Avenue Town of Milton
 Fieldgate Traffic Impact Study Proposed Retail Commercial and Residential Development Thompson Road and Louis St. Laurent Avenue Town of Milton September 214 September 23 214 Ms Debbie Pacchiarotti Our
TABLE TRAFFIC ANALYSIS SCENARIOS
 4.11 TRANSPORTATION The potential traffic impacts of the proposed project are evaluated in the Buena Park Beach/Orangethorpe Mixed Use Project Traffic Analysis (Traffic Analysis) by Austin-Foust Associates
3.2.2 Proposed Road Network within Phase 1B Lands
 3.2.2 Proposed Road Network within Phase 1B Lands Figure 3.1 also shows the proposed road network within the Premier Gateway Phase 1B Employment Area lands, which features two collector roads providing
TRAFFIC IMPACT STUDY COMPREHENSIVE UPDATE TOWN OF THOMPSON S STATION, TENNESSEE PREPARED FOR: THE TOWN OF THOMPSON S STATION
 TRAFFIC IMPACT STUDY COMPREHENSIVE UPDATE TOWN OF THOMPSON S STATION, TENNESSEE PREPARED FOR: THE TOWN OF THOMPSON S STATION Transportation Consultants, LLC 1101 17 TH AVENUE SOUTH NASHVILLE, TN 37212
CITY OF ALPHARETTA DOWNTOWN MASTER PLAN TRAFFIC EVALUATION
 CITY OF ALPHARETTA DOWNTOWN MASTER PLAN TRAFFIC EVALUATION June 2015 CITY OF ALPHARETTA DOWNTOWN MASTER PLAN TRAFFIC EVALUATION Introduction The Alpharetta Downtown Master Plan was developed in the fall
Los Coyotes Country Club Development Plan Traffic Impact Analysis
 Los Coyotes Country Club Development Plan Traffic Impact Analysis Prepared For: Phil Martin Associates 2073007450 Los Coyotes Country Club Development Plan Traffic Impact Analysis June 19, 2014 Prepared
Table of Figures. Table of Tables. Table 1: Traffic Volumes Ramblas Delay. Table 2: Las
 Table of Contents 1. Executive Summary... 4 2. Analysiss Methodology... 4 3. Introduction... 4 4. Roadway Geometric Conditions... 5 4.1 Las Ramblas Community Access/ Egress Roads... 7 5. Traffic Data Collection...
Traffic Circulation Study for Neighborhood Southwest of Mockingbird Lane and Airline Road, Highland Park, Texas
 ARIZONA TEXAS NEW MEXICO OKLAHOMA February 13, 2015 Mr. Meran Dadgostar P.E., R.S. Town of Highland Park 4700 Drexel Dr. Highland Park, Texas 75205 Re: Traffic Circulation Study for Neighborhood Southwest
7.0 Preferred Alternative with Service Road Concept
 .0 Preferred Alternative with Service Road Concept This section evaluates the traffic operations for all of the study years for the Build conditions as related to the Preferred Alternative with Service
Technical Memorandum TRAFFIC IMPACT STUDY. RIDLEY ROAD CONVENIENCE STORE Southampton County, VA. Prepared for: Mr. David Williams.
 Technical Memorandum TRFFIC IMPCT STUDY RIDLEY ROD CONVENIENCE STORE Southampton County, V Prepared for: Mr. David Williams By: Charles Smith, P.E., PTOE EPR Charlottesville, V July 2014 1 TBLE OF CONTENTS
Chapter 4 Traffic Analysis
 Chapter 4 Traffic Analysis PURPOSE The traffic analysis component of the K-68 Corridor Management Plan incorporates information on the existing transportation network, such as traffic volumes and intersection
Traffic Impact Study for Rolling Ridge Redevelopment
 Traffic Impact Study for Rolling Ridge Redevelopment Webster Groves, Missouri October 19, 2018 Prepared For: Gershman Commercial Real Estate 150 North Meramec Avenue Suite 500 St. Louis, Missouri 63105
Grant Avenue Streetscape
 REPORT TYPE GOES HERE Grant Avenue Streetscape PREPARED FOR City of Manassas 9027 Center Street Manassas, VA 20110 PREPARED BY 8300 Boone Boulevard Suite 700 Vienna, Virginia 22182 571.389.8121 July 31,
Benga Mining Limited Grassy Mountain Coal Project Appendix 8: Traffic Impact Assessment. Appendix 8 Traffic Impact Assessment
 Benga Mining Limited Grassy Mountain Coal Project Appendix 8: Traffic Impact Assessment Appendix 8 Traffic Impact Assessment August 216 Riverdale Resources Proposed Coal Mine near Blairmore AB Traffic
INDUSTRIAL BUILDING 1660 COMSTOCK ROAD CITY OF OTTAWA TRANSPORTATION OVERVIEW. Prepared for:
 INDUSTRIAL BUILDING 1660 COMSTOCK ROAD CITY OF OTTAWA TRANSPORTATION OVERVIEW Prepared for: Simluc Contractors Limited 2550 Blackwell Street, Ottawa K1B 5R1 October 18, 2013 113-584 Overview_1.doc D. J.
Table of Contents FIGURES TABLES APPENDICES. Traffic Impact Study Hudson Street Parking Garage MC Project No.: A Table of Contents
 Traffic Impact Study Hudson Street Parking Garage MC Project No.: 151714A Table of Contents Table of Contents I. INTRODUCTION... 2 II. EXISTING CONDITIONS... 5 III. 215 EXISTING TRAFFIC CONDITIONS... 6
Gateway Transportation Study
 Gateway Transportation Study Amherst, Massachusetts SUBMITTED TO University of Massachusetts Amherst Town of Amherst SUBMITTED BY Vanasse Hangen Brustlin, Inc. Watertown, Massachusetts March 213 Back of
COMMERCIAL DEVELOPMENT 2015 ROBERTSON ROAD OTTAWA, ONTARIO TRANSPORTATION BRIEF. Prepared for:
 COMMERCIAL DEVELOPMENT 2015 ROBERTSON ROAD OTTAWA, ONTARIO TRANSPORTATION BRIEF Prepared for: First Bay Properties Inc. 311 Richmond Road, Suite 203 Ottawa, ON K1Z 6X3 August 8, 2017 117-663 Brief_1.doc
ENKA INTERMEDIATE SCHOOL
 TRANSPORTATION IMPACT ANALYSIS Prepared for Buncombe County Schools ENKA INTERMEDIATE SCHOOL Asheville, NC Project Number: 13-71 8/1/13 www.davenportworld.com DAVENlORT Transportation Impact Analysis Enka
D.13 Transportation and Traffic
 This section addresses transportation and traffic issues and impacts related to the Proposed Project. Section D.13.1 provides a description of the affected environment for the Proposed Project. Applicable