Fieldgate. Traffic Impact Study Proposed Retail Commercial and Residential Development Thompson Road and Louis St. Laurent Avenue Town of Milton
|
|
|
- Hector Stewart
- 5 years ago
- Views:
Transcription


1 Fieldgate Traffic Impact Study Proposed Retail Commercial and Residential Development Thompson Road and Louis St. Laurent Avenue Town of Milton September 214
2 September Ms Debbie Pacchiarotti Our ref: Fieldgate 54 Yonge Street, 5 th Floor Toronto, ON M2N 5R5 Dear Sir, RE: Traffic Impact Study Proposed Retail Commercial and Residential Development Thompson Road and Louis St. Laurent Avenue, Milton, Ontario is pleased to submit the enclosed Traffic Impact Study assessing the traffic impacts of the proposed retail commercial and residential development located in the southeast corner of Thompson Road and Louis St. Laurent Avenue in the Town of Milton. The site plan of April 14, 214 identified as SP-132a Scheme 32 proposes a retail commercial total GFA of 8, sq.m. (94, sq.ft.) in eight buildings identified as A to H. It also proposes maximums of 325 apartment units and 65 townhouse units, with an option for some of the residential density to be comprised of retirement home beds. The study concludes that the main site access intersections on Thompson Road and Kennedy Circle, as well as the secondary access intersections on Kennedy Circle and Louis St. Laurent Avenue can be expected to have very good overall operational characteristics and provide adequate intersection capacity for the projected site traffic volumes at the 217 and 221 planning horizons (the latter coinciding with fullbuild-out of the Boyne Secondary Plan Area), without the need for any improvements. We trust the enclosed is sufficient for your needs, but please do not hesitate to contact the undersigned should you require any additional assistance. Sincerely, Inc. Wayne Kay, B.Sc. William Maria, P.Eng. Transportation Planner Transportation Engineer Inc. 675 Millcreek Drive Unit 1 Mississauga Ontario L5N 5M4 Canada T F E mississauga@ghd.com W
3 Executive summary The purpose of this report is to determine the proposed retail commercial and residential related traffic operational impacts at the Louis St. Laurent Avenue intersections at Thompson Road and Kennedy Circle (east leg) during the weekday am and pm peak hours under future 217 and 221 future traffic transportation network conditions. It also reports on the expected future operating characteristics of the retail commercial access and private residential driveways on the perimeter roads. Future Background Conditions The 217 planning horizon assumes full development of the site without the widening of the Louis St. Laurent Avenue and Thompson Road, planned to commence in 217. Some initial development will have occurred in the Boyne Secondary Plan Area as well as some background traffic growth on the arterial roads, and only the intersection of the Louis St. Laurent Avenue at Thompson Road is signalized. The 221 planning horizon assumes full build-out of both the site and the Boyne Secondary Plan Area. Traffic in the study area adopted the volumes in the Road Needs Assessment of October 213 for the Milton Phase 3 Landowners Group. The Louis St. Laurent Avenue intersections with Thompson Road and Kennedy Circle (east leg) would both be signalized with all roads built to their ultimate lane configurations. Retail Commercial Site Traffic The proposed retail commercial development is estimated to generate 74 new two-way vehicle trips during the weekday am peak hour and 361 new two-way vehicle trips during the weekday pm peak hour at the 217 planning horizon of this study. The net site trip generation in 217 includes a 5% transit mode split, increasing to 1% in 221 as expected by the Region of Halton. The proposed retail commercial development in 221 is estimated to generate 7 new two-way vehicle trips during the weekday am peak hour, and 341 new two-way vehicle trips during the weekday pm peak hour. The new retail commercial vehicular trips at the 221 planning horizon are expected to be balanced in all directions because the Boyne Secondary Plan Area is built-out, while in 217 only a minor proportion will be oriented south of Louis St. Laurent Avenue. The total site trips also included 39% pass-by trips during both weekday peak hours. While these trips do not add traffic to the perimeter roads, they do result in additional turning movements at the site access driveways. These turning movements were oriented comparable to the existing directional proportions during each study peak hour. The site shopping centre trips at the study intersections are only a minor increase during the weekday am peak hour and therefore the impact on the operations is nominal. While the shopping centre trips are more substantial during the weekday pm peak hour, the available capacity absorbs the commercial site traffic volume with minimal overall impact on the operating characteristics. In addition, the plaza driveways are all expected to have very good future operating conditions during the critical pm peak hour. Only the west driveway on Thompson Road will be subject to queuing, but this can be mitigated by providing separate left and right turn westbound exit lanes. Truck manoeuvres to access the proposed loading and garbage bays at the rear of Building A were modelled using AutoTurn. The design vehicle for the garbage bay was the Region of Halton front-end loader garbage truck, and the design vehicle for the loading bays was the TAC WB-2 transport truck. The respective design vehicles can be accommodated at the loading bays and garbage enclosures provided for all buildings. Report for Fieldgate - Traffic Impact Study Proposed Retail Commercial Development, /881153/ i
4 Residential Site Traffic The proposed residential development is not expected until after 217. Based on a maximum density of 325 apartment and 65 townhouse units, it is estimated to generate 179 new two-way vehicle trips during the weekday am peak hour and 215 new two-way vehicle trips during the weekday pm peak hour at the 221 planning horizon of this study. This includes an allowance for a future 1% transit mode split, as expected by the Region of Halton. The new site residential vehicular trips at the 221 planning horizon are assumed to be oriented comparable to other development within the Boyne Secondary Plan Area. This is 27% north, 33% south, 25% east and 15% west, and with a predominant 7% of the residential development traffic volume assigned to the west side Thompson Road driveway. Both the east and west side accesses are private roads, and there is no shared driveway use between the retail commercial and residential traffic in the overall development plan. Conclusions In conclusion, the Louis St. Laurent intersections at Thompson Road and Kennedy Circle (east leg) can be expected to have satisfactory operating characteristics with reserve capacity under both the future total 217 and 221 traffic conditions in all peak study hours. As a result, the ultimate road network plans are satisfactory with the expected provision of adequate storage in the left turn lanes. This includes a recommendation for dual exit left and right turn lanes at the plaza driveway on Thompson Road., Otherwise, only minor traffic signal timing phase modifications are indicated because of the subject site impact, with the timing details would best determined by the actual future traffic patterns. ii Report for Fieldgate - Traffic Impact Study Proposed Retail Commercial Development, /881153/
5 Table of contents 1. Introduction Retainer and objective Site characteristics Site environs Study area Site plan Truck manoeuvres Existing conditions Existing and planned road network Existing traffic Future background traffic Study horizon years Study area transportation network improvements Future background growth Future background developments Site generated traffic Retail commercial trip generation Retail commercial trip distribution and assignment Residential trip generation Residential trip distribution and assignment Future total traffic Future total traffic Intersection capacity analysis Table index Table 1 Retail Commercial Trip Generation Table 2 Residential Trip Generation Table 3 Capacity Analyses of Thompson Road at Louis St. Laurent Avenue Table 4 Capacity Analyses of Kennedy Circle at Louis St. Laurent Avenue Table 5 Capacity Analyses of Retail Commercial Driveway at Thompson Road Table 6 Capacity Analyses of Residential Driveway at Thompson Road Table 7 Capacity Analyses of Retail Commercial Driveway at Kennedy Circle Table 8 Capacity Analyses of Residential Driveway at Kennedy Circle Table 9 Capacity Analyses of Right In/Out Driveway at Louis St. Laurent Avenue Report for Fieldgate - Traffic Impact Study Proposed Retail Commercial Development, /881153/ iii
6 Figure index Figure 1 Site Location... 2 Figure 2 Site Plan... 4 Figure 3 Lane Configuration... 6 Figure 4 Existing 214 Traffic... 7 Figure 5 Background Traffic Figure 6 Background Traffic Figure 7 Estimated 217 Retail Commercial Traffic Figure 8 Estimated 221 Retail Commercial Traffic Figure 9 Estimated 221 Residential Traffic Figure 1 Future Total 217 Traffic Figure 11 Future Total 221 Traffic... 2 Appendices Appendix A Background Information Appendix B Capacity Analyses iv Report for Fieldgate - Traffic Impact Study Proposed Retail Commercial Development, /881153/
7 1. Introduction 1.1 Retainer and objective was retained to prepare a Traffic Impact Study (TIS) for the proposed retail commercial and residential development located in the southeast corner of Thompson Road and Louis St. Laurent Avenue in the Town of Milton. The key elements of this study are: Establish baseline traffic conditions for the study area and update the existing traffic conditions based on future development to derive the future background operating conditions for the study intersections at future 217 and 221 planning horizons. Establish the estimated weekday am and pm peak hour traffic generation and distribution of the retail commercial and residential development traffic to the adjacent road network, and determine the future impacts in the context of all local transportation modes. Review the site plan and access intersections in the context of operational / geometric issues, including trucks and provide recommendations on how to address any deficiencies (if any are revealed). Study background The site location shown in Figure 1 is within a developing area in south Milton (Boyne Secondary Plan Area) which is now beginning to build-out. The location on the east side of Thompson Road is opposite an existing retail commercial plaza on the north side anchored by Metro and Shoppers Drug Mart. Road network improvement in the vicinity of the site is ongoing and the planned improvements beginning in 217 imply that the retail commercial portion of the site could be built-out with the existing road characteristics. Study team The team involved in the preparation of this study are: William Maria, P. Eng., Transportation Engineer Wayne Kay, B.Sc., Transportation Planner Michael Dowdall, C.Tech., Transportation Analyst Report for Fieldgate - Traffic Impact Study Proposed Retail Commercial Development, /881153/ 1

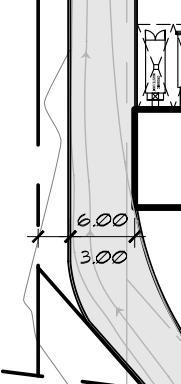
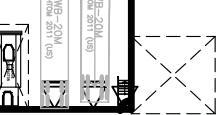
8 FERGUSON DRIVE KENNEDY CIRCLE FREEMAN TRAIL LOUIS ST. LAURENT AVENUE SITE THOMPSON ROAD SOUTH FOURTH LINE BRITANNIA ROAD WEST NOT TO SCALE Fieldgate Traffic Impact Study Commercial/Residential Development Site Location Job Number Revision Date Figure Millcreek Drive, Unit 1, Mississauga Ontario L5N 5M4 T F E info@ghdcanada.com W A Aug Plot Date: 13 August 214-1:42 PM Plotted by: Michael Dowdall Cad File No: X:\88\1153 Thompson\Analysis\Transportation\ Figures.dwg
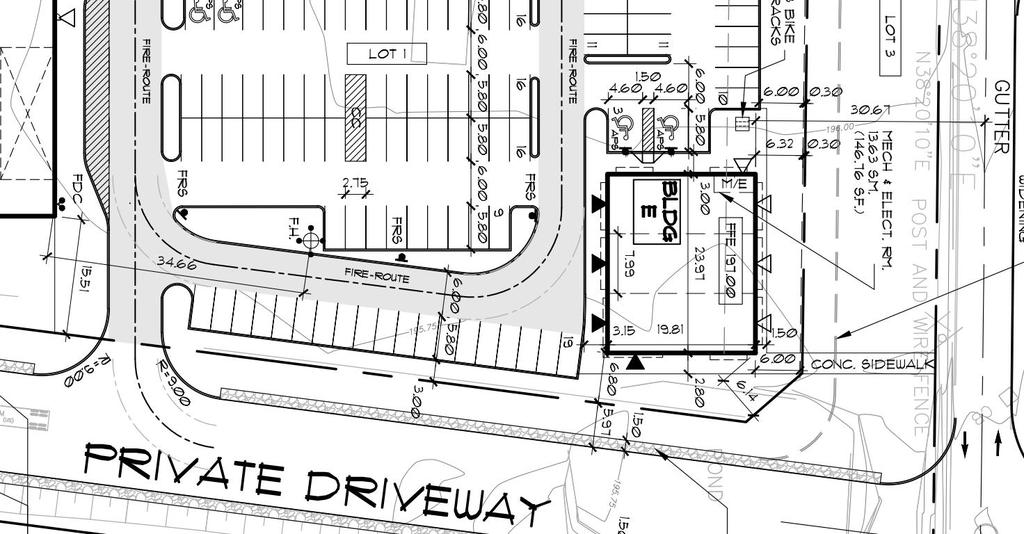
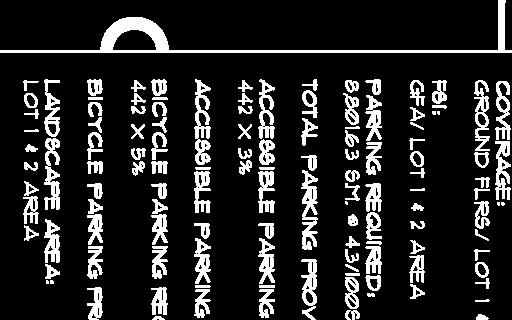
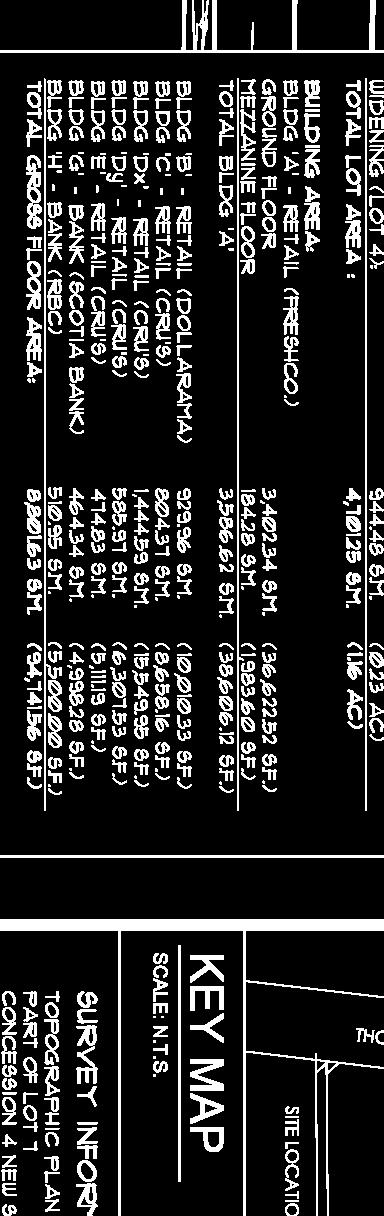
9 2. Site characteristics 2.1 Site environs The site is bounded by Thompson Road to the west, Kennedy Circle to the east, Louis St. Laurent Avenue to the north and future residential uses to the south. Both Louis St. Laurent Avenue and Kennedy Circle connect east-west across Thompson Road, however only the Louis St. Laurent Avenue intersection is currently signalized. The nearest Milton Transit service (Route #4 Thompson/Clark) is currently located at the intersection of Louis St. Laurent Avenue and Kennedy Circle, which is at the north east corner of the site. It provides frequent weekday service to/from the Milton GO Station. 2.2 Study area The study area includes the following existing intersections: Thompson Road at Louis St. Laurent Avenue (signalized) Kennedy Circle at Louis St. Laurent Avenue 2.3 Site plan The retail commercial portion of the site plan (SP-132a Scheme 32) proposes eight buildings (A, B, C, Dx, Dy, E, G and H) with a total GFA of 8, sq.m. (94, sq.ft.). There are full movement primary access driveways proposed on Thompson Road and Kennedy Circle, located approximately 1 metres south of the future centreline of Louis St. Laurent Avenue. A secondary right-in only driveway (primarily as a truck access) is proposed at the south property limit of the plaza on Kennedy Circle and a right-in/out driveway is proposed approximately mid-block on Louis St. Laurent Avenue, 15 metres east of Thompson Road. The plaza includes 446 surface parking spaces. Buildings G and H are banks with the drive-thru facilities providing queuing for 5 vehicles each (minimum of 3 vehicles is required). Building A is a food store with truck loading bays at the rear, Building C is a dollar store, and the other buildings are expected to have typical retail commercial units. The south end of the site is proposed to have maximums of 325 apartment and 65 townhouse units, with an option for some of the residential density to be comprised of retirement home beds. Access is provided by a private road connecting to both Thompson Road and Kennedy Circle. There is no internal road connection into the south side of the plaza. The proposed site plan (A-132a, Scheme 32) of April 14, 214 is shown in Figure Truck manoeuvres Truck manoeuvres to access the proposed loading and garbage bays at the rear of Building A were modelled using AutoTurn. The design vehicle for the garbage bay was the Region of Peel front-end loader garbage truck, and the design vehicle for the loading bays was the TAC WB-2 transport truck. The truck paths are appended and show that the respective design vehicles can be accommodated at the loading and garbage bays. Report for Fieldgate - Traffic Impact Study Proposed Retail Commercial Development, /881153/ 3


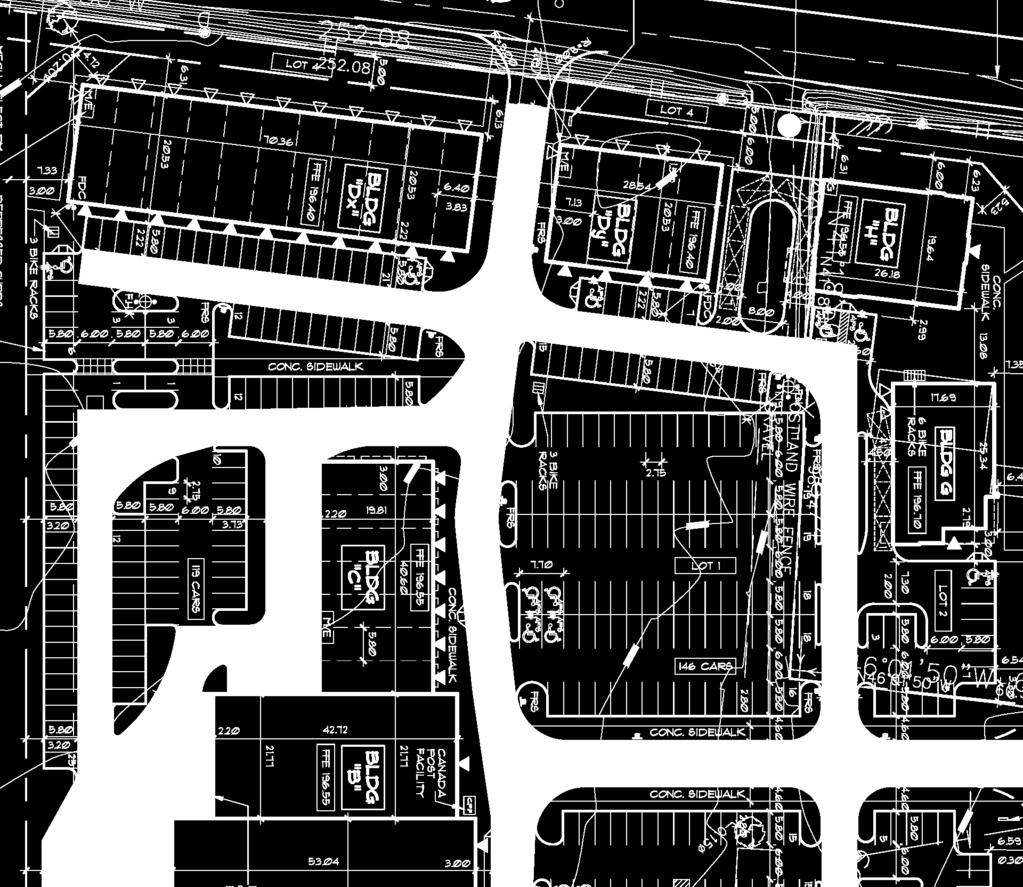


10 Plot Date: 21 August 214-9:17 AM Plotted by: Michael Dowdall Cad File No: NOT TO SCALE Residential East Driveway X:\88\1153 Thompson\Analysis\Transportation\ Figures.dwg Site plan provided by VGA Inc. dated August 16, 214 Residential West Driveway Site Plan Fieldgate Traffic Impact Study Commercial / Residential Development Aug 214 A Figure 2 Date Revision Job Number 675 Millcreek Drive, Unit 1, Mississauga Ontario L5N 5M4 T F E info@ghdcanada.com W Future Co llector Ro (K ad e n n e d y Circle Ex tension)
11 3. Existing conditions 3.1 Existing and planned road network Thompson Road is a major north-south arterial road under Town of Milton jurisdiction. North of Louis St. Laurent Avenue it has four travel lanes with a centre left turn lane and a posted speed limit of 6 km/h. It has two travel lanes south of Louis St. Laurent Avenue and the transition is accommodated by a northbound lane beginning at Louis St. Laurent Avenue and the two southbound lanes merging into a single lane immediately north of Louis St. Laurent Avenue. There are left lanes on the northsouth approaches to Louis St. Laurent Avenue. Thompson Road is planned to be widened from 2 to 4 lanes from Britannia Road to Louis St. Laurent Avenue beginning in 217. Louis St. Laurent Avenue Drive is an east-west major arterial road under Town of Milton jurisdiction. In the study area it has an existing two-lane cross section with a posted speed limit of 5 km/h. There are no auxiliary turning lanes on the signalized east-west approaches to Thompson Road. It will eventually become a divided road with four travel lanes and left turn lanes at Thompson Road and Kennedy Road upon development of the Boyne Secondary Plan Area. Louis St. Laurent Avenue is planned to be widened from 2 to 4 lanes east of Thompson Road beginning in 217. While a similar widening is proposed east of Thompson Road, the timing has not yet been determined. Kennedy Circle is a residential two-lane collector road under Town of Milton jurisdiction with a statutory 5 km/h speed limit. It has bicycle lanes with a left turn lane and stop control at Louis St. Laurent Avenue (235 metres east of Thompson Road). On-street parking is permitted. It provides a ring road north of Louis St. Laurent Avenue between the east and west side of Thompson Road, but in 217 the east leg is a private road on private lands ending in a temporary cul-de-sac at the southerly limit of the subject development. It will ultimately be constructed to municipal public road standard upon development of the surrounding residential lands of the Boyne Secondary Plan Area. The existing and future lane configurations at the study intersections, including the proposed site driveways is shown in Figure Existing traffic obtained weekday peak period traffic data for the intersection of Louis St. Laurent Avenue with Thompson Road and Kennedy Circle in early June 213, and for the intersection of Thompson Road at the commercial driveway in January 214. The traffic data is appended. It shows Thompson Road traffic oriented approximately 7% southbound and 3% northbound during the am peak hour, 3% southbound and 7% northbound during the pm peak hour. Louis St. Laurent Avenue traffic is oriented approximately 65% eastbound and 35% westbound during the am peak hour, 35% eastbound and 65% westbound during the pm peak hour. The weekday peak hours at the intersection of Thompson Road and Louis St. Laurent Avenue occurred from 7:3 to 8:3 am and from 4:45 to 5:45 pm. Figure 4 summarizes the adopted existing / baseline 214 traffic volumes during each of the weekday am and pm peak hours. Report for Fieldgate - Traffic Impact Study Proposed Retail Commercial Development, /881153/ 5
12 Thompson Road Kennedy Circle Louis St. Laurent Avenue Louis St. Laurent Avenue Right-In/Out Private Driveway West Side Plaza Driveway East Side Plaza Driveway Right-In Residential West Driveway Residential East Driveway Thompson Road Future Collector Road (Kennedy Circle Extension) Legend Stop Control Traffic Signal Additional Lane (221) NOT TO SCALE Fieldgate Traffic Impact Study Commercial / Residential Development 217 & 221 Horizon Year Job Number Revision Date Figure Millcreek Drive, Unit 1, Mississauga Ontario L5N 5M4 T F E info@ghdcanada.com W A Aug Plot Date: 21 August 214-9:21 AM Plotted by: Michael Dowdall Cad File No: X:\88\1153 Thompson\Analysis\Transportation\ Figures.dwg
13 Thompson Road Kennedy Circle Louis St. Laurent Avenue (62) (156) (6) (12) () (68) 168 (243) 22 (42) 28 (26) 263 (337) 245 (325) (85) 42 (21) 397 () (117) 254 (16) (21) 397 Louis St. Laurent Avenue (58) (388) (34) 449 (198) (48) 124 West Side Plaza Driveway Right-In/Out SUBJECT SITE East Side Plaza Driveway Right-In Private Driveway 449 (198) 124 Residential West Driveway Residential East Driveway (48) Thompson Road Future Collector Road (Kennedy Circle Extension) Legend XX AM Peak Hour Volumes (XX) PM Peak Hour Volumes Signalized Intersection Proposed Roadway NOT TO SCALE Fieldgate Traffic Impact Study Commercial / Residential Development Existing 214 Traffic Job Number Revision Date Figure Millcreek Drive, Unit 1, Mississauga Ontario L5N 5M4 T F E info@ghdcanada.com W A Aug Plot Date: 21 August 214-9:21 AM Plotted by: Michael Dowdall Cad File No: X:\88\1153 Thompson\Analysis\Transportation\ Figures.dwg
14 4. Future background traffic 4.1 Study horizon years The Town of Milton typically requires future background and total traffic analyses at a ten-year planning horizon, but this study uses 7 years to coincide with build-out of the Boyne Secondary Plan Area in 221. Furthermore, since the site could build-out prior to the planned adjacent arterial road improvements beginning in 217, our analyses also adopted future background conditions on the basis of the traffic growth sources and road network conditions expected in 217 (before road improvements are effective) in addition to the 221 (at build-out of the Boyne Secondary Plan Area) horizon year. 4.2 Study area transportation network improvements The Town of Milton is planning to widen Thompson Road south of Louis St. Laurent Avenue as well as Louis St. Laurent Avenue west of Thompson Road from 2 to 4 lanes with work beginning in 217. The section of Louis St. Laurent Avenue on the site north frontage is expected to remain two lanes at the initial horizon year of this study. 4.3 Future background growth The future background corridor growth rates adopted in the Milton Phase 3 Landowners Group, Boyne Secondary Plan Survey Area, Roads Network Assessment prepared by in October 213 were extracted from the Paradigm report of January 213. These growth rates were adopted for both the weekday am and pm peak hours in this study and applied to the existing through traffic as 2.45% per annum on Louis St. Laurent Avenue and 3.% per annum on Thompson Road to derive the future background 217 traffic conditions. In addition the 3.% per annum growth rate was applied to the left and right turn movements during both peak hours at the intersection of Louis St. Laurent Avenue and Thompson Road. 4.4 Future background developments Traffic growth in the study area for the 217 planning horizon will occur from some initial development in the Boyne Secondary Plan Area, expected to be primarily in the West Block (west of Sixteen Mile Creek). As a result, the traffic contribution would be east-west volume only on Louis St. Laurent Avenue, which was assumed to be 15% of the West Block east-west volume at Sixteen Mile Creek. The south leg of Kennedy Circle at Louis St. Laurent Avenue on the east side of Thompson Road, which includes future residential development immediately south of the subject site, has no confirmed timing and is assumed within an undeveloped area in 217. Traffic growth in the study area for the 221 planning horizon will occur from build-out of the Boyne Secondary Plan Area immediately to the south of the site. The above referenced Milton Phase 3 Landowners Group report was therefore adopted as the future background traffic conditions in 221. It included background traffic for the Boyne Secondary Plan Area from the Milton Education Village, the Fieldgate commercial development at Louis St. Laurent Avenue and Bronte Street, the Derry Green Corporate Business Park, and from the Sherwood Survey RNA report, the Milton Main Street Homes and Mattamy Manaman residential blocks. The future total 221 traffic conditions also 8 Report for Fieldgate - Traffic Impact Study Proposed Retail Commercial Development, /881153/
15 included the 2.45% and 3.% annual corridor growth rates on Louis St. Laurent Avenue and Thompson Road, respectively. Figures 5 and 6 summarize the background traffic volumes at the 217 and 221 planning horizons during each of the weekday am and pm peak hours. Report for Fieldgate - Traffic Impact Study Proposed Retail Commercial Development, /881153/ 9
16 Thompson Road Kennedy Circle Louis St. Laurent Avenue (7) (176) (68) (12) () 76 (77) 289 (366) 22 (42) 32 (29) 396 (472) 378 (46) (96) 47 (352) 52 () (261) 344 (18) (352) 52 Louis St. Laurent Avenue (66) (438) (38) 57 (224) (542) 14 West Side Plaza Driveway Right-In/Out SUBJECT SITE East Side Plaza Driveway Right-In Private Driveway 57 (224) 14 Residential West Driveway Residential East Driveway (542) Thompson Road Future Collector Road (Kennedy Circle Extension) Legend XX AM Peak Hour Volumes (XX) PM Peak Hour Volumes Signalized Intersection Proposed Roadway NOT TO SCALE Fieldgate Traffic Impact Study Commercial / Residential Development Background 217 Traffic Job Number Revision Date Figure Millcreek Drive, Unit 1, Mississauga Ontario L5N 5M4 T F E info@ghdcanada.com W A Aug Plot Date: 21 August 214-9:22 AM Plotted by: Michael Dowdall Cad File No: X:\88\1153 Thompson\Analysis\Transportation\ Figures.dwg
17 Thompson Road Kennedy Circle Louis St. Laurent Avenue (7) (176) (68) (12) () 76 (77) 289 (366) 22 (42) 32 (29) 396 (472) 378 (46) (96) 47 (352) 52 () (261) 344 (18) (352) 52 Louis St. Laurent Avenue (66) (438) (38) 57 (224) (542) 14 West Side Plaza Driveway Right-In/Out SUBJECT SITE East Side Plaza Driveway Right-In Private Driveway 57 (224) 14 Residential West Driveway Residential East Driveway (542) Thompson Road Future Collector Road (Kennedy Circle Extension) Legend XX AM Peak Hour Volumes (XX) PM Peak Hour Volumes Signalized Intersection Proposed Roadway NOT TO SCALE Fieldgate Traffic Impact Study Commercial / Residential Development Background 221 Traffic Job Number Revision Date Figure Millcreek Drive, Unit 1, Mississauga Ontario L5N 5M4 T F E info@ghdcanada.com W A Aug Plot Date: 21 August 214-9:22 AM Plotted by: Michael Dowdall Cad File No: X:\88\1153 Thompson\Analysis\Transportation\ Figures.dwg
18 5. Site generated traffic 5.1 Retail commercial trip generation The proposed retail commercial development has a total GFA of 8, sq.m. (94, sq.ft.). The traffic generated during the weekday am and pm peak hours was estimated by applying the trip rates for Land Use Code 82 Shopping Centre in Trip Generation, 8th Edition, published by the Institute of Transportation Engineers (ITE). The gross trip rates were calculated using the fitted curve regression equations while the trip ends adopted the average ITE proportions. The gross trips were adjusted by adopting the 5% transit mode split expected by the Region of Halton in 217 and the 1% transit mode split expected by the Region of Halton in 221. No allowance was included for other trip modes and therefore the site trip estimates in each horizon year should be slightly overstated. The remaining trips were divided into pass-by and primary trips. The rates for each were based on deriving the average pass-by rate for shopping centres with less than 4, sq.ft. from the ITE database (also indicating that pass-by rates generally increase as the shopping centre GFA decreases). The adopted pass-by rate was 39% during the pm peak hour. The weekday pm peak hour pass-by rate was also adopted for the much lower trip generation during the am peak hour because no ITE data is available (morning trips are expected to have a substantial pass-by characteristic). Table 1 summarizes the estimated trip generation of the 94,933 sq.ft. shopping centre. Table 1 Retail commercial trip generation Peak Hour Trip Generation Retail Commercial Weekday AM Weekday PM In Out Total In Out Total Trip Rate Trip Ratio 61% 39% - 49% 51% - Gross Trips % Transit Trips Net Auto Trips Pass-by Trips Primary (New) Trips % Transit Trips Net Auto Trips Pass-by Trips Primary (New) Trips Report for Fieldgate - Traffic Impact Study Proposed Retail Commercial Development, /881153/
19 The proposed retail commercial development in 217 is estimated to generate a total of 74 new vehicle trips during the am peak hour and 361 new vehicle trips during the pm peak hour. In 221, the retail commercial development is estimated to generate a total of 7 new vehicle trips during the am peak hour and 341 new vehicle trips during the pm peak hour. 5.2 Retail commercial trip distribution and assignment Distribution of the shopping centre primary (new) trips was based on the location within the built-out residential areas within approximately 2 kilometres of the site. The primary trips would therefore have different orientation proportions in each of the horizon years. In 217, the Boyne Secondary Plan Area, which is all south of Louis St. Laurent Avenue, generates substantially fewer trips than in 221 when it is expected built-out. The adopted site trip distributions in each horizon year are therefore: 217: 1% south, 3% north, 3% east and 3% west 221: 25% south, 25% north, 25% east and 25% west The north oriented trips assumed 1% north via Kennedy Circle in both horizon years, while the south oriented trips assumed 1% south via Kennedy Circle in 221. Distribution of the shopping centre pass-by trips was based on the existing weekday am and pm peak hour north-south orientations on Thompson Road and east-west orientations on Louis St. Laurent Avenue. These existing proportions were applied to the pass-by trips as follows: Weekday am peak hour: 4% southbound /1% northbound on Thompson Road and 35% eastbound / 15% westbound on Louis St. Laurent Weekday pm peak hour: 15% southbound / 4% northbound on Thompson Road and 2% eastbound / 25% westbound on Louis St. Laurent The primary (new) shopping centre trip assignments applied 95% to the east and west side driveways and 5% to the east rear driveway. All pass-by trips were applied to the primary driveways, with the eastbound primary and pass-by trips assigned to the right in/out driveway on Louis St. Laurent Avenue, as appropriate. Some of the retail commercial trips could be destined to the subject shopping centre as well as the existing shopping centre on the north side of Louis St. Laurent Avenue. These trips between the plazas were assumed balanced. The estimated retail commercial trip assignments for each of the 217 and 221 planning horizons during the weekday am and pm peak hours are shown in Figures 7 and 8, respectively. 5.1 Residential trip generation The proposed residential development is currently conceptual and can have a maximums of 325 apartment and 65 townhouse units. While some of this density can be applied as a retirement home, the trip generation of assisted living units is substantially less than typical residential units. As a result, the residential trips were estimated by applying the higher trip rates for Land Use Codes 22 Apartments and 23 Condominium Townhouses in Trip Generation, 8th Edition, published by the Institute of Transportation Engineers (ITE). It was assumed that the residential portion of the site would not begin developing until after 217. Report for Fieldgate - Traffic Impact Study Proposed Retail Commercial Development, /881153/ 13
20 The gross trip rates were calculated using the fitted curve regression equations while the trip ends adopted the average ITE proportions and were adjusted by adopting the 1% transit mode split expected by the Region of Halton in 221. No allowance was included for other trip modes and therefore the site trip estimates in each horizon year should be slightly overstated. Table 2 summarizes the estimated trip generation of the apartment and townhouse units. Table 2 Residential trip generation Peak Hour Trip Generation Residential Weekday AM Weekday PM In Out Total In Out Total Apartment Trip Rate Apartment Trip Ratio 2% 8% - 65% 35% - Apartment Gross Trips Townhouse Trip Rate Townhouse Trip Ratio 17% 83% - 67% 33% - Townhouse Gross Trips Total Residential Trips % Transit Trips Net Auto Residential Trips The proposed residential development in 221 is estimated to generate a total of 179 new vehicle trips during the am peak hour and 215 new vehicle trips during the pm peak hour. 5.1 Residential trip distribution and assignment Distribution of the site residential trips was based on that adopted in previous studies within the Boyne Secondary Plan Area. The residential trip distributions in 221 are 27% north, 33% south, 25% east and 15% west. Assignment to the private road intersections assumed 7% oriented to Thompson Road and 3% oriented to Kennedy Circle. The estimated residential trip assignments at the 221 planning horizon during the weekday am and pm peak hours is shown in Figure Report for Fieldgate - Traffic Impact Study Proposed Retail Commercial Development, /881153/
21 Thompson Road Kennedy Circle Louis St. Laurent Avenue () (45) (6) () () () () () (-28)-5-5 (52) (8) -5 (52) 21 () 14 () (-16) -12 () (36) 11 (58) 23 (39) 4 11 (16) 5 (6) Louis St. Laurent Avenue (84) (56) () (61) () () (17) Right-In/Out (-17) (159) (34) (1) -14 (185) 219 West Side East Side 16 (36) Plaza Plaza (17) 3 Driveway Driveway () (-45) (62) SUBJECT SITE Right-In (19) 21 Private Driveway () () 2 5 Residential West Driveway Residential East Driveway (17) Thompson Road Future Collector Road (Kennedy Circle Extension) Legend XX AM Peak Hour Volumes (XX) PM Peak Hour Volumes Signalized Intersection NOT TO SCALE Fieldgate Traffic Impact Study Commercial / Residential Development Estimated 217 Retail Commercial Traffic Volumes Job Number Revision Date Figure Millcreek Drive, Unit 1, Mississauga Ontario L5N 5M4 T F E info@ghdcanada.com W A Aug Plot Date: 21 August 214-9:22 AM Plotted by: Michael Dowdall Cad File No: X:\88\1153 Thompson\Analysis\Transportation\ Figures.dwg
22 Thompson Road Kennedy Circle Louis St. Laurent Avenue () (37) (4) () () () () () (-27)-5-5 (41) (68) -5 (41) 18 () () (-17) -11 () (29) 9 (5) 2 (31) 1 (12) 4 (4) Louis St. Laurent Avenue (72) (44) () (52) () () (13) Right-In/Out (-16) (133) (4) () -13 (154) 113 West Side East Side 18 (56) Plaza Plaza (17) 1 Driveway Driveway (4) (-38) (75) SUBJECT SITE Right-In (4) 26 Private Driveway 1 (8) (-4) 5 12 Residential West Driveway Residential East Driveway (37) Thompson Road ` Future Collector Road (Kennedy Circle Extension) Legend XX AM Peak Hour Volumes (XX) PM Peak Hour Volumes Signalized Intersection NOT TO SCALE Fieldgate Traffic Impact Study Commercial / Residnetial Development Estimated 221 Retail Commercial Traffic Volumes Job Number Revision Date Figure Millcreek Drive, Unit 1, Mississauga Ontario L5N 5M4 T F E info@ghdcanada.com W A Aug Plot Date: 21 August 214-9:22 AM Plotted by: Michael Dowdall Cad File No: X:\88\1153 Thompson\Analysis\Transportation\ Figures.dwg
23 Thompson Road Kennedy Circle Louis St. Laurent Avenue () (26) () () (12) () () () () () () () 9 (35) () () () () () () (21) 5 () Louis St. Laurent Avenue (47) () () (47) () () West Side East Side Plaza Plaza () Driveway Driveway () 49 (25) 34 (18) Residential Residential West East (25) 48 Driveway Driveway (7) 14 () 4 (32) (14) 12 () (47) () (11) (14) () () () (6) 49 (25) () (19) Right-In/Out SUBJECT SITE 11 Private Driveway 48 () (25) Right-In () (47) Thompson Road Future Collector Road (Kennedy Circle Extension) Legend XX AM Peak Hour Volumes (XX) PM Peak Hour Volumes Signalized Intersection NOT TO SCALE Fieldgate Traffic Impact Study Commercial / Residential Development Estimated 221 Residential Traffic Volumes Job Number Revision Date Figure Millcreek Drive, Unit 1, Mississauga Ontario L5N 5M4 T F E info@ghdcanada.com W A Aug Plot Date: 21 August 214-9:23 AM Plotted by: Michael Dowdall Cad File No: X:\88\1153 Thompson\Analysis\Transportation\ Figures.dwg
24 6. Future total traffic 6.1 Future total traffic The future total traffic conditions during the weekday am and pm peak study hours for the 217 and 221 planning horizons were derived by combining the projected future background traffic with the corresponding estimates of the site generated traffic. The 217 analyses assumed build-out of the retail commercial portion of the site without completion of the planned widening of Louis St. Laurent Avenue and Thompson Road on the site perimeters. The 221 analyses represent full build-out of both the site (retail commercial and residential) and the Boyne Secondary Plan Area and associated road network in the area. The shopping centre driveways and private residential driveways on each of Thompson Road and Kennedy Circle are independent and there is no shared commercial and residential use of the driveways. Figure 1 and 11 summarize the future total traffic volumes during each of the weekday am and pm peak hours at the 217 and 221 planning horizons, respectively 6.2 Intersection capacity analysis The capacity analysis identifies how well an intersection is operating. The analysis contained within this report utilized the Highway Capacity Manual (HCM) 2 techniques within the Synchro Version 8 Software package. The reported intersection volume-to-capacity ratios (v/c) are a measure of the saturation volume for each turning movement, while the levels-of-service (LOS) are a measure of the average delay for each turning movement. Queuing characteristics are reported as the predicted 95th percentile queue for each turning movement. The existing heavy vehicle proportions are included in the intersection analyses. In accordance with Region of Halton Terms of Reference for Traffic Impact Studies, the analysis includes identification of critical movements (bold highlighted in the following tables, if any). Deficiencies may require modifications and improvements at intersections where the addition of background growth or background growth plus site-generated traffic/transit volumes causes the following: Unsignalized: Level of service (LOS), based on average delay per vehicle, on individual movements exceed LOS E Unsignalized: The estimated 95 th percentile queue length for an individual movement exceeds the available queue storage Signalized: v/c ratios for overall intersection operations, through movements or shared through/turning movements increase to.85 or above Signalized: v/c ratios for exclusive movements increase to.95 or above Signalized: Queues for an individual movement are projected to exceed available turning lane storage The traffic signal timing plans at the intersection of Thompson Road and Louis St. Laurent Avenue were optimized for each of the traffic scenarios because of the significant growth traffic volume and the intersection lane improvements expected with the planned road widening beginning in Report for Fieldgate - Traffic Impact Study Proposed Retail Commercial Development, /881153/
25 Thompson Road Kennedy Circle Louis St. Laurent Avenue (7) (221) (74) (12) (6) () (77) 22 (42) 284 (338) 373 (512) 32 (19) 391 (524) 21 () (96) 47 (336) 49 () (297) 355 (58) 23 (391) (34) 57 (6) Louis St. Laurent Avenue (15) (494) (38) (61) () () (17) Right-In/Out (27) (159) (34) (1) 493 (185) (36) West Side East Side Plaza Plaza (17) 3 Driveway Driveway () (497) (62) SUBJECT SITE Right-In (243) 21 Private Driveway () () Residential West Driveway Residential East Driveway (559) Thompson Road Future Collector Road (Kennedy Circle Extension) Legend XX AM Peak Hour Volumes (XX) PM Peak Hour Volumes Signalized Intersection NOT TO SCALE Fieldgate Traffic Impact Study Commercial / Residential Development Future Total 217 Traffic Job Number Revision Date Figure Millcreek Drive, Unit 1, Mississauga Ontario L5N 5M4 T F E info@ghdcanada.com W A Aug Plot Date: 21 August 214-9:23 AM Plotted by: Michael Dowdall Cad File No: X:\88\1153 Thompson\Analysis\Transportation\ Figures.dwg
26 Thompson Road Kennedy Circle Louis St. Laurent Avenue (151) (651) (214) (14) (51) (29) (22) 22 (45) 984 (132) 1111 (1336) 63 (199) 1267 (1433) 64 (128) (138) 181 (1339) 1192 (2) 4 (165) 92 (5) 2 (1196) 1142 (224) (266) (82) (11) 113 (52) (175) (12) (27) (95) Louis St. Laurent Avenue (941) (133) (4) (35) (154) West Side East Side 18 (56) Plaza Plaza (17) 1 Driveway Driveway (4) (124) (75) Right-In/Out SUBJECT SITE Right-In Private Driveway (25) 34 (18) Residential Residential West East (25) 48 Driveway Driveway (7) 14 (174) (14) (8) (225) (28) (32) (95) (47) 847 (47) (37) Thompson Road Future Collector Road (Kennedy Circle Extension) Legend XX AM Peak Hour Volumes (XX) PM Peak Hour Volumes Signalized Intersection NOT TO SCALE Fieldgate Traffic Impact Study Commercial / Residential Development Future Total 221 Traffic Job Number Revision Date Figure Millcreek Drive, Unit 1, Mississauga Ontario L5N 5M4 T F E info@ghdcanada.com W A Aug Plot Date: 21 August 214-9:23 AM Plotted by: Michael Dowdall Cad File No: X:\88\1153 Thompson\Analysis\Transportation\ Figures.dwg
27 Thompson Road at Louis St. Laurent Avenue Capacity analyses under existing and both future (background and total) 217 and 221 traffic conditions during the weekday am and peak hours is summarized in Table 3 from detailed Synchro reports attached in the appendix. This intersection is currently signalized and the prevailing lane configuration has been adopted at the 217 planning horizon. Both Thompson Road and Louis St. Laurent Avenue were improved to their ultimate lane configurations under the future total 221 traffic conditions. Table 3 Capacity analyses of Thompson Road at Louis St. Laurent Avenue Traffic Condition Movement v/c (LOS) delay in seconds, 95 th Percentile Queue AM Peak Hour PM Peak Hour Existing 214 Future Background 217 Future Total 217 Future Background 221 Future Total 221 Overall:.32 v/c LOS B EBT:.37 (B) 19s, 55m WBT:.28 (B) 18s, 4m NBL:.2 (B) 15s, 1m NBT:.13 (B) 16s, 2m SBL:.16 (B) 17s, 2m SBT:.27 (B) 17s, 35m Overall:.4 v/c LOS B EBT:.49 (C) 21s, 75m WBT:.45 (B) 2s, 65m NBL:.3 (B) 15s, 1m NBT:.15 (B) 16s, 25m SBL:.19 (B) 17s, 25m SBT:.3 (B) 18s, 4m Overall:.41 v/c LOS B EBT:.51 (C) 21s, 8m WBT:.44 (B) 2s, 65m NBL:.6 (B) 16s, 1m NBT:.16 (B) 16s, 25m SBL:.19 (B) 17s, 25m SBT:.31 (B) 18s, 4m Overall:.85 v/c LOS D EBT:.66 (C) 29s, 125m WBT:.84 (D) 49s, 16m NBL:.91 (E) 73s, 7m NBT:.71 (D) 45s, 95m SBL:.71 (D) 46s, 5m SBT:.85 (D) 53s, 12m Overall:.88 v/c LOS D EBT:.67 (C) 29s, 125m WBT:.84 (D) 51s, 18m NBL:.92 (E) 71s, 8m NBT:.73 (D) 46s, 1m SBL:.74 (D) 5s, 5m SBT:.92 (E) 61s, 13m Overall:.45 v/c LOS B EBT:.18 (B) 17s, 3m WBT.38 (B) 19s, 45m NBL:.12 (B) 16s,15m NBT:.52 (C) 21s, 8m SBL:.7 (B) 16s, 1m SBT:.12 (B) 16s, 15m Overall:.57 v/c LOS B EBT:.36 (B) 19s, 55m WBT.55 (C) 22s, 85m NBL:.14 (B) 16s, 15m NBT:.59 (C) 23s, 9m SBL:.1 (B) 16s, 1m SBT:.14 (B) 16s, 2m Overall:.58 v/c LOS C EBT:.43 (B) 2s, 65m WBT.51(C) 21s, 75m NBL:.32 (B) 19s, 3m NBT:.65 (C) 24s, 15m SBL:.11 (B) 17s, 1m SBT:.17 (B) 16s, 2m Overall:.93 v/c LOS D EBT:.85 (D) 39s, 165m WBT.88 (D) 51s, 185m NBL:.78 (D) 53s, 5m NBT:.8 (D) 46s, 12m SBL:.95 (E) 76s, 8m SBT:.64 (D) 38s, 1m Overall:.97 v/c LOS E EBT:.95 (D) 52s, 2m WBT.89 (D) 53s, 19m NBL:.93 (E) 71s, 95m NBT:.88 (D) 52s, 145m SBL:.95 (E) 79s, 8m SBT:.87 (D) 55s, 13m Report for Fieldgate - Traffic Impact Study Proposed Retail Commercial Development, /881153/ 21
28 This intersection currently has very good operating characteristics during both study peak hours, and is substantially under its capacity. This is expected to continue under the future background and total 217 traffic conditions. The incremental impact of the added commercial site traffic is negligible during the weekday am peak hour and apparent but minimal during the weekday pm peak hour. Under the future background and total 221 traffic conditions the operational characteristics continue to be satisfactory during the weekday am peak hour, with negligible impact due to the added commercial site traffic. During the weekday pm peak hour, build-out of the Boyne Secondary Plan Area substantially increases the east-west through volume. The incremental impact of the added commercial site traffic is apparent under these future total traffic conditions, and while the intersection has reserve capacity, the optimization of the traffic signal timing is indicative of competing demands for green time. The future traffic signal timing plans are expected to be adapted to the prevailing turning movement demands. The only recommended lane improvements at the intersection are based on accommodating the future left turn queues by providing satisfactory storage lengths at the detailed design stage of the future improvements. Kennedy Circle at Louis St. Laurent Avenue Capacity analyses under existing and both future (background and total) 217 and 221 traffic conditions during the weekday am and peak hours is summarized in Table 4 from detailed Synchro reports attached in the appendix. The future total 217 analyses assumed stop control on Kennedy Circle and without a significant extension of the road south of the subject site. The future total 221 analyses assumed that the intersection is signalized during build-out of the Boyne Secondary Plan Area. Table 4 Capacity analyses of Kennedy Circle at Louis St. Laurent Avenue Traffic Condition Movement v/c (LOS) delay in seconds, 95 th Percentile Queue AM Peak Hour PM Peak Hour Existing 214 SBL:.7 (B) 15s, 1 veh SBR:.2 (A) 1s, 1 veh SBL:.6 (B) 14s, 1 veh SBR:.2 (B) 11s, 1 veh Future Background 217 Future Total 217 Future Background 221 Future Total 221 SBL:.1 (C) 2s, 1 veh SBR:.3 (B) 11s, 1 veh SBL:.11 (C) 22s, 1 veh SBTR:.3 (B) 12s, 1 veh NBTR:.1 (B) 14s, 1 veh Overall:.55 v/c LOS B EBT:.63 (B) 15s, 125m WBT:.6 (B) 11s, 6m NBT:.17 (B) 18s, 15m SBT:.7 (B) 17s, 1m Overall:.54 v/c LOS B EBT:.63 (B) 17s, 13m WBT:.59 (B) 11s, 6m NBT:.3 (B) 2s, 25m SBT:.8 (B) 17s, 1m SBL:.1 (C) 2s, 1 veh SBR:.2 (B) 12s, 1 veh SBL:.15 (D) 28s, 1 veh SBTR:.5 (C) 15s, 1 veh NBTR:.6 (B) 15s, 1 veh Overall:.59 v/c LOS B EBT:.7 (B) 13s, 15m WBT:.68 (B) 13s, 7m NBT:.9 (B) 17s, 1m SBT:.9 (B) 17s, 1m Overall:.72 v/c LOS C EBT:.96 (D) 38s, 16m WBT:.73 (B) 14s, 8m NBT:.12 (B) 18s, 15m SBT:.11 (B) 18s, 15m 22 Report for Fieldgate - Traffic Impact Study Proposed Retail Commercial Development, /881153/
29 Kennedy Circle currently Tee intersects with Louis St. Laurent Avenue and has very good unsignalized operating conditions during both study peak hours. It is expected to continue with very good future background and total 217 operational characteristics during both the weekday am and pm peak hours, and without any predicted queuing. The incremental impact of the added commercial site traffic is negligible during the weekday am peak hour and apparent but minimal during the weekday pm peak hour. Under the future background and total 221 traffic conditions the signalized operational characteristics are again very good during the weekday am peak hour, and the intersection has substantial reserve capacity. During the weekday pm peak hour, build-out of the Boyne Secondary Plan Area substantially increases the east-west through volume. While the future total traffic Kennedy Circle approach volumes limit the east-west through green time, the intersection otherwise has very good operating characteristics, and has significant reserve capacity. The incremental impact of the added commercial site traffic is apparent under the future total traffic conditions as the demand for westbound left turn green time (with a short protected phase) further limits the available eastbound green time, but overall operations are otherwise expected to be satisfactory. There are no recommended lane improvements at the intersection, and the future traffic signal timing plans are expected to be adapted to the prevailing built-out conditions. Retail Commercial (West) Driveway at Thompson Road Capacity analyses under future total 217 and 221 traffic conditions during the weekday am and peak hours is summarized in Table 5 from detailed Synchro reports attached in the appendix. The capacity analyses assume a five-lane cross section with either dedicated or two-way left turn lanes on Thompson Road. Table 5 Capacity analyses of Retail Commercial Driveway at Thompson Road Future Total Traffic Condition and Commercial Driveway Movement v/c (LOS) delay in seconds, 95 th Percentile Queue AM Peak Hour PM Peak Hour 217 West Driveway 221 West Driveway SBL:.2 (A) 8s, 1 veh WBLR:.6 (B) 12s, 1 veh SBL:.3 (A) 1s, 1 veh WBLR:.11 (C) 2s, 1 veh SBL:.8 (A) 9s, 1 veh WBLR:.45 (C) 19s, 3 veh SBL:.21 (B) 13s, 1 veh WBLR: 1.11 (F) 15s, 11 veh (WBL:.79 (F) 152s, 4 veh)* The west side site driveway intersection with Thompson Road is expected to have very good future total 217 operational characteristics during both the weekday am and pm peak hours. There is a nominal predicted 95 th percentile queue of 3 vehicles during the weekday pm peak hour. Under the future total 221 traffic conditions the operational characteristics are again very good during the weekday am peak hour. During the weekday pm peak hour and typical of a neighbourhood plaza at this time of day, there is an overall higher traffic volume and longer average delays, particularly for the westbound exit movements from the plaza. The operation of this intersection would benefit significantly from a widened throat for the provision of separate left and right turn lanes to better accommodate the higher right turn volume. Under this condition the left turn exit queues* are predicted to intermittently reach 4 vehicles. The intervals would Report for Fieldgate - Traffic Impact Study Proposed Retail Commercial Development, /881153/ 23
30 be typically short and are acceptable plaza driveway operating conditions in a built-out area. There are no other recommended lane improvements at the intersection Residential Private (West) Driveway at Thompson Road Capacity analyses under future total 221 traffic conditions during the weekday am and peak hours is summarized in Table 6 from detailed Synchro reports attached in the appendix. The capacity analyses assume a five-lane cross section with either dedicated or two-way left turn lanes on Thompson Road. Table 6 Capacity analyses of Residential Driveway at Thompson Road Future Total Traffic Condition and Residential Driveway Movement v/c (LOS) delay in seconds, 95 th Percentile Queue AM Peak Hour PM Peak Hour 221 West Driveway SBL:.2 (A) 1s, 1 veh WBLR:.23 (C) 19s, 1 veh SBL:.7 (B) 12s, 1 veh WBLR:.22 (D) 3s, 1 veh The west side site driveway intersection with Thompson Road is expected to have good future total 221 operational characteristics during both the weekday am and pm peak hours. While the Thompson Road volumes result in moderate westbound exit delays, there is no queuing. There are no recommended lane improvements at the intersection Retail Commercial (East) Driveway at Kennedy Circle Capacity analyses under future total 217 and 221 traffic conditions during the weekday am and peak hours is summarized in Table 7 from detailed Synchro reports attached in the appendix. The analyses did not include any auxiliary turning lanes. Table 7 Capacity analyses of Retail Commercial Driveway at Kennedy Circle Future Total Traffic Condition and Commercial Driveway Movement v/c (LOS) delay in seconds, 95 th Percentile Queue AM Peak Hour PM Peak Hour 217 East Driveway EBLR:.1 (A) 9s, 1 veh EBLR:.2 (A) 9s, 1 veh 221 East Driveway NBL:.1 (A) 1 s, 1 veh EBLR:.2 (B) 12s, 1 veh NBL:.1 (A) 1 s, 1 veh EBLR:.4 (B) 13s, 1 veh The east side site driveway intersection with Kennedy Circle is expected to have very good future total 217 and 221 operational characteristics during both the weekday am and pm peak hours. There is no predicted queuing and there are no recommended lane improvements at the intersection. Residential Private (East) Driveway at Kennedy Circle Capacity analyses under future total 221 traffic conditions during the weekday am and peak hours is summarized in Table 8 from detailed Synchro reports attached in the appendix. The analyses did not include any auxiliary turning lanes. 24 Report for Fieldgate - Traffic Impact Study Proposed Retail Commercial Development, /881153/
31 Table 8 Capacity analyses of Residential Driveway at Kennedy Circle Future Total Traffic Condition and Residential Driveway Movement v/c (LOS) delay in seconds, 95 th Percentile Queue AM Peak Hour PM Peak Hour 221 East Driveway NBL:.1 (A) 1 s, 1 veh EBLR:.9 (B) 11s, 1 veh NBL:.1 (A) 1 s, 1 veh EBLR:.6 (B) 13s, 1 veh The east side site driveway intersection with Kennedy Circle is expected to have very good future total 221 operational characteristics during both the weekday am and pm peak hours. There is no predicted queuing and there are no recommended lane improvements at the intersection. Right In/Out Driveway at Louis St. Laurent Avenue Capacity analyses under future total 217 and 221 traffic conditions during the weekday am and peak hours is summarized in Table 9 from detailed Synchro reports attached in the appendix. Table 9 Capacity analyses of Right In/Out Driveway at Louis St. Laurent Avenue Future Total Traffic Condition and Driveway Movement v/c (LOS) delay in seconds, 95 th Percentile Queue AM Peak Hour PM Peak Hour 217 Right In/Out Driveway NBR:.3 (B) 11s, 1 veh NBR:.8 (B) 11s, 1 veh 221 Right In/Out Driveway NBR:.1 (A) 1s, 1 veh NBR:.7 (B) 11s, 1 veh The right-in/out site driveway intersection with Louis St. Laurent Avenue is expected to have very good future total 217 and 221 operational characteristics during both the weekday am and pm peak hours. There is no predicted queuing and there are no recommended lane improvements at the intersection. Report for Fieldgate - Traffic Impact Study Proposed Retail Commercial Development, /881153/ 25
32 Report for Fieldgate - Traffic Impact Study Proposed Retail Commercial Development, /881153/ Appendices
33 Appendix A Background Information Report for Fieldgate - Traffic Impact Study Proposed Retail Commercial Development, /881153/ 27
34 & ELECT. RM S.F.) CARS Halton-Front End Custom 5.44m Halton-Front End Custom EXTERIOR GARBAGE ENCLOSURE & ELECT. RM S.F.) CARS WB-2 TAC-1999 (CA) EXTERIOR GARBAGE ENCLOSURE WB-2 TAC-1999 (CA) WB-2 TAC-1999 (CA) m SCALE 1:5 AT ORIGINAL SIZE Fieldgate Thompson R. and Louis St. Laurent Ave. Traffic Impact Study Garbage and Loading Area Truck Swept Path Analysis Job Number Revision Date Figure AT Millcreek Drive, Unit 1, Mississauga Ontario L5N 5M4 T F E info@ghdcanada.com W A Sept 214 Plot Date: 23 September 214-2:49 PM Plotted by: Michael Dowdall Cad File No: X:\88\1153 Thompson\CADD\Drawings\Autoturn\ Truck Path Analysis.dwg
35 Ontario Traffic Inc. Morning Peak Diagram Specified Period From: 7:: To: 9:: One Hour Peak From: 7:3: To: 8:3: Municipality: Site #: Intersection: TFR File #: Count date: Milton Louis St. Laurent Ave & Kennedy Ci 12 6-Jun-13 Weather conditions: Person(s) who counted: ** Non-Signalized Intersection ** Major Road: Louis St. Laurent Ave runs W/E North Leg Total: 67 Heavys 2 2 Heavys 4 East Leg Total: 532 North Entering: 5 Trucks Trucks East Entering: 187 North Peds: 18 Cars Cars 13 East Peds: Peds Cross: Totals Totals 17 Peds Cross: Heavys Trucks Cars Totals Kennedy Circle N Cars Trucks Heavys Totals Louis St. Laurent Ave W E Heavys Trucks Cars Totals S Louis St. Laurent Ave Cars Trucks Heavys Totals Peds Cross: West Peds: West Entering: West Leg Total: Comments
36 Ontario Traffic Inc. Afternoon Peak Diagram Specified Period From: 16:: To: 18:: One Hour Peak From: 17:: To: 18:: Municipality: Site #: Intersection: TFR File #: Count date: Milton Louis St. Laurent Ave & Kennedy Ci 12 6-Jun-13 Weather conditions: Person(s) who counted: ** Non-Signalized Intersection ** Major Road: Louis St. Laurent Ave runs W/E North Leg Total: 91 Heavys Heavys East Leg Total: 6 North Entering: 34 Trucks 1 1 Trucks East Entering: 371 North Peds: 15 Cars Cars 57 East Peds: Peds Cross: Totals Totals 57 Peds Cross: Heavys Trucks Cars Totals Kennedy Circle N Cars Trucks Heavys Totals Louis St. Laurent Ave W E Heavys Trucks Cars Totals S Louis St. Laurent Ave Cars Trucks Heavys Totals Peds Cross: West Peds: West Entering: West Leg Total: Comments
37 Ontario Traffic Inc. Morning Peak Diagram Specified Period From: 7:: To: 9:: One Hour Peak From: 7:3: To: 8:3: Municipality: Site #: Intersection: TFR File #: Count date: Milton Thompson Rd & Louis St. Laurent A 3 5-Jun-13 Weather conditions: Person(s) who counted: ** Signalized Intersection ** Major Road: Thompson Rd runs N/S North Leg Total: 681 Heavys 1 1 Heavys 2 East Leg Total: 558 North Entering: 55 Trucks Trucks 2 East Entering: 185 North Peds: 8 Cars Cars 172 East Peds: Peds Cross: Totals Totals 176 Peds Cross: Heavys Trucks Cars Totals Louis St. Laurent Ave Heavys Trucks Cars Totals Thompson Rd N W E S Thompson Rd Cars Trucks Heavys Totals Louis St. Laurent Ave Cars Trucks Heavys Totals Peds Cross: Cars 437 Cars Peds Cross: West Peds: Trucks 3 Trucks 2 2 South Peds: 2 West Entering: 342 Heavys 1 Heavys 1 1 South Entering: 124 West Leg Total: 58 Totals 441 Totals South Leg Total: 565 Comments
38 Ontario Traffic Inc. Afternoon Peak Diagram Specified Period From: 16:: To: 18:: One Hour Peak From: 16:45: To: 17:45: Municipality: Site #: Intersection: TFR File #: Count date: Milton Thompson Rd & Louis St. Laurent A 3 5-Jun-13 Weather conditions: Person(s) who counted: ** Signalized Intersection ** Major Road: Thompson Rd runs N/S North Leg Total: 752 Heavys Heavys 2 East Leg Total: 468 North Entering: 241 Trucks 1 1 Trucks 5 East Entering: 276 North Peds: 9 Cars Cars 54 East Peds: Peds Cross: Totals Totals 511 Peds Cross: Heavys Trucks Cars Totals Louis St. Laurent Ave Heavys Trucks Cars Totals Thompson Rd N W E S Thompson Rd Cars Trucks Heavys Totals Louis St. Laurent Ave Cars Trucks Heavys Totals Peds Cross: Cars 191 Cars Peds Cross: West Peds: Trucks 2 Trucks 5 5 South Peds: West Entering: 218 Heavys Heavys 1 1 South Entering: 48 West Leg Total: 537 Totals 193 Totals South Leg Total: 673 Comments
39 Appendix B Capacity Analyses Report for Fieldgate - Traffic Impact Study Proposed Retail Commercial Development, /881153/
40 Timings 214 Existing Traffic 2: Thompson Rd. & L.St.Laurent Ave./L.St. Laurent Ave. AM Peak Hour Lane Group EBL EBT EBR WBL WBT WBR NBL NBT NBR SBL SBT SBR Volume (vph) Ideal Flow (vphpl) Storage Length (m) Storage Lanes Taper Length (m) Right Turn on Red Yes Yes Yes Yes Link Speed (k/h) Link Distance (m) Travel Time (s) Lane Group Flow (vph) Turn Type Perm NA Perm NA Perm NA Perm NA Protected Phases Permitted Phases Minimum Split (s) Total Split (s) Total Split (%) 5.% 5.% 5.% 5.% 5.% 5.% 5.% 5.% Yellow Time (s) All-Red Time (s) Lost Time Adjust (s) Total Lost Time (s) Lead/Lag Lead-Lag Optimize? v/c Ratio Control Delay Queue Delay Total Delay Queue Length 5th (m) Queue Length 95th (m) Internal Link Dist (m) Turn Bay Length (m) Base Capacity (vph) Starvation Cap Reductn Spillback Cap Reductn Storage Cap Reductn Reduced v/c Ratio Area Type: Other Cycle Length: 9 Actuated Cycle Length: 9 Offset: (%), Referenced to phase 2:NBTL and 6:SBTL, Start of Green Natural Cycle: 45 Control Type: Pretimed Splits and Phases: 2: Thompson Rd. & L.St.Laurent Ave./L.St. Laurent Ave. 9/23/214
41 HCM Signalized Intersection Capacity Analysis 214 Existing Traffic 2: Thompson Rd. & L.St.Laurent Ave./L.St. Laurent Ave. AM Peak Hour Movement EBL EBT EBR WBL WBT WBR NBL NBT NBR SBL SBT SBR Volume (vph) Ideal Flow (vphpl) Total Lost time (s) Lane Util. Factor Frt Flt Protected Satd. Flow (prot) Flt Permitted Satd. Flow (perm) Peak-hour factor, PHF Adj. Flow (vph) RTOR Reduction (vph) Lane Group Flow (vph) Turn Type Perm NA Perm NA Perm NA Perm NA Protected Phases Permitted Phases Actuated Green, G (s) Effective Green, g (s) Actuated g/c Ratio Clearance Time (s) Lane Grp Cap (vph) v/s Ratio Prot c c.11 v/s Ratio Perm v/c Ratio Uniform Delay, d Progression Factor Incremental Delay, d Delay (s) Level of Service B B B B B B B B Approach Delay (s) Approach LOS B B B B HCM 2 Control Delay 17.1 HCM 2 Level of Service B HCM 2 Volume to Capacity ratio.32 Actuated Cycle Length (s) 9. Sum of lost time (s) 12. Intersection Capacity Utilization 46.4% ICU Level of Service A Analysis Period (min) 15 c Critical Lane Group 9/23/214
42 HCM Unsignalized Intersection Capacity Analysis 214 Existing Traffic 6: Kennedy Cir. & L.St.Laurent Ave./L.St. Laurent Ave. AM Peak Hour Movement EBL EBT EBR WBL WBT WBR NBL NBT NBR SBL SBT SBR Volume (veh/h) Sign Control Free Free Stop Stop Grade % % % % Peak Hour Factor Hourly flow rate (vph) Pedestrians Lane Width (m) Walking Speed (m/s) Percent Blockage Right turn flare (veh) Median type None None Median storage veh) Upstream signal (m) 236 px, platoon unblocked vc, conflicting volume vc1, stage 1 conf vol vc2, stage 2 conf vol vcu, unblocked vol tc, single (s) tc, 2 stage (s) tf (s) p queue free % cm capacity (veh/h) Direction, Lane # EB 1 EB 2 WB 1 WB 2 NB 1 NB 2 SB 1 SB 2 Volume Total Volume Left 4 28 Volume Right csh Volume to Capacity Queue Length 95th (m) Control Delay (s) Lane LOS A A A B A Approach Delay (s) Approach LOS A B Average Delay.9 Intersection Capacity Utilization 29.4% ICU Level of Service A Analysis Period (min) 15 9/23/214
43 Timings 214 Existing Traffic 2: Thompson Rd. & L.St.Laurent Ave./L.St. Laurent Ave. PM Peak Hour Lane Group EBL EBT EBR WBL WBT WBR NBL NBT NBR SBL SBT SBR Volume (vph) Ideal Flow (vphpl) Storage Length (m) Storage Lanes Taper Length (m) Right Turn on Red Yes Yes Yes Yes Link Speed (k/h) Link Distance (m) Travel Time (s) Lane Group Flow (vph) Turn Type Perm NA Perm NA Perm NA Perm NA Protected Phases Permitted Phases Minimum Split (s) Total Split (s) Total Split (%) 5.% 5.% 5.% 5.% 5.% 5.% 5.% 5.% Yellow Time (s) All-Red Time (s) Lost Time Adjust (s) Total Lost Time (s) Lead/Lag Lead-Lag Optimize? v/c Ratio Control Delay Queue Delay Total Delay Queue Length 5th (m) Queue Length 95th (m) Internal Link Dist (m) Turn Bay Length (m) Base Capacity (vph) Starvation Cap Reductn Spillback Cap Reductn Storage Cap Reductn Reduced v/c Ratio Area Type: Other Cycle Length: 9 Actuated Cycle Length: 9 Offset: (%), Referenced to phase 2:NBTL and 6:SBTL, Start of Green Natural Cycle: 45 Control Type: Pretimed Splits and Phases: 2: Thompson Rd. & L.St.Laurent Ave./L.St. Laurent Ave. 9/23/214
44 HCM Signalized Intersection Capacity Analysis 214 Existing Traffic 2: Thompson Rd. & L.St.Laurent Ave./L.St. Laurent Ave. PM Peak Hour Movement EBL EBT EBR WBL WBT WBR NBL NBT NBR SBL SBT SBR Volume (vph) Ideal Flow (vphpl) Total Lost time (s) Lane Util. Factor Frt Flt Protected Satd. Flow (prot) Flt Permitted Satd. Flow (perm) Peak-hour factor, PHF Adj. Flow (vph) RTOR Reduction (vph) Lane Group Flow (vph) Turn Type Perm NA Perm NA Perm NA Perm NA Protected Phases Permitted Phases Actuated Green, G (s) Effective Green, g (s) Actuated g/c Ratio Clearance Time (s) Lane Grp Cap (vph) v/s Ratio Prot.8 c.16 c.22.5 v/s Ratio Perm v/c Ratio Uniform Delay, d Progression Factor Incremental Delay, d Delay (s) Level of Service B B B B B C B B Approach Delay (s) Approach LOS B B C B HCM 2 Control Delay 18.2 HCM 2 Level of Service B HCM 2 Volume to Capacity ratio.45 Actuated Cycle Length (s) 9. Sum of lost time (s) 12. Intersection Capacity Utilization 66.5% ICU Level of Service C Analysis Period (min) 15 c Critical Lane Group 9/23/214
45 HCM Unsignalized Intersection Capacity Analysis 214 Existing Traffic 6: Kennedy Cir. & L.St.Laurent Ave./L.St. Laurent Ave. PM Peak Hour Movement EBL EBT EBR WBL WBT WBR NBL NBT NBR SBL SBT SBR Volume (veh/h) Sign Control Free Free Stop Stop Grade % % % % Peak Hour Factor Hourly flow rate (vph) Pedestrians Lane Width (m) Walking Speed (m/s) Percent Blockage Right turn flare (veh) Median type None None Median storage veh) Upstream signal (m) 236 px, platoon unblocked vc, conflicting volume vc1, stage 1 conf vol vc2, stage 2 conf vol vcu, unblocked vol tc, single (s) tc, 2 stage (s) tf (s) p queue free % cm capacity (veh/h) Direction, Lane # EB 1 EB 2 WB 1 WB 2 NB 1 NB 2 SB 1 SB 2 Volume Total Volume Left Volume Right csh Volume to Capacity Queue Length 95th (m) Control Delay (s) Lane LOS A A A B B Approach Delay (s) Approach LOS A B Average Delay 1.1 Intersection Capacity Utilization 29.7% ICU Level of Service A Analysis Period (min) 15 9/23/214
46 Timings 217 Background Traffic 2: Thompson Rd. & L.St.Laurent Ave./L.St. Laurent Ave. AM Peak Hour Lane Group EBL EBT EBR WBL WBT WBR NBL NBT NBR SBL SBT SBR Volume (vph) Ideal Flow (vphpl) Storage Length (m) Storage Lanes Taper Length (m) Right Turn on Red Yes Yes Yes Yes Link Speed (k/h) Link Distance (m) Travel Time (s) Lane Group Flow (vph) Turn Type Perm NA Perm NA Perm NA Perm NA Protected Phases Permitted Phases Minimum Split (s) Total Split (s) Total Split (%) 5.% 5.% 5.% 5.% 5.% 5.% 5.% 5.% Yellow Time (s) All-Red Time (s) Lost Time Adjust (s) Total Lost Time (s) Lead/Lag Lead-Lag Optimize? v/c Ratio Control Delay Queue Delay Total Delay Queue Length 5th (m) Queue Length 95th (m) Internal Link Dist (m) Turn Bay Length (m) Base Capacity (vph) Starvation Cap Reductn Spillback Cap Reductn Storage Cap Reductn Reduced v/c Ratio Area Type: Other Cycle Length: 9 Actuated Cycle Length: 9 Offset: 72 (8%), Referenced to phase 2:NBTL and 6:SBTL, Start of Green Natural Cycle: 45 Control Type: Pretimed Splits and Phases: 2: Thompson Rd. & L.St.Laurent Ave./L.St. Laurent Ave. 9/23/214
47 HCM Signalized Intersection Capacity Analysis 217 Background Traffic 2: Thompson Rd. & L.St.Laurent Ave./L.St. Laurent Ave. AM Peak Hour Movement EBL EBT EBR WBL WBT WBR NBL NBT NBR SBL SBT SBR Volume (vph) Ideal Flow (vphpl) Total Lost time (s) Lane Util. Factor Frt Flt Protected Satd. Flow (prot) Flt Permitted Satd. Flow (perm) Peak-hour factor, PHF Adj. Flow (vph) RTOR Reduction (vph) Lane Group Flow (vph) Turn Type Perm NA Perm NA Perm NA Perm NA Protected Phases Permitted Phases Actuated Green, G (s) Effective Green, g (s) Actuated g/c Ratio Clearance Time (s) Lane Grp Cap (vph) v/s Ratio Prot c c.13 v/s Ratio Perm v/c Ratio Uniform Delay, d Progression Factor Incremental Delay, d Delay (s) Level of Service B C B B B B B B Approach Delay (s) Approach LOS C B B B HCM 2 Control Delay 18.4 HCM 2 Level of Service B HCM 2 Volume to Capacity ratio.4 Actuated Cycle Length (s) 9. Sum of lost time (s) 12. Intersection Capacity Utilization 61.3% ICU Level of Service B Analysis Period (min) 15 c Critical Lane Group 9/23/214
48 HCM Unsignalized Intersection Capacity Analysis 217 Background Traffic 6: Kennedy Cir. & L.St.Laurent Ave./L.St. Laurent Ave. AM Peak Hour Movement EBL EBT EBR WBL WBT WBR NBL NBT NBR SBL SBT SBR Volume (veh/h) Sign Control Free Free Stop Stop Grade % % % % Peak Hour Factor Hourly flow rate (vph) Pedestrians Lane Width (m) Walking Speed (m/s) Percent Blockage Right turn flare (veh) Median type None None Median storage veh) Upstream signal (m) 236 px, platoon unblocked vc, conflicting volume vc1, stage 1 conf vol vc2, stage 2 conf vol vcu, unblocked vol tc, single (s) tc, 2 stage (s) tf (s) p queue free % cm capacity (veh/h) Direction, Lane # EB 1 EB 2 WB 1 WB 2 NB 1 NB 2 SB 1 SB 2 Volume Total Volume Left 4 28 Volume Right csh Volume to Capacity Queue Length 95th (m) Control Delay (s) Lane LOS A A A C B Approach Delay (s) Approach LOS A C Average Delay.8 Intersection Capacity Utilization 34.9% ICU Level of Service A Analysis Period (min) 15 9/23/214
49 Timings 217 Background Traffic 2: Thompson Rd. & L.St.Laurent Ave./L.St. Laurent Ave. PM Peak Hour Lane Group EBL EBT EBR WBL WBT WBR NBL NBT NBR SBL SBT SBR Volume (vph) Ideal Flow (vphpl) Storage Length (m) Storage Lanes Taper Length (m) Right Turn on Red Yes Yes Yes Yes Link Speed (k/h) Link Distance (m) Travel Time (s) Lane Group Flow (vph) Turn Type Perm NA Perm NA Perm NA Perm NA Protected Phases Permitted Phases Minimum Split (s) Total Split (s) Total Split (%) 5.% 5.% 5.% 5.% 5.% 5.% 5.% 5.% Yellow Time (s) All-Red Time (s) Lost Time Adjust (s) Total Lost Time (s) Lead/Lag Lead-Lag Optimize? v/c Ratio Control Delay Queue Delay Total Delay Queue Length 5th (m) Queue Length 95th (m) Internal Link Dist (m) Turn Bay Length (m) Base Capacity (vph) Starvation Cap Reductn Spillback Cap Reductn Storage Cap Reductn Reduced v/c Ratio Area Type: Other Cycle Length: 9 Actuated Cycle Length: 9 Offset: (%), Referenced to phase 2:NBTL and 6:SBTL, Start of Green Natural Cycle: 45 Control Type: Pretimed Splits and Phases: 2: Thompson Rd. & L.St.Laurent Ave./L.St. Laurent Ave. 9/23/214
50 HCM Signalized Intersection Capacity Analysis 217 Background Traffic 2: Thompson Rd. & L.St.Laurent Ave./L.St. Laurent Ave. PM Peak Hour Movement EBL EBT EBR WBL WBT WBR NBL NBT NBR SBL SBT SBR Volume (vph) Ideal Flow (vphpl) Total Lost time (s) Lane Util. Factor Frt Flt Protected Satd. Flow (prot) Flt Permitted Satd. Flow (perm) Peak-hour factor, PHF Adj. Flow (vph) RTOR Reduction (vph) Lane Group Flow (vph) Turn Type Perm NA Perm NA Perm NA Perm NA Protected Phases Permitted Phases Actuated Green, G (s) Effective Green, g (s) Actuated g/c Ratio Clearance Time (s) Lane Grp Cap (vph) v/s Ratio Prot.16 c.24 c.25.6 v/s Ratio Perm v/c Ratio Uniform Delay, d Progression Factor Incremental Delay, d Delay (s) Level of Service B B B C B C B B Approach Delay (s) Approach LOS B C C B HCM 2 Control Delay 19.8 HCM 2 Level of Service B HCM 2 Volume to Capacity ratio.57 Actuated Cycle Length (s) 9. Sum of lost time (s) 12. Intersection Capacity Utilization 76.8% ICU Level of Service D Analysis Period (min) 15 c Critical Lane Group 9/23/214
51 HCM Unsignalized Intersection Capacity Analysis 217 Background Traffic 6: Kennedy Cir. & L.St.Laurent Ave./L.St. Laurent Ave. PM Peak Hour Movement EBL EBT EBR WBL WBT WBR NBL NBT NBR SBL SBT SBR Volume (veh/h) Sign Control Free Free Stop Stop Grade % % % % Peak Hour Factor Hourly flow rate (vph) Pedestrians Lane Width (m) Walking Speed (m/s) Percent Blockage Right turn flare (veh) Median type None None Median storage veh) Upstream signal (m) 236 px, platoon unblocked vc, conflicting volume vc1, stage 1 conf vol vc2, stage 2 conf vol vcu, unblocked vol tc, single (s) tc, 2 stage (s) tf (s) p queue free % cm capacity (veh/h) Direction, Lane # EB 1 EB 2 WB 1 WB 2 NB 1 NB 2 SB 1 SB 2 Volume Total Volume Left Volume Right csh Volume to Capacity Queue Length 95th (m) Control Delay (s) Lane LOS A A A C B Approach Delay (s) Approach LOS A C Average Delay.9 Intersection Capacity Utilization 36.8% ICU Level of Service A Analysis Period (min) 15 9/23/214
52 Timings 217 Total Traffic 2: Thompson Rd. & L.St.Laurent Ave./L.St. Laurent Ave. AM Peak Hour Lane Group EBL EBT EBR WBL WBT WBR NBL NBT NBR SBL SBT SBR Volume (vph) Ideal Flow (vphpl) Storage Length (m) Storage Lanes Taper Length (m) Right Turn on Red Yes Yes Yes Yes Link Speed (k/h) Link Distance (m) Travel Time (s) Lane Group Flow (vph) Turn Type Perm NA Perm NA Perm NA Perm NA Protected Phases Permitted Phases Minimum Split (s) Total Split (s) Total Split (%) 5.% 5.% 5.% 5.% 5.% 5.% 5.% 5.% Yellow Time (s) All-Red Time (s) Lost Time Adjust (s) Total Lost Time (s) Lead/Lag Lead-Lag Optimize? v/c Ratio Control Delay Queue Delay Total Delay Queue Length 5th (m) Queue Length 95th (m) Internal Link Dist (m) Turn Bay Length (m) Base Capacity (vph) Starvation Cap Reductn Spillback Cap Reductn Storage Cap Reductn Reduced v/c Ratio Area Type: Other Cycle Length: 9 Actuated Cycle Length: 9 Offset: (%), Referenced to phase 2:NBTL and 6:SBTL, Start of Green Natural Cycle: 45 Control Type: Pretimed Splits and Phases: 2: Thompson Rd. & L.St.Laurent Ave./L.St. Laurent Ave. 9/23/214
53 HCM Signalized Intersection Capacity Analysis 217 Total Traffic 2: Thompson Rd. & L.St.Laurent Ave./L.St. Laurent Ave. AM Peak Hour Movement EBL EBT EBR WBL WBT WBR NBL NBT NBR SBL SBT SBR Volume (vph) Ideal Flow (vphpl) Total Lost time (s) Lane Util. Factor Frt Flt Protected Satd. Flow (prot) Flt Permitted Satd. Flow (perm) Peak-hour factor, PHF Adj. Flow (vph) RTOR Reduction (vph) Lane Group Flow (vph) Turn Type Perm NA Perm NA Perm NA Perm NA Protected Phases Permitted Phases Actuated Green, G (s) Effective Green, g (s) Actuated g/c Ratio Clearance Time (s) Lane Grp Cap (vph) v/s Ratio Prot c c.13 v/s Ratio Perm v/c Ratio Uniform Delay, d Progression Factor Incremental Delay, d Delay (s) Level of Service B C B B B B B B Approach Delay (s) Approach LOS C B B B HCM 2 Control Delay 18.5 HCM 2 Level of Service B HCM 2 Volume to Capacity ratio.41 Actuated Cycle Length (s) 9. Sum of lost time (s) 12. Intersection Capacity Utilization 62.5% ICU Level of Service B Analysis Period (min) 15 c Critical Lane Group 9/23/214
54 HCM Unsignalized Intersection Capacity Analysis 217 Total Traffic 4: Site RIRO & L.St. Laurent Ave./L.St.Laurent Ave. AM Peak Hour Movement EBT EBR WBL WBT NBL NBR Volume (veh/h) Sign Control Free Free Stop Grade % % % Peak Hour Factor Hourly flow rate (vph) Pedestrians Lane Width (m) Walking Speed (m/s) Percent Blockage Right turn flare (veh) Median type None None Median storage veh) Upstream signal (m) 135 px, platoon unblocked vc, conflicting volume vc1, stage 1 conf vol vc2, stage 2 conf vol vcu, unblocked vol tc, single (s) tc, 2 stage (s) tf (s) p queue free % cm capacity (veh/h) Direction, Lane # EB 1 WB 1 NB 1 Volume Total Volume Left Volume Right csh Volume to Capacity Queue Length 95th (m)...6 Control Delay (s) Lane LOS B Approach Delay (s) Approach LOS B Average Delay.2 Intersection Capacity Utilization 35.9% ICU Level of Service A Analysis Period (min) 15 9/23/214
55 HCM Unsignalized Intersection Capacity Analysis 217 Total Traffic 6: Kennedy Cir. & L.St.Laurent Ave./L.St. Laurent Ave. AM Peak Hour Movement EBL EBT EBR WBL WBT WBR NBL NBT NBR SBL SBT SBR Volume (veh/h) Sign Control Free Free Stop Stop Grade % % % % Peak Hour Factor Hourly flow rate (vph) Pedestrians Lane Width (m) Walking Speed (m/s) Percent Blockage Right turn flare (veh) Median type None None Median storage veh) Upstream signal (m) 236 px, platoon unblocked vc, conflicting volume vc1, stage 1 conf vol vc2, stage 2 conf vol vcu, unblocked vol tc, single (s) tc, 2 stage (s) tf (s) p queue free % cm capacity (veh/h) Direction, Lane # EB 1 EB 2 WB 1 WB 2 NB 1 NB 2 SB 1 SB 2 Volume Total Volume Left Volume Right csh Volume to Capacity Queue Length 95th (m) Control Delay (s) Lane LOS A A A B C B Approach Delay (s) Approach LOS B C Average Delay 1.1 Intersection Capacity Utilization 4.% ICU Level of Service A Analysis Period (min) 15 9/23/214
56 HCM Unsignalized Intersection Capacity Analysis 217 Total Traffic 9: Kennedy Cir. & Front East AM Peak Hour Movement EBL EBR NBL NBT SBT SBR Volume (veh/h) Sign Control Stop Free Free Grade % % % Peak Hour Factor Hourly flow rate (vph) Pedestrians Lane Width (m) Walking Speed (m/s) Percent Blockage Right turn flare (veh) Median type None None Median storage veh) Upstream signal (m) px, platoon unblocked vc, conflicting volume vc1, stage 1 conf vol vc2, stage 2 conf vol vcu, unblocked vol tc, single (s) tc, 2 stage (s) tf (s) p queue free % cm capacity (veh/h) Direction, Lane # EB 1 NB 1 SB 1 Volume Total 3 23 Volume Left 3 Volume Right 21 csh Volume to Capacity...1 Queue Length 95th (m).1.. Control Delay (s) Lane LOS A Approach Delay (s) Approach LOS A Average Delay 1. Intersection Capacity Utilization 13.3% ICU Level of Service A Analysis Period (min) 15 9/23/214
57 HCM Unsignalized Intersection Capacity Analysis 217 Total Traffic 11: Thompson Rd. & Front West AM Peak Hour Movement WBL WBR NBT NBR SBL SBT Volume (veh/h) Sign Control Stop Free Free Grade % % % Peak Hour Factor Hourly flow rate (vph) Pedestrians Lane Width (m) Walking Speed (m/s) Percent Blockage Right turn flare (veh) Median type None None Median storage veh) Upstream signal (m) 9 px, platoon unblocked.88 vc, conflicting volume vc1, stage 1 conf vol vc2, stage 2 conf vol vcu, unblocked vol tc, single (s) tc, 2 stage (s) tf (s) p queue free % cm capacity (veh/h) Direction, Lane # WB 1 NB 1 SB 1 SB 2 Volume Total Volume Left Volume Right 19 8 csh Volume to Capacity Queue Length 95th (m) Control Delay (s) Lane LOS B A Approach Delay (s) Approach LOS B Average Delay.9 Intersection Capacity Utilization 35.9% ICU Level of Service A Analysis Period (min) 15 9/23/214
58 Timings 217 Total Traffic 2: Thompson Rd. & L.St.Laurent Ave./L.St. Laurent Ave. PM Peak Hour Lane Group EBL EBT EBR WBL WBT WBR NBL NBT NBR SBL SBT SBR Volume (vph) Ideal Flow (vphpl) Storage Length (m) Storage Lanes Taper Length (m) Right Turn on Red Yes Yes Yes Yes Link Speed (k/h) Link Distance (m) Travel Time (s) Lane Group Flow (vph) Turn Type Perm NA Perm NA Perm NA Perm NA Protected Phases Permitted Phases Minimum Split (s) Total Split (s) Total Split (%) 5.% 5.% 5.% 5.% 5.% 5.% 5.% 5.% Yellow Time (s) All-Red Time (s) Lost Time Adjust (s) Total Lost Time (s) Lead/Lag Lead-Lag Optimize? v/c Ratio Control Delay Queue Delay Total Delay Queue Length 5th (m) Queue Length 95th (m) Internal Link Dist (m) Turn Bay Length (m) Base Capacity (vph) Starvation Cap Reductn Spillback Cap Reductn Storage Cap Reductn Reduced v/c Ratio Area Type: Other Cycle Length: 9 Actuated Cycle Length: 9 Offset: (%), Referenced to phase 2:NBTL and 6:SBTL, Start of Green Natural Cycle: 5 Control Type: Pretimed Splits and Phases: 2: Thompson Rd. & L.St.Laurent Ave./L.St. Laurent Ave. 9/23/214
59 HCM Signalized Intersection Capacity Analysis 217 Total Traffic 2: Thompson Rd. & L.St.Laurent Ave./L.St. Laurent Ave. PM Peak Hour Movement EBL EBT EBR WBL WBT WBR NBL NBT NBR SBL SBT SBR Volume (vph) Ideal Flow (vphpl) Total Lost time (s) Lane Util. Factor Frt Flt Protected Satd. Flow (prot) Flt Permitted Satd. Flow (perm) Peak-hour factor, PHF Adj. Flow (vph) RTOR Reduction (vph) Lane Group Flow (vph) Turn Type Perm NA Perm NA Perm NA Perm NA Protected Phases Permitted Phases Actuated Green, G (s) Effective Green, g (s) Actuated g/c Ratio Clearance Time (s) Lane Grp Cap (vph) v/s Ratio Prot.19 c.22 c.28.7 v/s Ratio Perm v/c Ratio Uniform Delay, d Progression Factor Incremental Delay, d Delay (s) Level of Service B B B C B C B B Approach Delay (s) Approach LOS B C C B HCM 2 Control Delay 2.3 HCM 2 Level of Service C HCM 2 Volume to Capacity ratio.58 Actuated Cycle Length (s) 9. Sum of lost time (s) 12. Intersection Capacity Utilization 77.9% ICU Level of Service D Analysis Period (min) 15 c Critical Lane Group 9/23/214
60 HCM Unsignalized Intersection Capacity Analysis 217 Total Traffic 4: Site RIRO & L.St. Laurent Ave./L.St.Laurent Ave. PM Peak Hour Movement EBT EBR WBL WBT NBL NBR Volume (veh/h) Sign Control Free Free Stop Grade % % % Peak Hour Factor Hourly flow rate (vph) Pedestrians Lane Width (m) Walking Speed (m/s) Percent Blockage Right turn flare (veh) Median type None None Median storage veh) Upstream signal (m) 135 px, platoon unblocked vc, conflicting volume vc1, stage 1 conf vol vc2, stage 2 conf vol vcu, unblocked vol tc, single (s) tc, 2 stage (s) tf (s) p queue free % cm capacity (veh/h) Direction, Lane # EB 1 WB 1 NB 1 Volume Total Volume Left Volume Right csh Volume to Capacity Queue Length 95th (m).. 2. Control Delay (s) Lane LOS B Approach Delay (s) Approach LOS B Average Delay.7 Intersection Capacity Utilization 3.9% ICU Level of Service A Analysis Period (min) 15 9/23/214
61 HCM Unsignalized Intersection Capacity Analysis 217 Total Traffic 6: Kennedy Cir. & L.St.Laurent Ave./L.St. Laurent Ave. PM Peak Hour Movement EBL EBT EBR WBL WBT WBR NBL NBT NBR SBL SBT SBR Volume (veh/h) Sign Control Free Free Stop Stop Grade % % % % Peak Hour Factor Hourly flow rate (vph) Pedestrians Lane Width (m) Walking Speed (m/s) Percent Blockage Right turn flare (veh) Median type None None Median storage veh) Upstream signal (m) 236 px, platoon unblocked vc, conflicting volume vc1, stage 1 conf vol vc2, stage 2 conf vol vcu, unblocked vol tc, single (s) tc, 2 stage (s) tf (s) p queue free % cm capacity (veh/h) Direction, Lane # EB 1 EB 2 WB 1 WB 2 NB 1 NB 2 SB 1 SB 2 Volume Total Volume Left Volume Right csh Volume to Capacity Queue Length 95th (m) Control Delay (s) Lane LOS A A A B D C Approach Delay (s) Approach LOS B C Average Delay 2.2 Intersection Capacity Utilization 46.8% ICU Level of Service A Analysis Period (min) 15 9/23/214
62 HCM Unsignalized Intersection Capacity Analysis 217 Total Traffic 9: Kennedy Cir. & Front East PM Peak Hour Movement EBL EBR NBL NBT SBT SBR Volume (veh/h) Sign Control Stop Free Free Grade % % % Peak Hour Factor Hourly flow rate (vph) Pedestrians Lane Width (m) Walking Speed (m/s) Percent Blockage Right turn flare (veh) Median type None None Median storage veh) Upstream signal (m) px, platoon unblocked vc, conflicting volume vc1, stage 1 conf vol vc2, stage 2 conf vol vcu, unblocked vol tc, single (s) tc, 2 stage (s) tf (s) p queue free % cm capacity (veh/h) Direction, Lane # EB 1 NB 1 SB 1 Volume Total Volume Left 24 Volume Right 85 csh Volume to Capacity.2..5 Queue Length 95th (m).6.. Control Delay (s) Lane LOS A Approach Delay (s) Approach LOS A Average Delay 1.9 Intersection Capacity Utilization 15.3% ICU Level of Service A Analysis Period (min) 15 9/23/214
63 HCM Unsignalized Intersection Capacity Analysis 217 Total Traffic 11: Thompson Rd. & Front West PM Peak Hour Movement WBL WBR NBT NBR SBL SBT Volume (veh/h) Sign Control Stop Free Free Grade % % % Peak Hour Factor Hourly flow rate (vph) Pedestrians Lane Width (m) Walking Speed (m/s) Percent Blockage Right turn flare (veh) Median type None None Median storage veh) Upstream signal (m) 9 px, platoon unblocked.95 vc, conflicting volume vc1, stage 1 conf vol vc2, stage 2 conf vol vcu, unblocked vol tc, single (s) tc, 2 stage (s) tf (s) p queue free % cm capacity (veh/h) Direction, Lane # WB 1 NB 1 SB 1 SB 2 Volume Total Volume Left Volume Right csh Volume to Capacity Queue Length 95th (m) Control Delay (s) Lane LOS C A Approach Delay (s) Approach LOS C Average Delay 4.4 Intersection Capacity Utilization 57.3% ICU Level of Service B Analysis Period (min) 15 9/23/214
64 Timings 221 Background Traffic 2: Thompson Rd. & L.St.Laurent Ave./L.St. Laurent Ave. AM Peak Hour Lane Group EBL EBT EBR WBL WBT WBR NBL NBT NBR SBL SBT SBR Volume (vph) Ideal Flow (vphpl) Storage Length (m) Storage Lanes Taper Length (m) Right Turn on Red Yes Yes Yes Yes Link Speed (k/h) Link Distance (m) Travel Time (s) Lane Group Flow (vph) Turn Type pm+pt NA pm+pt NA pm+pt NA pm+pt NA Protected Phases Permitted Phases Minimum Split (s) Total Split (s) Total Split (%) 12.5% 5.% 8.3% 45.8% 1.8% 3.8% 1.8% 3.8% Yellow Time (s) All-Red Time (s) Lost Time Adjust (s) Total Lost Time (s) Lead/Lag Lead Lag Lead Lag Lead Lag Lead Lag Lead-Lag Optimize? v/c Ratio Control Delay Queue Delay Total Delay Queue Length 5th (m) Queue Length 95th (m) # m # #47.4 #116.9 Internal Link Dist (m) Turn Bay Length (m) Base Capacity (vph) Starvation Cap Reductn Spillback Cap Reductn Storage Cap Reductn Reduced v/c Ratio Area Type: Other Cycle Length: 12 Actuated Cycle Length: 12 Offset: (%), Referenced to phase 2:NBTL and 6:SBTL, Start of Green Natural Cycle: 8 Control Type: Pretimed # 95th percentile volume exceeds capacity, queue may be longer. Queue shown is maximum after two cycles. m Volume for 95th percentile queue is metered by upstream signal. Splits and Phases: 2: Thompson Rd. & L.St.Laurent Ave./L.St. Laurent Ave. 9/23/214
65 HCM Signalized Intersection Capacity Analysis 221 Background Traffic 2: Thompson Rd. & L.St.Laurent Ave./L.St. Laurent Ave. AM Peak Hour Movement EBL EBT EBR WBL WBT WBR NBL NBT NBR SBL SBT SBR Volume (vph) Ideal Flow (vphpl) Total Lost time (s) Lane Util. Factor Frt Flt Protected Satd. Flow (prot) Flt Permitted Satd. Flow (perm) Peak-hour factor, PHF Adj. Flow (vph) RTOR Reduction (vph) Lane Group Flow (vph) Turn Type pm+pt NA pm+pt NA pm+pt NA pm+pt NA Protected Phases Permitted Phases Actuated Green, G (s) Effective Green, g (s) Actuated g/c Ratio Clearance Time (s) Lane Grp Cap (vph) v/s Ratio Prot c c.34 c v/s Ratio Perm c v/c Ratio Uniform Delay, d Progression Factor Incremental Delay, d Delay (s) Level of Service D C C D E D D D Approach Delay (s) Approach LOS C D D D HCM 2 Control Delay 44.2 HCM 2 Level of Service D HCM 2 Volume to Capacity ratio.85 Actuated Cycle Length (s) 12. Sum of lost time (s) 18. Intersection Capacity Utilization 93.9% ICU Level of Service F Analysis Period (min) 15 c Critical Lane Group 9/23/214
66 Timings 221 Background Traffic 6: Kennedy Cir. & L.St.Laurent Ave./L.St. Laurent Ave. AM Peak Hour Lane Group EBL EBT EBR WBL WBT WBR NBL NBT NBR SBL SBT SBR Volume (vph) Ideal Flow (vphpl) Storage Length (m) Storage Lanes Taper Length (m) Right Turn on Red Yes Yes Yes Yes Link Speed (k/h) Link Distance (m) Travel Time (s) Lane Group Flow (vph) Turn Type Perm NA Perm NA Perm NA Perm NA Protected Phases Permitted Phases Minimum Split (s) Total Split (s) Total Split (%) 63.3% 63.3% 63.3% 63.3% 36.7% 36.7% 36.7% 36.7% Yellow Time (s) All-Red Time (s) Lost Time Adjust (s) Total Lost Time (s) Lead/Lag Lead-Lag Optimize? v/c Ratio Control Delay Queue Delay Total Delay Queue Length 5th (m) Queue Length 95th (m) m Internal Link Dist (m) Turn Bay Length (m) Base Capacity (vph) Starvation Cap Reductn Spillback Cap Reductn Storage Cap Reductn Reduced v/c Ratio Area Type: Other Cycle Length: 6 Actuated Cycle Length: 6 Offset: (%), Referenced to phase 2:NBTL and 6:SBTL, Start of Green Natural Cycle: 55 Control Type: Pretimed m Volume for 95th percentile queue is metered by upstream signal. Splits and Phases: 6: Kennedy Cir. & L.St.Laurent Ave./L.St. Laurent Ave. 9/23/214
67 HCM Signalized Intersection Capacity Analysis 221 Background Traffic 6: Kennedy Cir. & L.St.Laurent Ave./L.St. Laurent Ave. AM Peak Hour Movement EBL EBT EBR WBL WBT WBR NBL NBT NBR SBL SBT SBR Volume (vph) Ideal Flow (vphpl) Total Lost time (s) Lane Util. Factor Frt Flt Protected Satd. Flow (prot) Flt Permitted Satd. Flow (perm) Peak-hour factor, PHF Adj. Flow (vph) RTOR Reduction (vph) Lane Group Flow (vph) Turn Type Perm NA Perm NA Perm NA Perm NA Protected Phases Permitted Phases Actuated Green, G (s) Effective Green, g (s) Actuated g/c Ratio Clearance Time (s) Lane Grp Cap (vph) v/s Ratio Prot c v/s Ratio Perm.1.14 c.1.2 v/c Ratio Uniform Delay, d Progression Factor Incremental Delay, d Delay (s) Level of Service A B B B C B B B Approach Delay (s) Approach LOS B B B B HCM 2 Control Delay 13.6 HCM 2 Level of Service B HCM 2 Volume to Capacity ratio.55 Actuated Cycle Length (s) 6. Sum of lost time (s) 12. Intersection Capacity Utilization 61.6% ICU Level of Service B Analysis Period (min) 15 c Critical Lane Group 9/23/214
68 Timings 221 Background Traffic 2: Thompson Rd. & L.St.Laurent Ave./L.St. Laurent Ave. PM Peak Hour Lane Group EBL EBT EBR WBL WBT WBR NBL NBT NBR SBL SBT SBR Volume (vph) Ideal Flow (vphpl) Storage Length (m) Storage Lanes Taper Length (m) Right Turn on Red Yes Yes Yes Yes Link Speed (k/h) Link Distance (m) Travel Time (s) Lane Group Flow (vph) Turn Type pm+pt NA pm+pt NA pm+pt NA pm+pt NA Protected Phases Permitted Phases Minimum Split (s) Total Split (s) Total Split (%) 8.3% 45.8% 8.3% 45.8% 8.3% 35.% 1.8% 37.5% Yellow Time (s) All-Red Time (s) Lost Time Adjust (s) Total Lost Time (s) Lead/Lag Lead Lag Lead Lag Lead Lag Lead Lag Lead-Lag Optimize? v/c Ratio Control Delay Queue Delay Total Delay Queue Length 5th (m) Queue Length 95th (m) # m# # # Internal Link Dist (m) Turn Bay Length (m) Base Capacity (vph) Starvation Cap Reductn Spillback Cap Reductn Storage Cap Reductn Reduced v/c Ratio Area Type: Other Cycle Length: 12 Actuated Cycle Length: 12 Offset: (%), Referenced to phase 2:NBTL and 6:SBTL, Start of Green Natural Cycle: 9 Control Type: Pretimed # 95th percentile volume exceeds capacity, queue may be longer. Queue shown is maximum after two cycles. m Volume for 95th percentile queue is metered by upstream signal. Splits and Phases: 2: Thompson Rd. & L.St.Laurent Ave./L.St. Laurent Ave. 9/23/214
69 HCM Signalized Intersection Capacity Analysis 221 Background Traffic 2: Thompson Rd. & L.St.Laurent Ave./L.St. Laurent Ave. PM Peak Hour Movement EBL EBT EBR WBL WBT WBR NBL NBT NBR SBL SBT SBR Volume (vph) Ideal Flow (vphpl) Total Lost time (s) Lane Util. Factor Frt Flt Protected Satd. Flow (prot) Flt Permitted Satd. Flow (perm) Peak-hour factor, PHF Adj. Flow (vph) RTOR Reduction (vph) Lane Group Flow (vph) Turn Type pm+pt NA pm+pt NA pm+pt NA pm+pt NA Protected Phases Permitted Phases Actuated Green, G (s) Effective Green, g (s) Actuated g/c Ratio Clearance Time (s) Lane Grp Cap (vph) v/s Ratio Prot c c c.8.21 v/s Ratio Perm c.31 v/c Ratio Uniform Delay, d Progression Factor Incremental Delay, d Delay (s) Level of Service E D E D D D E D Approach Delay (s) Approach LOS D D D D HCM 2 Control Delay 46.1 HCM 2 Level of Service D HCM 2 Volume to Capacity ratio.93 Actuated Cycle Length (s) 12. Sum of lost time (s) 18. Intersection Capacity Utilization 95.7% ICU Level of Service F Analysis Period (min) 15 c Critical Lane Group 9/23/214
70 Timings 221 Background Traffic 6: Kennedy Cir. & L.St.Laurent Ave./L.St. Laurent Ave. PM Peak Hour Lane Group EBL EBT EBR WBL WBT WBR NBL NBT NBR SBL SBT SBR Volume (vph) Ideal Flow (vphpl) Storage Length (m) Storage Lanes Taper Length (m) Right Turn on Red Yes Yes Yes Yes Link Speed (k/h) Link Distance (m) Travel Time (s) Lane Group Flow (vph) Turn Type Perm NA Perm NA Perm NA Perm NA Protected Phases Permitted Phases Minimum Split (s) Total Split (s) Total Split (%) 63.3% 63.3% 63.3% 63.3% 36.7% 36.7% 36.7% 36.7% Yellow Time (s) All-Red Time (s) Lost Time Adjust (s) Total Lost Time (s) Lead/Lag Lead-Lag Optimize? v/c Ratio Control Delay Queue Delay Total Delay Queue Length 5th (m) Queue Length 95th (m) m1. m12.1 # Internal Link Dist (m) Turn Bay Length (m) Base Capacity (vph) Starvation Cap Reductn Spillback Cap Reductn Storage Cap Reductn Reduced v/c Ratio Area Type: Other Cycle Length: 6 Actuated Cycle Length: 6 Offset: (%), Referenced to phase 2:NBTL and 6:SBTL, Start of Green Natural Cycle: 6 Control Type: Pretimed # 95th percentile volume exceeds capacity, queue may be longer. Queue shown is maximum after two cycles. m Volume for 95th percentile queue is metered by upstream signal. Splits and Phases: 6: Kennedy Cir. & L.St.Laurent Ave./L.St. Laurent Ave. 9/23/214
71 HCM Signalized Intersection Capacity Analysis 221 Background Traffic 6: Kennedy Cir. & L.St.Laurent Ave./L.St. Laurent Ave. PM Peak Hour Movement EBL EBT EBR WBL WBT WBR NBL NBT NBR SBL SBT SBR Volume (vph) Ideal Flow (vphpl) Total Lost time (s) Lane Util. Factor Frt Flt Protected Satd. Flow (prot) Flt Permitted Satd. Flow (perm) Peak-hour factor, PHF Adj. Flow (vph) RTOR Reduction (vph) Lane Group Flow (vph) Turn Type Perm NA Perm NA Perm NA Perm NA Protected Phases Permitted Phases Actuated Green, G (s) Effective Green, g (s) Actuated g/c Ratio Clearance Time (s) Lane Grp Cap (vph) v/s Ratio Prot v/s Ratio Perm.8 c.38 c.9.2 v/c Ratio Uniform Delay, d Progression Factor Incremental Delay, d Delay (s) Level of Service A B D B C B B B Approach Delay (s) Approach LOS B B B B HCM 2 Control Delay 14. HCM 2 Level of Service B HCM 2 Volume to Capacity ratio.59 Actuated Cycle Length (s) 6. Sum of lost time (s) 12. Intersection Capacity Utilization 71.1% ICU Level of Service C Analysis Period (min) 15 c Critical Lane Group 9/23/214
72 Timings 221 Total Traffic 2: Thompson Rd. & L.St.Laurent Ave./L.St. Laurent Ave. AM Peak Hour Lane Group EBL EBT EBR WBL WBT WBR NBL NBT NBR SBL SBT SBR Volume (vph) Ideal Flow (vphpl) Storage Length (m) Storage Lanes Taper Length (m) Right Turn on Red Yes Yes Yes Yes Link Speed (k/h) Link Distance (m) Travel Time (s) Lane Group Flow (vph) Turn Type pm+pt NA pm+pt NA pm+pt NA pm+pt NA Protected Phases Permitted Phases Minimum Split (s) Total Split (s) Total Split (%) 12.5% 5.% 8.3% 45.8% 12.5% 3.8% 1.8% 29.2% Yellow Time (s) All-Red Time (s) Lost Time Adjust (s) Total Lost Time (s) Lead/Lag Lead Lag Lead Lag Lead Lag Lead Lag Lead-Lag Optimize? v/c Ratio Control Delay Queue Delay Total Delay Queue Length 5th (m) Queue Length 95th (m) # m # #49.6 #129. Internal Link Dist (m) Turn Bay Length (m) Base Capacity (vph) Starvation Cap Reductn Spillback Cap Reductn Storage Cap Reductn Reduced v/c Ratio Area Type: Other Cycle Length: 12 Actuated Cycle Length: 12 Offset: (%), Referenced to phase 2:NBTL and 6:SBTL, Start of Green Natural Cycle: 8 Control Type: Pretimed # 95th percentile volume exceeds capacity, queue may be longer. Queue shown is maximum after two cycles. m Volume for 95th percentile queue is metered by upstream signal. Splits and Phases: 2: Thompson Rd. & L.St.Laurent Ave./L.St. Laurent Ave. 9/23/214
73 HCM Signalized Intersection Capacity Analysis 221 Total Traffic 2: Thompson Rd. & L.St.Laurent Ave./L.St. Laurent Ave. AM Peak Hour Movement EBL EBT EBR WBL WBT WBR NBL NBT NBR SBL SBT SBR Volume (vph) Ideal Flow (vphpl) Total Lost time (s) Lane Util. Factor Frt Flt Protected Satd. Flow (prot) Flt Permitted Satd. Flow (perm) Peak-hour factor, PHF Adj. Flow (vph) RTOR Reduction (vph) Lane Group Flow (vph) Turn Type pm+pt NA pm+pt NA pm+pt NA pm+pt NA Protected Phases Permitted Phases Actuated Green, G (s) Effective Green, g (s) Actuated g/c Ratio Clearance Time (s) Lane Grp Cap (vph) v/s Ratio Prot c c.34 c v/s Ratio Perm c v/c Ratio Uniform Delay, d Progression Factor Incremental Delay, d Delay (s) Level of Service D C C D E D D E Approach Delay (s) Approach LOS C D D E HCM 2 Control Delay 46.9 HCM 2 Level of Service D HCM 2 Volume to Capacity ratio.88 Actuated Cycle Length (s) 12. Sum of lost time (s) 18. Intersection Capacity Utilization 95.5% ICU Level of Service F Analysis Period (min) 15 c Critical Lane Group 9/23/214
74 HCM Unsignalized Intersection Capacity Analysis 221 Total Traffic 4: Site RIRO & L.St. Laurent Ave./L.St.Laurent Ave. AM Peak Hour Movement EBT EBR WBL WBT NBL NBR Volume (veh/h) Sign Control Free Free Stop Grade % % % Peak Hour Factor Hourly flow rate (vph) Pedestrians Lane Width (m) Walking Speed (m/s) Percent Blockage Right turn flare (veh) Median type None None Median storage veh) Upstream signal (m) px, platoon unblocked vc, conflicting volume vc1, stage 1 conf vol vc2, stage 2 conf vol vcu, unblocked vol tc, single (s) tc, 2 stage (s) tf (s) p queue free % cm capacity (veh/h) Direction, Lane # EB 1 EB 2 WB 1 WB 2 NB 1 Volume Total Volume Left Volume Right 2 11 csh Volume to Capacity Queue Length 95th (m) Control Delay (s) Lane LOS A Approach Delay (s) Approach LOS A Average Delay. Intersection Capacity Utilization 43.6% ICU Level of Service A Analysis Period (min) 15 9/23/214
75 Timings 221 Total Traffic 6: Kennedy Cir. & L.St.Laurent Ave./L.St. Laurent Ave. AM Peak Hour Lane Group EBL EBT EBR WBL WBT WBR NBL NBT NBR SBL SBT SBR Volume (vph) Ideal Flow (vphpl) Storage Length (m) Storage Lanes Taper Length (m) Right Turn on Red Yes Yes Yes Yes Link Speed (k/h) Link Distance (m) Travel Time (s) Lane Group Flow (vph) Turn Type Perm NA Perm NA Perm NA Perm NA Protected Phases Permitted Phases Minimum Split (s) Total Split (s) Total Split (%) 63.3% 63.3% 63.3% 63.3% 36.7% 36.7% 36.7% 36.7% Yellow Time (s) All-Red Time (s) Lost Time Adjust (s) Total Lost Time (s) Lead/Lag Lead-Lag Optimize? v/c Ratio Control Delay Queue Delay Total Delay Queue Length 5th (m) Queue Length 95th (m) m Internal Link Dist (m) Turn Bay Length (m) Base Capacity (vph) Starvation Cap Reductn Spillback Cap Reductn Storage Cap Reductn Reduced v/c Ratio Area Type: Other Cycle Length: 6 Actuated Cycle Length: 6 Offset: (%), Referenced to phase 2:NBTL and 6:SBTL, Start of Green Natural Cycle: 55 Control Type: Pretimed m Volume for 95th percentile queue is metered by upstream signal. Splits and Phases: 6: Kennedy Cir. & L.St.Laurent Ave./L.St. Laurent Ave. 9/23/214
76 HCM Signalized Intersection Capacity Analysis 221 Total Traffic 6: Kennedy Cir. & L.St.Laurent Ave./L.St. Laurent Ave. AM Peak Hour Movement EBL EBT EBR WBL WBT WBR NBL NBT NBR SBL SBT SBR Volume (vph) Ideal Flow (vphpl) Total Lost time (s) Lane Util. Factor Frt Flt Protected Satd. Flow (prot) Flt Permitted Satd. Flow (perm) Peak-hour factor, PHF Adj. Flow (vph) RTOR Reduction (vph) Lane Group Flow (vph) Turn Type Perm NA Perm NA Perm NA Perm NA Protected Phases Permitted Phases Actuated Green, G (s) Effective Green, g (s) Actuated g/c Ratio Clearance Time (s) Lane Grp Cap (vph) v/s Ratio Prot c v/s Ratio Perm.1.2 c.1.2 v/c Ratio Uniform Delay, d Progression Factor Incremental Delay, d Delay (s) Level of Service A B B B C B B B Approach Delay (s) Approach LOS B B B B HCM 2 Control Delay 14.4 HCM 2 Level of Service B HCM 2 Volume to Capacity ratio.54 Actuated Cycle Length (s) 6. Sum of lost time (s) 12. Intersection Capacity Utilization 7.8% ICU Level of Service C Analysis Period (min) 15 c Critical Lane Group 9/23/214
77 HCM Unsignalized Intersection Capacity Analysis 221 Total Traffic 9: Kennedy Cir. & Front East AM Peak Hour Movement EBL EBR NBL NBT SBT SBR Volume (veh/h) Sign Control Stop Free Free Grade % % % Peak Hour Factor Hourly flow rate (vph) Pedestrians Lane Width (m) Walking Speed (m/s) Percent Blockage Right turn flare (veh) Median type None None Median storage veh) Upstream signal (m) 116 px, platoon unblocked vc, conflicting volume vc1, stage 1 conf vol vc2, stage 2 conf vol vcu, unblocked vol tc, single (s) tc, 2 stage (s) tf (s) p queue free % cm capacity (veh/h) Direction, Lane # EB 1 NB 1 SB 1 Volume Total Volume Left 1 1 Volume Right 26 csh Volume to Capacity.2..9 Queue Length 95th (m).4.. Control Delay (s) Lane LOS B A Approach Delay (s) Approach LOS B Average Delay.3 Intersection Capacity Utilization 26.7% ICU Level of Service A Analysis Period (min) 15 9/23/214
78 HCM Unsignalized Intersection Capacity Analysis 221 Total Traffic 11: Thompson Rd. & Front West AM Peak Hour Movement WBL WBR NBT NBR SBL SBT Volume (veh/h) Sign Control Stop Free Free Grade % % % Peak Hour Factor Hourly flow rate (vph) Pedestrians Lane Width (m) Walking Speed (m/s) Percent Blockage Right turn flare (veh) Median type None None Median storage veh) Upstream signal (m) 9 px, platoon unblocked.79 vc, conflicting volume vc1, stage 1 conf vol vc2, stage 2 conf vol vcu, unblocked vol tc, single (s) tc, 2 stage (s) tf (s) p queue free % cm capacity (veh/h) Direction, Lane # WB 1 NB 1 NB 2 SB 1 SB 2 SB 3 Volume Total Volume Left Volume Right csh Volume to Capacity Queue Length 95th (m) Control Delay (s) Lane LOS C A Approach Delay (s) Approach LOS C Average Delay.5 Intersection Capacity Utilization 34.8% ICU Level of Service A Analysis Period (min) 15 9/23/214
79 HCM Unsignalized Intersection Capacity Analysis 221 Total Traffic 13: Thompson Rd. & Condo West AM Peak Hour Movement WBL WBR NBT NBR SBL SBT Volume (veh/h) Sign Control Stop Free Free Grade % % % Peak Hour Factor Hourly flow rate (vph) Pedestrians Lane Width (m) Walking Speed (m/s) Percent Blockage Right turn flare (veh) Median type None None Median storage veh) Upstream signal (m) 149 px, platoon unblocked.8 vc, conflicting volume vc1, stage 1 conf vol vc2, stage 2 conf vol vcu, unblocked vol tc, single (s) tc, 2 stage (s) tf (s) p queue free % cm capacity (veh/h) Direction, Lane # WB 1 NB 1 NB 2 SB 1 SB 2 SB 3 Volume Total Volume Left Volume Right 49 8 csh Volume to Capacity Queue Length 95th (m) Control Delay (s) Lane LOS C A Approach Delay (s) Approach LOS C Average Delay.9 Intersection Capacity Utilization 35.2% ICU Level of Service A Analysis Period (min) 15 9/23/214
80 HCM Unsignalized Intersection Capacity Analysis 221 Total Traffic 15: Kennedy Cir. & Condo East AM Peak Hour Movement EBL EBR NBL NBT SBT SBR Volume (veh/h) Sign Control Stop Free Free Grade % % % Peak Hour Factor Hourly flow rate (vph) Pedestrians Lane Width (m) Walking Speed (m/s) Percent Blockage Right turn flare (veh) Median type None None Median storage veh) Upstream signal (m) 186 px, platoon unblocked vc, conflicting volume vc1, stage 1 conf vol vc2, stage 2 conf vol vcu, unblocked vol tc, single (s) tc, 2 stage (s) tf (s) p queue free % cm capacity (veh/h) Direction, Lane # EB 1 NB 1 SB 1 Volume Total Volume Left 48 4 Volume Right csh Volume to Capacity.9..8 Queue Length 95th (m) Control Delay (s) Lane LOS B A Approach Delay (s) Approach LOS B Average Delay 1.6 Intersection Capacity Utilization 26.8% ICU Level of Service A Analysis Period (min) 15 9/23/214
81 Timings 221 Total Traffic 2: Thompson Rd. & L.St.Laurent Ave./L.St. Laurent Ave. PM Peak Hour Lane Group EBL EBT EBR WBL WBT WBR NBL NBT NBR SBL SBT SBR Volume (vph) Ideal Flow (vphpl) Storage Length (m) Storage Lanes Taper Length (m) Right Turn on Red Yes Yes Yes Yes Link Speed (k/h) Link Distance (m) Travel Time (s) Lane Group Flow (vph) Turn Type pm+pt NA pm+pt NA pm+pt NA pm+pt NA Protected Phases Permitted Phases Minimum Split (s) Total Split (s) Total Split (%) 1.% 43.3% 1.8% 44.2% 15.% 34.2% 11.7% 3.8% Yellow Time (s) All-Red Time (s) Lost Time Adjust (s) Total Lost Time (s) Lead/Lag Lead Lag Lead Lag Lead Lag Lead Lag Lead-Lag Optimize? v/c Ratio Control Delay Queue Delay Total Delay Queue Length 5th (m) Queue Length 95th (m) #41.7 #198.4 m#64.3 #186.5 #94.1 #14.4 #78.6 #125.1 Internal Link Dist (m) Turn Bay Length (m) Base Capacity (vph) Starvation Cap Reductn Spillback Cap Reductn Storage Cap Reductn Reduced v/c Ratio Area Type: Other Cycle Length: 12 Actuated Cycle Length: 12 Offset: (%), Referenced to phase 2:NBTL and 6:SBTL, Start of Green Natural Cycle: 9 Control Type: Pretimed # 95th percentile volume exceeds capacity, queue may be longer. Queue shown is maximum after two cycles. m Volume for 95th percentile queue is metered by upstream signal. Splits and Phases: 2: Thompson Rd. & L.St.Laurent Ave./L.St. Laurent Ave. 9/23/214
82 HCM Signalized Intersection Capacity Analysis 221 Total Traffic 2: Thompson Rd. & L.St.Laurent Ave./L.St. Laurent Ave. PM Peak Hour Movement EBL EBT EBR WBL WBT WBR NBL NBT NBR SBL SBT SBR Volume (vph) Ideal Flow (vphpl) Total Lost time (s) Lane Util. Factor Frt Flt Protected Satd. Flow (prot) Flt Permitted Satd. Flow (perm) Peak-hour factor, PHF Adj. Flow (vph) RTOR Reduction (vph) Lane Group Flow (vph) Turn Type pm+pt NA pm+pt NA pm+pt NA pm+pt NA Protected Phases Permitted Phases Actuated Green, G (s) Effective Green, g (s) Actuated g/c Ratio Clearance Time (s) Lane Grp Cap (vph) v/s Ratio Prot.5.37 c.8.35 c v/s Ratio Perm.27 c.37 c v/c Ratio Uniform Delay, d Progression Factor Incremental Delay, d Delay (s) Level of Service D D F D E D E D Approach Delay (s) Approach LOS D E E E HCM 2 Control Delay 55.3 HCM 2 Level of Service E HCM 2 Volume to Capacity ratio.97 Actuated Cycle Length (s) 12. Sum of lost time (s) 18. Intersection Capacity Utilization 11.8% ICU Level of Service G Analysis Period (min) 15 c Critical Lane Group 9/23/214
83 HCM Unsignalized Intersection Capacity Analysis 221 Total Traffic 4: Site RIRO & L.St. Laurent Ave./L.St.Laurent Ave. PM Peak Hour Movement EBT EBR WBL WBT NBL NBR Volume (veh/h) Sign Control Free Free Stop Grade % % % Peak Hour Factor Hourly flow rate (vph) Pedestrians Lane Width (m) Walking Speed (m/s) Percent Blockage Right turn flare (veh) Median type None None Median storage veh) Upstream signal (m) px, platoon unblocked vc, conflicting volume vc1, stage 1 conf vol vc2, stage 2 conf vol vcu, unblocked vol tc, single (s) tc, 2 stage (s) tf (s) p queue free % cm capacity (veh/h) Direction, Lane # EB 1 EB 2 WB 1 WB 2 NB 1 Volume Total Volume Left Volume Right 5 52 csh Volume to Capacity Queue Length 95th (m) Control Delay (s) Lane LOS B Approach Delay (s) Approach LOS B Average Delay.2 Intersection Capacity Utilization 48.6% ICU Level of Service A Analysis Period (min) 15 9/23/214
84 Timings 221 Total Traffic 6: Kennedy Cir. & L.St.Laurent Ave./L.St. Laurent Ave. PM Peak Hour Lane Group EBL EBT EBR WBL WBT WBR NBL NBT NBR SBL SBT SBR Volume (vph) Ideal Flow (vphpl) Storage Length (m) Storage Lanes Taper Length (m) Right Turn on Red Yes Yes Yes Yes Link Speed (k/h) Link Distance (m) Travel Time (s) Lane Group Flow (vph) Turn Type Perm NA pm+pt NA Perm NA Perm NA Protected Phases Permitted Phases Minimum Split (s) Total Split (s) Total Split (%) 5.% 5.% 13.3% 63.3% 36.7% 36.7% 36.7% 36.7% Yellow Time (s) All-Red Time (s) Lost Time Adjust (s) Total Lost Time (s) Lead/Lag Lag Lag Lead Lead-Lag Optimize? v/c Ratio Control Delay Queue Delay Total Delay Queue Length 5th (m) Queue Length 95th (m) m1.8 m# Internal Link Dist (m) Turn Bay Length (m) Base Capacity (vph) Starvation Cap Reductn Spillback Cap Reductn Storage Cap Reductn Reduced v/c Ratio Area Type: Other Cycle Length: 6 Actuated Cycle Length: 6 Offset: (%), Referenced to phase 2:NBTL and 6:SBTL, Start of Green Natural Cycle: 65 Control Type: Pretimed # 95th percentile volume exceeds capacity, queue may be longer. Queue shown is maximum after two cycles. m Volume for 95th percentile queue is metered by upstream signal. Splits and Phases: 6: Kennedy Cir. & L.St.Laurent Ave./L.St. Laurent Ave. 9/23/214
85 HCM Signalized Intersection Capacity Analysis 221 Total Traffic 6: Kennedy Cir. & L.St.Laurent Ave./L.St. Laurent Ave. PM Peak Hour Movement EBL EBT EBR WBL WBT WBR NBL NBT NBR SBL SBT SBR Volume (vph) Ideal Flow (vphpl) Total Lost time (s) Lane Util. Factor Frt Flt Protected Satd. Flow (prot) Flt Permitted Satd. Flow (perm) Peak-hour factor, PHF Adj. Flow (vph) RTOR Reduction (vph) Lane Group Flow (vph) Turn Type Perm NA pm+pt NA Perm NA Perm NA Protected Phases Permitted Phases Actuated Green, G (s) Effective Green, g (s) Actuated g/c Ratio Clearance Time (s) Lane Grp Cap (vph) v/s Ratio Prot c.39.4 c v/s Ratio Perm.6.21 c.9.2 v/c Ratio Uniform Delay, d Progression Factor Incremental Delay, d Delay (s) Level of Service B D B B C B B B Approach Delay (s) Approach LOS D B B B HCM 2 Control Delay 24.2 HCM 2 Level of Service C HCM 2 Volume to Capacity ratio.72 Actuated Cycle Length (s) 6. Sum of lost time (s) 15. Intersection Capacity Utilization 74.7% ICU Level of Service D Analysis Period (min) 15 c Critical Lane Group 9/23/214
86 HCM Unsignalized Intersection Capacity Analysis 221 Total Traffic 9: Kennedy Cir. & Front East PM Peak Hour Movement EBL EBR NBL NBT SBT SBR Volume (veh/h) Sign Control Stop Free Free Grade % % % Peak Hour Factor Hourly flow rate (vph) Pedestrians Lane Width (m) Walking Speed (m/s) Percent Blockage Right turn flare (veh) Median type None None Median storage veh) Upstream signal (m) 116 px, platoon unblocked vc, conflicting volume vc1, stage 1 conf vol vc2, stage 2 conf vol vcu, unblocked vol tc, single (s) tc, 2 stage (s) tf (s) p queue free % cm capacity (veh/h) Direction, Lane # EB 1 NB 1 SB 1 Volume Total Volume Left 17 8 Volume Right 4 4 csh Volume to Capacity Queue Length 95th (m) Control Delay (s) Lane LOS B A Approach Delay (s) Approach LOS B Average Delay.6 Intersection Capacity Utilization 28.7% ICU Level of Service A Analysis Period (min) 15 9/23/214
87 HCM Unsignalized Intersection Capacity Analysis 221 Total Traffic 11: Thompson Rd. & Front West PM Peak Hour Movement WBL WBR NBT NBR SBL SBT Volume (veh/h) Sign Control Stop Free Free Grade % % % Peak Hour Factor Hourly flow rate (vph) Pedestrians Lane Width (m) Walking Speed (m/s) Percent Blockage Right turn flare (veh) Median type None None Median storage veh) Upstream signal (m) 9 px, platoon unblocked.8 vc, conflicting volume vc1, stage 1 conf vol vc2, stage 2 conf vol vcu, unblocked vol tc, single (s) tc, 2 stage (s) tf (s) p queue free % cm capacity (veh/h) Direction, Lane # WB 1 NB 1 NB 2 SB 1 SB 2 SB 3 Volume Total Volume Left Volume Right csh Volume to Capacity Queue Length 95th (m) Control Delay (s) Lane LOS F B Approach Delay (s) Approach LOS F Average Delay 13.8 Intersection Capacity Utilization 6.6% ICU Level of Service B Analysis Period (min) 15 9/23/214
88 HCM Unsignalized Intersection Capacity Analysis 221 Total Traffic 13: Thompson Rd. & Condo West PM Peak Hour Movement WBL WBR NBT NBR SBL SBT Volume (veh/h) Sign Control Stop Free Free Grade % % % Peak Hour Factor Hourly flow rate (vph) Pedestrians Lane Width (m) Walking Speed (m/s) Percent Blockage Right turn flare (veh) Median type None None Median storage veh) Upstream signal (m) 149 px, platoon unblocked.82 vc, conflicting volume vc1, stage 1 conf vol vc2, stage 2 conf vol vcu, unblocked vol tc, single (s) tc, 2 stage (s) tf (s) p queue free % cm capacity (veh/h) Direction, Lane # WB 1 NB 1 NB 2 SB 1 SB 2 SB 3 Volume Total Volume Left Volume Right csh Volume to Capacity Queue Length 95th (m) Control Delay (s) Lane LOS D B Approach Delay (s) Approach LOS D Average Delay.8 Intersection Capacity Utilization 47.4% ICU Level of Service A Analysis Period (min) 15 9/23/214
89 HCM Unsignalized Intersection Capacity Analysis 221 Total Traffic 15: Kennedy Cir. & Condo East PM Peak Hour Movement EBL EBR NBL NBT SBT SBR Volume (veh/h) Sign Control Stop Free Free Grade % % % Peak Hour Factor Hourly flow rate (vph) Pedestrians Lane Width (m) Walking Speed (m/s) Percent Blockage Right turn flare (veh) Median type None None Median storage veh) Upstream signal (m) 186 px, platoon unblocked vc, conflicting volume vc1, stage 1 conf vol vc2, stage 2 conf vol vcu, unblocked vol tc, single (s) tc, 2 stage (s) tf (s) p queue free % cm capacity (veh/h) Direction, Lane # EB 1 NB 1 SB 1 Volume Total Volume Left Volume Right 7 47 csh Volume to Capacity Queue Length 95th (m) Control Delay (s) Lane LOS B A Approach Delay (s) Approach LOS B Average Delay.9 Intersection Capacity Utilization 32.4% ICU Level of Service A Analysis Period (min) 15 9/23/214
90 675 Millcreek Drive Unit 1 Mississauga ON L5N 5M4 T: F: E: mississauga@ghd.com 214 This document is and shall remain the property of. The document may only be used for the purpose for which it was commissioned and in accordance with the Terms of Engagement for the commission. Unauthorised use of this document in any form whatsoever is prohibited. Document Status Rev No. Author Reviewer Approved for Issue Name Signature Name Signature Date M. Dowdall W. Kay W. Maria Aug. 214

91
INDUSTRIAL BUILDING 3009 HAWTHORNE ROAD CITY OF OTTAWA TRANSPORTATION OVERVIEW REVISED. Prepared for: Canada Inc.
 INDUSTRIAL BUILDING 3009 HAWTHORNE ROAD CITY OF OTTAWA TRANSPORTATION OVERVIEW REVISED Prepared for: 7849648 Canada Inc. Octiober 1, 2015 114-598 Overview_2.doc D. J. Halpenny & Associates Ltd. Consulting
TRAFFIC IMPACT STUDY
 675 Millcreek Drive, Unit 1 Mississauga, Ontario L5N 5M4 T: 416.213.7121 F: 95.89.8499 www.transtech.co TRAFFIC IMPACT STUDY PROPOSED MOSQUE DEVELOPMENT 4269 REGIONAL ROAD 25 TOWN OF OAKVILLE PREPARED
The proposed development is located within 800m of an existing Transit Station where infill developments and intensification are encouraged.
 Stantec Consulting Ltd. 1331 Clyde Avenue, Suite 4 Ottawa ON K2C 3G4 Tel: (613) 722-442 Fax: (613) 722-2799 May 14, 213 File: 1638823 Robinson Park Development Corp. 5699 Power Road Ottawa, ON, K1G 3N4
TRANSPORTATION IMPACT STUDY
 Dundas MEP Developments Inc. City of Toronto 219 and 231 Dundas Street East, Proposed Mixed-Use Development TRANSPORTATION IMPACT STUDY 9782/2 April 216 LEA Consulting Ltd. Consulting Engineers & Planners
9 Leeming Drive Redevelopment Ottawa, ON Transportation Brief. Prepared By: Stantec Consulting Ltd.
 9 Leeming Drive Redevelopment Ottawa, ON Transportation Brief Prepared By: Stantec Consulting Ltd. TIA GUIDELINES CHECKLIST Report Context Municipal Address Comment: Section 1.1 Location relative to major
Bistro 6. City of Barrie. Traffic Impact Study for Pratt Hansen Group Inc. Type of Document: Final Report. Project Number: JDE 1748
 City of Barrie Traffic Impact Study for Pratt Hansen Group Inc. Type of Document: Final Report Project Number: JDE 1748 Date Submitted: June 12 th, 2017 06/12/17 John Northcote, P.Eng. Professional License
OTTAWA TRAIN YARDS PHASE 3 DEVELOPMENT CITY OF OTTAWA TRANSPORTATION IMPACT STUDY. Prepared for:
 OTTAWA TRAIN YARDS PHASE 3 DEVELOPMENT CITY OF OTTAWA TRANSPORTATION IMPACT STUDY Prepared for: The Ottawa Train Yards Inc. 223 Colonnade Road South, Suite 212 Nepean, Ontario K2E 7K3 January 17, 2012
2136 And 2148 Trafalgar Road Townhouse Development Traffic Brief. Paradigm Transportation Solutions Limited
 2136 And 2148 Trafalgar Road Townhouse Development Traffic Brief Paradigm Transportation Solutions Limited March 217 March 217 Project: 1627 Diana Vlasic, M.C.I.P., R.P.P Metropolitan Consulting 445 Paletta
MEETING FACILITY 2901 GIBFORD DRIVE CITY OF OTTAWA TRANSPORTATION BRIEF. Prepared for: Holiday Inn Express 2881 Gibford Drive Ottawa, ON K1V 2L9
 MEETING FACILITY 2901 GIBFORD DRIVE CITY OF OTTAWA TRANSPORTATION BRIEF Prepared for: Holiday Inn Express 2881 Gibford Drive Ottawa, ON K1V 2L9 December 18, 2012 112-566 Brief_1.doc D. J. Halpenny & Associates
OFFICE/RETAIL DEVELOPMENT 1625 BANK STREET OTTAWA, ONTARIO TRANSPORTATION BRIEF. Prepared for: Canada Inc.
 OFFICE/RETAIL DEVELOPMENT 1625 BANK STREET OTTAWA, ONTARIO TRANSPORTATION BRIEF Prepared for: 9402209 Canada Inc. December 15, 2015 115-625 Report_2.doc D. J. Halpenny & Associates Ltd. Consulting Transportation
NEW YORK CENTRAL PARK SUBDIVISION BLAIS STREET/ST-PIERRE STREET EMBRUN, ONTARIO TRAFFIC IMPACT STUDY. Prepared for:
 NEW YORK CENTRAL PARK SUBDIVISION BLAIS STREET/ST-PIERRE STREET EMBRUN, ONTARIO TRAFFIC IMPACT STUDY Prepared for: Solidex Holdings Limited & Investissement Maurice Lemieux Investments Attn: Mr. Anthony
VIVA RETIREMENT COMMUNITIES OAKVILLE TRAFFIC IMPACT STUDY
 VIVA RETIREMENT COMMUNITIES OAKVILLE TRAFFIC IMPACT STUDY VIVA RETIREMENT COMMUNITIES OAKVILLE TRAFFIC IMPACT STUDY DECEMBER 2012 READ, VOORHEES & ASSOCIATES TORONTO, ONTARIO Read, Voorhees & Associates
Traffic Impact Analysis Chatham County Grocery Chatham County, NC
 Chatham County Grocery Chatham County, NC TABLE OF CONTENTS 1. INTRODUCTION... 1 1.1. Location and Study Area... 1 1.2. Proposed Land Use and Access... 2 1.3. Adjacent Land Uses... 2 1.4. Existing ways...
REDEVELOPMENT TRAFFIC IMPACT STUDY
 REDEVELOPMENT TRAFFIC IMPACT STUDY For Wendy s Parker, Colorado January 215 Prepared for: Sterling Design Associates, LLC 29 W. Littleton Boulevard #3 Littleton, Colorado 812 Prepared by: 1233 Airport
INDUSTRIAL BUILDING 1660 COMSTOCK ROAD CITY OF OTTAWA TRANSPORTATION OVERVIEW. Prepared for:
 INDUSTRIAL BUILDING 1660 COMSTOCK ROAD CITY OF OTTAWA TRANSPORTATION OVERVIEW Prepared for: Simluc Contractors Limited 2550 Blackwell Street, Ottawa K1B 5R1 October 18, 2013 113-584 Overview_1.doc D. J.
URBAN QUARRY HEADQUARTERS 2717 STEVENAGE DRIVE CITY OF OTTAWA TRANSPORTATION OVERVIEW. Prepared for: Urban Quarry 4123 Belgreen Drive, Ottawa K1G 3N2
 URBAN QUARRY HEADQUARTERS 2717 STEVENAGE DRIVE CITY OF OTTAWA TRANSPORTATION OVERVIEW Prepared for: Urban Quarry 4123 Belgreen Drive, Ottawa K1G 3N2 February 27, 2014 113-584 Overview_1.doc D. J. Halpenny
84-88 Columbia Street West Waterloo, Ontario Transportation Impact Study. Paradigm Transportation Solutions Limited
 84-88 Columbia Street West Waterloo, Ontario Transportation Impact Study Paradigm Transportation Solutions Limited June 217 Project Summary Project Number 15255 June 217 Client Masri O Inc. Architects
EXECUTIVE SUMMARY. Page 1 of 6
 EXECUTIVE SUMMARY The purpose of this report is to identify conformance with the original traffic impact study for the proposed retail development on Lot 5 of Riverdale Retail Filing No. 1 located on the
South Street Campus Lands Development. City of London TRANSPORTATION IMPACT ASSESSMENT
 South Street Campus Lands Development City of London TRANSPORTATION IMPACT ASSESSMENT TW1387 South Street Campus Lands Development City of London TRANSPORTATION IMPACT ASSESSMENT May 2013 South Street
COMMERCIAL DEVELOPMENT 2015 ROBERTSON ROAD OTTAWA, ONTARIO TRANSPORTATION BRIEF. Prepared for:
 COMMERCIAL DEVELOPMENT 2015 ROBERTSON ROAD OTTAWA, ONTARIO TRANSPORTATION BRIEF Prepared for: First Bay Properties Inc. 311 Richmond Road, Suite 203 Ottawa, ON K1Z 6X3 August 8, 2017 117-663 Brief_1.doc
APARTMENT BUILDING DEVELOPMENT 1161 HERON ROAD OTTAWA, ONTARIO TRANSPORTATION IMPACT STUDY. Prepared for:
 APARTMENT BUILDING DEVELOPMENT 1161 HERON ROAD OTTAWA, ONTARIO TRANSPORTATION IMPACT STUDY Prepared for: 1649362 Ontario Inc. c/o Manor Park Management 231 Brittany Drive, Suite D Ottawa ON K1K 0R8 July
James M. Moore, Director of Planning & Building Services, Town of Fairfax. Victory Village Senior Housing Development Traffic Study
 Traffic Study To: From: James M. Moore, Director of Planning & Building Services, Town of Fairfax David Parisi, PE, TE, Parisi Transportation Consulting Date: October 14, 216 Subject: Victory Village Senior
Traffic Impact Study. Roderick Place Columbia Pike Thompson s Station, TN. Transportation Group, LLC Traffic Engineering and Planning
 F i s c h b a c h Transportation Group, LLC Traffic Engineering and Planning Traffic Impact Study Roderick Place Columbia Pike Thompson s Station, TN Prepared March 2016 Ms. Gillian L. Fischbach, P.E.,
AMEC Earth and Environmental. Bovaird Drive Environmental Assessment. Traffic Study Final Report. August Excellence in Transportation Planning
 AMEC Earth and Environmental Bovaird Drive Environmental Assessment Traffic Study Final Report August Excellence in Transportation Planning AMEC Earth and Environmental Bovaird Drive Class EA Traffic
5858 N COLLEGE, LLC N College Avenue Traffic Impact Study
 5858 N COLLEGE, LLC nue Traffic Impact Study August 22, 2016 Contents Traffic Impact Study Page Preparer Qualifications... 1 Introduction... 2 Existing Roadway Conditions... 5 Existing Traffic Conditions...
Place Vanier 250 Montreal Road Transportation Impact Study Addendum. Prepared for Broccolini Construction September 20 th, 2012
 Update for the May 31 st, 2012 Traffic Impact Study Prepared for Broccolini Construction 111-23596-00 September 20 th, 2012 2611 Queensview Drive, Suite 300, Ottawa, Ontario CANADA K2B 8K2 Telephone: 613-829-2800
Traffic Impact Analysis Walton Acres at Riverwood Athletic Club Clayton, NC
 Traffic Impact Analysis Walton Acres at Riverwood Athletic Club Clayton, NC 1. TABLE OF CONTENTS INTRODUCTION...1 1.1. Site Location and Study Area...1 1.2. Proposed Land Use and Site Access...2 1.3.
Traffic Impact Study WestBranch Residential Development Davidson, NC March 2016
 Traffic Impact Study WestBranch Residential Development Davidson, NC March 216 TRAFFIC IMPACT STUDY FOR THE WestBranch Residential Development LOCATED IN DAVIDSON, NC Prepared For: Lennar Carolinas, LLC
ORLEANS GARDENS SHOPPING CENTRE 1615 ORLEANS BOULEVARD CITY OF OTTAWA, ONTARIO TRANSPORTATION IMPACT STUDY. Prepared for:
 ORLEANS GARDENS SHOPPING CENTRE 1615 ORLEANS BOULEVARD CITY OF OTTAWA, ONTARIO TRANSPORTATION IMPACT STUDY Prepared for: Orleans Gardens Shopping Centre Inc. 2851 John Street, Suite 1 Markham, ON K3R 5R7
HENDERSON DEVELOPMENT 213, 217, 221, 221 ½, 223 HENDERSON AVENUE and 65 TEMPLETON STREET OTTAWA, ONTARIO TRANSPORTATION OVERVIEW.
 HENDERSON DEVELOPMENT 213, 217, 221, 221 ½, 223 HENDERSON AVENUE and 65 TEMPLETON STREET OTTAWA, ONTARIO TRANSPORTATION OVERVIEW Prepared for: 2294170 Ontario Inc. February 2, 2017 117-652 Report_1.doc
Corporation of the Town of Oakville. December 16, 2013
 Corporation of the Town of Oakville Transportation Impact Analysis and Parking Study for Proposed Secondary School, Oakville Draft Final Report Submitted by: HDR Corporation 100 York Boulevard, Suite 300
HOLIDAY INN HOTEL 235 KING EDWARD AVENUE CITY OF OTTAWA TRANSPORTATION BRIEF. Prepared for:
 HOLIDAY INN HOTEL 235 KING EDWARD AVENUE CITY OF OTTAWA TRANSPORTATION BRIEF Prepared for: Momentum Planning & Communications 1165 Greenlawn Crescent Ottawa, ON K1L 6C2 June 29, 2015 115-618 Brief_1.doc
Henderson Avenue Mixed-Use Development
 Zoning Case: Z145-3 Traffic Impact Analysis Henderson Avenue Mixed-Use Development Dallas, TX October 26 th, 216 Kimley-Horn and Associates, Inc. Dallas, Texas Project #644827 Registered Firm F-928 Traffic
QUICKIE C STORE AND GAS BAR 1780 HERON ROAD OTTAWA, ONTARIO TRANSPORTATION BRIEF. Prepared for:
 QUICKIE C STORE AND GAS BAR 1780 HERON ROAD OTTAWA, ONTARIO TRANSPORTATION BRIEF Prepared for: Quickie Convenience Stores Larny Holdings Ltd. c/o PBC Group April 15, 2015 115-615 Report_1.doc D. J. Halpenny
3.2.2 Proposed Road Network within Phase 1B Lands
 3.2.2 Proposed Road Network within Phase 1B Lands Figure 3.1 also shows the proposed road network within the Premier Gateway Phase 1B Employment Area lands, which features two collector roads providing
HILTON GARDEN INN HOTEL HOTEL EXPANSION 2400 ALERT ROAD, OTTAWA TRANSPORTATION BRIEF. Prepared for:
 HILTON GARDEN INN HOTEL HOTEL EXPANSION 2400 ALERT ROAD, OTTAWA TRANSPORTATION BRIEF Prepared for: Bona Building & Management Co. Ltd. Place Vanier, 333 North River Road Vanier, Ontario K1L 8B9 October
Draft Report. Traffic Impact Study. Superstore, Wal-Mart, and Kent Development. Yarmouth, Nova Scotia. Prepared for
 oad & Traffic Management Road & Traffic Management R Atlantic Traffic Engineering Specialists Draft Report Traffic Impact Study Superstore, Wal-Mart, and Kent Development Yarmouth, Nova Scotia Prepared
APPENDIX H EXISTING TRAFFIC CONDITIONS ANALYSIS
 APPENDIX H EXISTING TRAFFIC CONDITIONS ANALYSIS MEMO : Peter Steacy, P.Eng. Date: December 3, 2014 : Ian Borsuk, P.Eng. Job No.: 3414015-000 Subject: City of Ottawa O-Train Extension Planning & EA Study
TRAFFIC ASSESSMENT River Edge Colorado
 TRAFFIC ASSESSMENT River Edge Colorado Submitted by: Fehr & Peers 621 17th Street, Ste. 231 Denver, CO 8293 (33) 296-43 December, 21 App. M-2 Traffic Assessment River Edge Colorado December 21 TABLE OF
Walmart (Store # ) 60 th Street North and Marion Road Sioux Falls, South Dakota
 60 th Street North and Marion Road Sioux Falls, South Dakota") Walmart (Store #4865-00) 60 th Street North and Marion Road Sioux Falls, South Dakota Prepared for: Wal-Mart Stores, Inc. Bentonville, Arkansas Prepared by: Kimley-Horn and Associates, Inc. ã2013 Kimley-Horn
Walmart (Store #4865-00) 60 th Street North and Marion Road Sioux Falls, South Dakota Prepared for: Wal-Mart Stores, Inc. Bentonville, Arkansas Prepared by: Kimley-Horn and Associates, Inc. ã2013 Kimley-Horn
DUNBOW ROAD FUNCTIONAL PLANNING
 DUNBOW ROAD FUNCTIONAL PLANNING Final Report August 3, 216 #31, 316 5th Avenue NE Calgary, AB T2A 6K4 Phone: 43.273.91 Fax: 43.273.344 wattconsultinggroup.com Dunbow Road Functional Planning Final Report
MEDICAL/OFFICE BUILDING 1637 BANK STREET OTTAWA, ONTARIO TRANSPORTATION OVERVIEW. Prepared for:
 MEDICAL/OFFICE BUILDING 1637 BANK STREET OTTAWA, ONTARIO TRANSPORTATION OVERVIEW Prepared for: 2434984 Ontario Inc. 13-5510 Canotek Road Ottawa, Ontario K1J 9J5 June 4, 2015 115-613 Report_2.doc D. J.
St. Stefan Serbian Orthodox Church 1989 and 1993 Prince of Wales Drive, Ottawa REVISED TRANSPORTATION BRIEF
 St. Stefan Serbian Orthodox Church 1989 and 1993 Prince of Wales Drive, Ottawa REVISED TRANSPORTATION BRIEF Prepared By: NOVATECH ENGINEERING CONSULTANTS LTD. Suite 200, 240 Michael Cowpland Drive Ottawa,
1609 E. FRANKLIN STREET HOTEL TRAFFIC IMPACT STUDY EXECUTIVE SUMMARY
 1609 E. FRANKLIN STREET HOTEL TRAFFIC IMPACT STUDY EXECUTIVE SUMMARY Prepared for: The Town of Chapel Hill Public Works Department Traffic Engineering Division Prepared by: HNTB North Carolina, PC 343
TRANSPORTATION ANALYSIS REPORT US Route 6 Huron, Erie County, Ohio
 TRANSPORTATION ANALYSIS REPORT US Route 6 Huron, Erie County, Ohio December 12, 2012 Prepared for: The City of Huron 417 Main Huron, OH 44839 Providing Practical Experience Technical Excellence and Client
Kanata North Catholic Elementary School
 December 216 Kanata North Catholic Elementary School Transportation Brief SITE Potential Future Development Trillium Woods Prepared for: Bryden Martel Architects Inc Prepared by: KANATA NORTH CATHOLIC
Proposed Addition to Pickering Islamic Centre
 TRAFFIC IMPACT STUDY, PARKING STUDY, SITE CIRCULATION REVIEW & TDM PLAN Proposed Addition to Pickering Islamic Centre 265 Brock Road City of Pickering, Ontario Prepared for: Pickering Islamic Centre Masjid
THIS PAGE LEFT BLANK INTENTIONALLY
 GA SR 25 Spur at Canal Road Transportation Impact Analysis PREPARED FOR GLYNN COUNTY, GEORGIA 1725 Reynolds Street, Suite 300 Brunswick, Georgia 31520 PREPARED BY 217 Arrowhead Boulevard Suite 26 Jonesboro,
Harrah s Station Square Casino
 Transportation Analysis Harrah s Station Square Casino Pittsburgh, Pennsylvania Submitted To: City of Pittsburgh and Pennsylvania Gaming Control Board Prepared By: DKS Associates GAI Consultants December
Marina Loft (DRC 51-R-12)
") Marina Loft (DRC 51-R-12) traffic study prepared for: Cymbal Development OCtober 2012 Traf Tech October 1, 2012 Mr. Asi Cymbal - President Cymbal Development 3470 North Miami Avenue Upper Suite Miami,
Marina Loft (DRC 51-R-12) traffic study prepared for: Cymbal Development OCtober 2012 Traf Tech October 1, 2012 Mr. Asi Cymbal - President Cymbal Development 3470 North Miami Avenue Upper Suite Miami,
FAIRFIELD INN & SUITES HOTEL 135 THAD JOHNSON PRIVATE OTTAWA TRANSPORTATION BRIEF. Prepared for:
 FAIRFIELD INN & SUITES HOTEL 135 THAD JOHNSON PRIVATE OTTAWA TRANSPORTATION BRIEF Prepared for: Bona Building & Management Co. Ltd. Place Vanier, 333 North River Road Vanier, Ontario K1L 8B9 August 12,
FAIRFIELD - RYAN S CORNER TRAFFIC IMPACT ANALYSIS LOUDOUN COUNTY, VIRGINIA
 FAIRFIELD - RYAN S CORNER TRAFFIC IMPACT ANALYSIS LOUDOUN COUNTY, VIRGINIA Submitted on behalf of: Fairfield Residential Prepared by: Wells + Associates, Inc. 1420 Spring Hill Road, Suite 00 McLean, Virginia
South Albion-Bolton Community Plan North Hill Supermarket Transportation Study Part B: Evaluation of Alternatives
 Community Plan North Hill Supermarket Transportation Study Part B: Evaluation of Alternatives Prepared for: The Town of Caledon August 9 Transportation Solutions Ltd. 43 Forest Road Cambridge, ON N1S 3B4
Traffic Impact Study. Crestline Piggly Wiggly Mountain Brook, Alabama. Goodwyn, Mills and Cawood, Inc. Birmingham, Alabama.
 Traffic Impact Study Crestline Piggly Wiggly Mountain Brook, Alabama Prepared for: Goodwyn, Mills and Cawood, Inc. Birmingham, Alabama September 214 Revision 1 October 214 Crestline Piggly Wiggly Mountain
Subject: Solberg Avenue / I-229 Grade Separation: Traffic Analysis
 MEMORANDUM Transportation Bill Troe, AICP Jason Carbee, AICP 12120 Shamrock Plaza Suite 300 Omaha, NE 68154 (402) 334-8181 (402) 334-1984 (Fax) To: Project File Date: Subject: Solberg Avenue / I-229 Grade
Transportation Impact Study for Abington Terrace
 Transportation Impact Study for Abington Terrace Abington Township, Montgomery County, PA Sandy A. Koza, P.E., PTOE PA PE License Number PE059911 Prepared by McMahon Associates, Inc. 425 Commerce Drive,
William Jackson Drive & Earl Grey Avenue, Pickering, ON Transportation Study. Trillium Housing Oak Non-Profit Corp.
 William Jackson Drive & Earl Grey Avenue, Pickering, ON Transportation Study Trillium Housing Oak Non-Profit Corp. R.J. Burnside & Associates Limited 1465 Pickering Parkway Suite 2 Pickering ON L1V 7G7
192 & 196 Bronson Avenue / 31 Cambridge Street
 Bronson Inc. July 213 192 & 196 Bronson Avenue / 31 Cambridge Street TRANSPORTATION BRIEF Prepared by: Study 192 Bronson Type Avenue July 213 Study Transportation Name Brief February 211 TB Check List
Highway 111 Corridor Study
 Highway 111 Corridor Study June, 2009 LINCOLN CO. HWY 111 CORRIDOR STUDY Draft Study Tea, South Dakota Prepared for City of Tea Sioux Falls Metropolitan Planning Organization Prepared by HDR Engineering,
BLUE SEA VILLAGE MER BLEUE 2159 MER BLEUE ROAD OTTAWA, ONTARIO TRANSPORTATION IMPACT ASSESSMENT. Prepared for: Ontario Limited.
 BLUE SEA VILLAGE MER BLEUE 2159 MER BLEUE ROAD OTTAWA, ONTARIO TRANSPORTATION IMPACT ASSESSMENT Prepared for: 2534189 Ontario Limited April 6, 2018 117-668 TIA Report_2.doc D. J. Halpenny & Associates
PRELIMINARY DRAFT WADDLE ROAD / I-99 INTERCHANGE PROJECT ALTERNATIVE ANALYSIS FINAL TRAFFIC SUMMARY REPORT
 PRELIMINARY DRAFT WADDLE ROAD / I-99 INTERCHANGE PROJECT ALTERNATIVE ANALYSIS FINAL TRAFFIC SUMMARY REPORT Prepared by: In Association with: November 2013 EXECUTIVE SUMMARY Patton Township, in partnership
Student Housing Development
 Traffic Impact Study for the proposed Student Housing Development City of Oneonta Otsego County, New York Project No. 3259 December 212 Revised February 13, 212 Prepared For: Newman Development Group,
APPENDIX D Traffic Impact Study (Draft Report)
") ENVIRONMENTAL IMPACT ASSESSMENT (EIA) REGISTRATION, TRAFFIC IMPACT STUDY (DRAFT REPORT), AND WATER SUPPLY SOURCE ASSESSMENT (WSSA): CAMPING PLAGE ABOITEAU BEACH, CAP-PELÉ, NB APPENDIX D (Draft Report)
ENVIRONMENTAL IMPACT ASSESSMENT (EIA) REGISTRATION, TRAFFIC IMPACT STUDY (DRAFT REPORT), AND WATER SUPPLY SOURCE ASSESSMENT (WSSA): CAMPING PLAGE ABOITEAU BEACH, CAP-PELÉ, NB APPENDIX D (Draft Report)
Appendix C. NORTH METRO STATION AREA TRAFFIC IMPACT STATEMENT 88th Avenue Station
 Appendix C NORTH METRO STATION AREA TRAFFIC IMPACT STATEMENT 88th Avenue Station Prepared for: Regional Transportation Department and URS Corporation as part of the North Metro EIS David Evans and Associates,
Traffic Impact Study. Westlake Elementary School Westlake, Ohio. TMS Engineers, Inc. June 5, 2017
 TMS Engineers, Inc. Traffic Impact Study Westlake Elementary School Westlake, Ohio June 5, 2017 Prepared for: Westlake City Schools - Board of Education 27200 Hilliard Boulevard Westlake, OH 44145 TRAFFIC
Premier Gateway Phase 1B Employment Area Secondary Plan Transportation Study. Paradigm Transportation Solutions Limited
 Premier Gateway Phase 1B Employment Area Secondary Plan Transportation Study Paradigm Transportation Solutions Limited July 217 Project Summary Project Number 177 July 217 Client Town of Halton Hills
George Street Transportation Impact Study. Paradigm Transportation Solutions Limited
 George Transportation Impact Study Paradigm Transportation Solutions Limited January 217 Project Summary Project Number 16191 January 217 Client Wastell Homes 5-1895 Blue Heron Drive London ON N6H 5L9
Prepared For: Shieldbay Developments Inc. c/o Matson, McConnell Ltd. 2430A Bloor Street West Toronto, Ontario M6S 1P9.
 Prepared For: Shieldbay Developments Inc. c/o Matson, McConnell Ltd. 2430A Bloor Street West Toronto, Ontario M6S 1P9 Prepared By: URS Canada Inc. 4 th Floor, 30 Leek Crescent Richmond Hill, Ontario L4B
Traffic Circulation Study for Neighborhood Southwest of Mockingbird Lane and Airline Road, Highland Park, Texas
 ARIZONA TEXAS NEW MEXICO OKLAHOMA February 13, 2015 Mr. Meran Dadgostar P.E., R.S. Town of Highland Park 4700 Drexel Dr. Highland Park, Texas 75205 Re: Traffic Circulation Study for Neighborhood Southwest
Road Conversion Study Plumas Street
 Plumas Street Phase I Submitted to The Regional Transportation Commission of Washoe County Submitted by Zong Tian, Ph.D., P.E. Saeedeh Farivar Haiyuan Li, Ph.D. Center for Advanced Transportation Education
Patuxent Green Golf Course
 Patuxent Green Golf Course Laurel, Maryland February 23, 2018 Traffic Impact Analysis Prepared for: ADC Builders Alan Cohen 2701 Tower Oaks Boulevard, Suite 200 Rockville, Maryland 20852 TABLE OF CONTENTS
Shockoe Bottom Preliminary Traffic and Parking Analysis
 Shockoe Bottom Preliminary Traffic and Parking Analysis Richmond, Virginia August 14, 2013 Prepared For City of Richmond Department of Public Works Prepared By 1001 Boulders Pkwy Suite 300, Richmond, VA
Traffic Impact Study Little Egypt Road Development Denver, North Carolina June 2017
 Traffic Impact Study Little Egypt Road Development Denver, North arolina June 2017 N. Little Egypt Road DQ\ QDQFLQJ VDOHV RU RWKHU SHUIRUPDQFH EDVHG FULWHULD Proposed Site Driveways Site Driveway 1 TRAFFI
Project Niagara. within the Town of Niagara-on-the-Lake
 Traffic Traffic Impact Impact Study Study Project Niagara within the Town of Niagara-on-the-Lake Prepared for: Project Niagara July 2009 Traffic Impact Study PROJECT NIAGARA Niagara-On-The-Lake, Ontario
List of Exhibits...ii
 One Brickell Traffic Study TABLE OF CONTENTS List of Exhibits...ii EXECUTIVE SUMMARY...1 1. INTRODUCTION...2 1.1 Study Area...2 1.2 Study Objective...5 2. EXISTING TRAFFIC CONDITIONS...6 2.1 Data Collection...6
December TRANSPORTATION BRIEF 1-19 Beechwood Avenue, Ottawa, ON TRANSPORTATION INFORMATION TE WATER
 December 2012 TRANSPORTATION BRIEF 1-19 Beechwood Avenue, Ottawa, ON TRANSPORTATION INFORMATION TE WATER 1-19 Beechwood Avenue Mixed Use Development Transportation Brief prepared for: Minto Communities
TRAFFIC IMPACT STUDY CRITERIA
 Chapter 6 - TRAFFIC IMPACT STUDY CRITERIA 6.1 GENERAL PROVISIONS 6.1.1. Purpose: The purpose of this document is to outline a standard format for preparing a traffic impact study in the City of Steamboat
TRAFFIC IMPACT STUDY And A TRAFFIC SIGNAL WARRANT ANALYSIS FOR A SENIOR LIVING AND APARTMENT DEVELOPMENT
 TRAFFIC IMPACT STUDY And A TRAFFIC SIGNAL WARRANT ANALYSIS FOR A SENIOR LIVING AND APARTMENT DEVELOPMENT DEERFIELD TOWNSHIP, WARREN COUNTY, OHIO Nantucket Circle and Montgomery Road () Prepared for: ODLE
TRAFFIC IMPACT STUDY COMPREHENSIVE UPDATE TOWN OF THOMPSON S STATION, TENNESSEE PREPARED FOR: THE TOWN OF THOMPSON S STATION
 TRAFFIC IMPACT STUDY COMPREHENSIVE UPDATE TOWN OF THOMPSON S STATION, TENNESSEE PREPARED FOR: THE TOWN OF THOMPSON S STATION Transportation Consultants, LLC 1101 17 TH AVENUE SOUTH NASHVILLE, TN 37212
Figure 1: East West Connector Alignment Alternatives Concept Drawing
 Page 2 of 9 Figure 1: East West Connector Alignment Alternatives Concept Drawing The Montebello Drive extension will run north south and connect Wilsonville Road to the Boones Ferry Road to Brown Road
Bridge Street Corridor Study Report
 Bridge Street Corridor Study Report Prepared for: Prepared by: BRIDGE STREET CORRIDOR STUDY REPORT PREPARED FOR: CITY OF ARROYO GRANDE COMMUNITY DEVELOPMENT DEPARTMENT 300 EAST BRANCH STREET ARROYO GRANDE,
PINESTONE TRAFFIC IMPACT STUDY Travelers Rest, South Carolina
 PINESTONE TRAFFIC IMPACT STUDY Travelers Rest, South Carolina Prepared for Longbranch Development Prepared by January 13, 219 ii Table of Contents Subject Page Signature Page... i Table of Contents...
Signal Warrant Studies
 Signal Warrant Studies Seven Locations Piqua, Ohio December 12, 217 Signal Warrant Studies Seven Locations Piqua, Ohio TABLE OF CONTENTS Executive Summary... 3 Introduction... 5 Study Location... 5 Data
S. Johnston (IBI Group)
") IBI GROUP 100 175 Galaxy Boulevard Toronto ON M9W 0C9 Canada tel 416 679 1930 fax 416 675 4620 ibigroup.com Memorandum To/Attention Project File Date October 15, 2013 From A. Ortlieb Project No 24RX12.0246.00
IBI GROUP 100 175 Galaxy Boulevard Toronto ON M9W 0C9 Canada tel 416 679 1930 fax 416 675 4620 ibigroup.com Memorandum To/Attention Project File Date October 15, 2013 From A. Ortlieb Project No 24RX12.0246.00
TRAFFIC IMPACT STUDY. Creekside Thornton, Colorado. For. August 2015 November 2015 Revised: August Prepared for:
 TRAFFIC IMPACT STUDY For Creekside Thornton, Colorado August 215 November 215 Revised: August 216 Prepared for: Jansen Strawn Consulting Engineers 45 West 2 nd Avenue Denver, Colorado 8223 Prepared by:
Re: Tanger Retail Outlets - Phase 2 Addendum #1 to Phase 1 CTS/TIS
 1223 Michael Street, Suite 100 Ottawa, Ontario K1J 7T2 (613) 738-4160 Fax: (613) 739-7105 www.parsons.com 8 December 2014 OUR REF: TO3186TOA RioCan Management Inc. Yonge Eglinton Centre 2300 Yonge Street
Highway 49, Highway 351 and Highway 91 Improvements Feasibility Study Craighead County
 Highway 49, Highway 351 and Highway 91 Improvements Feasibility Study Craighead County Executive Summary March 2015 Highway 49, Highway 351 and Highway 91 Improvements Feasibility Study Craighead County
NO BUILD TRAFFIC OPERATIONS
 3. 23 NO BUILD TRAFFIC OPERATIONS This section addresses the operations of the transportation system and details how it would be expected to function under year 23 No Build conditions with the projected
King Soopers #116 Thornton, Colorado
 Traffic Impact Study King Soopers #116 Thornton, Colorado Prepared for: Galloway & Company, Inc. 1.0 EXECUTIVE SUMMARY King Soopers #116, a grocery marketplace anchored commercial development, is proposed
LIBERTY TREE ACADEMY TRAFFIC IMPACT STUDY
 LIBERTY TREE ACADEMY TRAFFIC IMPACT STUDY Prepared for: Liberty Tree Academy Prepared by: 161 Blake Street, Suite 2 Denver, Colorado 822 Contact: David Kline, PE, PTOE (33)-572-2 On Behalf of: Liberty
Multnomah County Courthouse Relocation. Transportation Alternatives Analysis Technical Memorandum: FINAL
 Multnomah County Courthouse Relocation Portland, Oregon Transportation Alternatives Analysis Technical Memorandum: FIL Prepared for Multnomah County Facilities and Property Management Division 41 N Dixon
Glenn Avenue Corridor Traffic Operational Evaluation
 Glenn Avenue Corridor Traffic Operational Evaluation PREPARED FOR: THE CITY OF AUBURN PREPARED BY: DECEMBER 2007 Glenn Avenue Corridor Study--Auburn, Alabama TABLE OF CONTENTS Introduction... 1 Background
Low Level Road Improvements Traffic Analysis. Report
 Low Level Road Improvements Traffic Analysis Report June, 22 Table of Contents. INTRODUCTION.... LOW LEVEL ROAD PROJECT....2 STUDY AREA....2. West-End Corridor Improvements... 2.2.2 East-End Corridor Improvements...
STRATEGY 4 INC Mainway, City of Burlington. [ Month Year ] Project No.: TRAFFIC IMPACT AND PARKING STUDY APRIL 2018
![STRATEGY 4 INC Mainway, City of Burlington. [ Month Year ] Project No.: TRAFFIC IMPACT AND PARKING STUDY APRIL 2018](/thumbs/96/127235543.jpg "STRATEGY 4 INC Mainway, City of Burlington. [ Month Year ] Project No.: TRAFFIC IMPACT AND PARKING STUDY APRIL 2018") STRATEGY 4 INC. TRAFFIC IMPACT AND PARKING STUDY 3257 Mainway, City of Burlington Project No.: 27-675 APRIL 28 [ Month Year ] April 7, 28 Reference No. 27-675 Mr. Jeff Kenny Strategy 4 Inc. 262 Bristol
STRATEGY 4 INC. TRAFFIC IMPACT AND PARKING STUDY 3257 Mainway, City of Burlington Project No.: 27-675 APRIL 28 [ Month Year ] April 7, 28 Reference No. 27-675 Mr. Jeff Kenny Strategy 4 Inc. 262 Bristol
Gateway Transportation Study
 Gateway Transportation Study Amherst, Massachusetts SUBMITTED TO University of Massachusetts Amherst Town of Amherst SUBMITTED BY Vanasse Hangen Brustlin, Inc. Watertown, Massachusetts March 213 Back of
Traffic Impact Analysis (TIA) Process and Procedures Manual. September 2017
 Process and Procedures Manual. September 2017") Traffic Impact Analysis (TIA) Process and Procedures Manual Post Office Box 664 101 Huntersville-Concord Road Huntersville, NC 28070 Phone 704-766-2220 Fax 704-992-5528 www.huntersville.org (c) 2017, Town
Traffic Impact Analysis (TIA) Process and Procedures Manual Post Office Box 664 101 Huntersville-Concord Road Huntersville, NC 28070 Phone 704-766-2220 Fax 704-992-5528 www.huntersville.org (c) 2017, Town
Harbord Street and Hoskin Avenue (Queens Park Crescent to Ossington Avenue) Final Report
 Final Report") Consultant Services for Updating Intersections Operations to Accommodate Bi-Directional Cycle Tracks Harbord Street and Hoskin Avenue (Queens Park Crescent to Ossington Avenue) January 30, 2014 Consultant
Consultant Services for Updating Intersections Operations to Accommodate Bi-Directional Cycle Tracks Harbord Street and Hoskin Avenue (Queens Park Crescent to Ossington Avenue) January 30, 2014 Consultant
Sixth Line Development - Transit Facilities Plan
 Memorandum Date: November 13, 2012 To: From: c.c. Subject: Rob Freeman (Freeman Planning) Kevin Phillips Sixth Line Development - Transit Facilities Plan 33016631 This memo was prepared to review the transit
Troutbeck Farm Development
 Troutbeck Farm Development Willistown Township, Chester County PA For Submission To: Willistown Township Last Revised: October, 4 TPD# INLM.A. 5 E. High Street Suite 65 Pottstown, PA 9464 6.36.3 TPD@TrafficPD.com
Magnolia Place. Traffic Impact Analysis. Prepared for: City of San Mateo. Prepared by: Hexagon Transportation Consultants, Inc.
 Magnolia Place Traffic Impact Analysis Prepared for: City of San Mateo Prepared by: Hexagon Transportation Consultants, Inc. Updated January 4, 2010 Table of Contents 1. Introduction...1 2. Existing Conditions...6